The global biofuels industry continues to grow rapidly. Governments push renewable energy adoption. Organizations focus on sustainability goals. Meanwhile, biofuel producers must monitor efficiency, output, costs, and environmental impact continuously. Because operations involve multiple variables, performance tracking becomes critical.
However, when teams rely on scattered spreadsheets or manual reports, visibility drops. As a result, decision-making slows down. That is exactly why a Biofuels KPI Dashboard in Excel becomes an essential management tool.
This article explains what a Biofuels KPI Dashboard in Excel is, why biofuel companies need it, how it works, its worksheet structure, key KPIs, advantages, best practices, and frequently asked questions. By the end, you will clearly understand how this dashboard improves operational control and strategic planning.
Click to Purchases Biofuels KPI Dashboard in Excel
What Is a Biofuels KPI Dashboard in Excel?
A Biofuels KPI Dashboard in Excel is a ready-to-use analytical solution that helps organizations track, measure, and analyze key performance indicators related to biofuel production, efficiency, sustainability, and financial performance.
Instead of manually calculating metrics every month, this dashboard consolidates all KPI data into one structured Excel file. As a result, teams gain instant insights into both short-term and long-term performance.
Why Do Biofuel Organizations Need a KPI Dashboard?
Biofuel operations involve production volumes, conversion efficiency, feedstock utilization, emissions control, and cost management. Because these factors interact constantly, organizations need accurate and timely visibility.
Without a KPI dashboard:
-
Performance gaps remain hidden
-
Targets lack proper monitoring
-
Reporting takes excessive time
-
Historical comparisons become difficult
On the other hand, a KPI dashboard solves these challenges effectively.
Key Reasons to Use a Biofuels KPI Dashboard
-
To track production efficiency consistently
-
To compare actual results with targets
-
To analyze month-to-date and year-to-date trends
-
To evaluate performance against previous years
-
To support sustainability and compliance goals
Therefore, the dashboard turns raw operational data into meaningful insights.
Click to Purchases Biofuels KPI Dashboard in Excel
How Does the Biofuels KPI Dashboard in Excel Work?
This dashboard follows a clean and logical structure. It separates data entry, analysis, and visualization, which improves usability and accuracy.
Simple Working Flow
-
Enter actual KPI values
-
Enter target KPI values
-
Enter previous year values
-
Excel calculates variances automatically
-
Dashboard updates instantly
Because all calculations run in the background, users focus on insights instead of formulas.
How Many Worksheets Are Available in the Dashboard?
The Biofuels KPI Dashboard in Excel includes seven structured worksheets, each designed for a specific function.
What Is the Role of the Home Sheet?
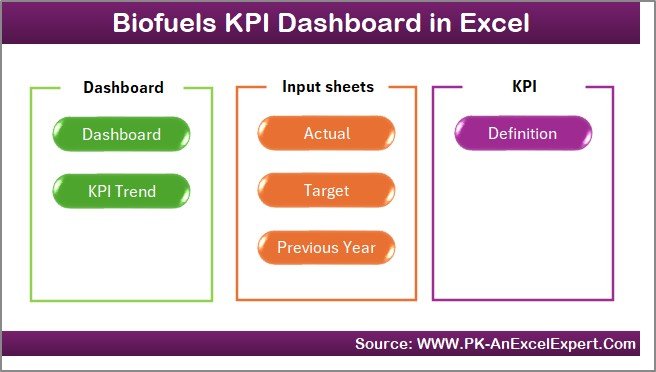
The Home Sheet works as the navigation hub.
Key Features of the Home Sheet
-
Acts as an index page
-
Contains six navigation buttons
-
Allows one-click access to key sheets
Because of this design, users move across the dashboard smoothly and confidently.
Click to Purchases Biofuels KPI Dashboard in Excel
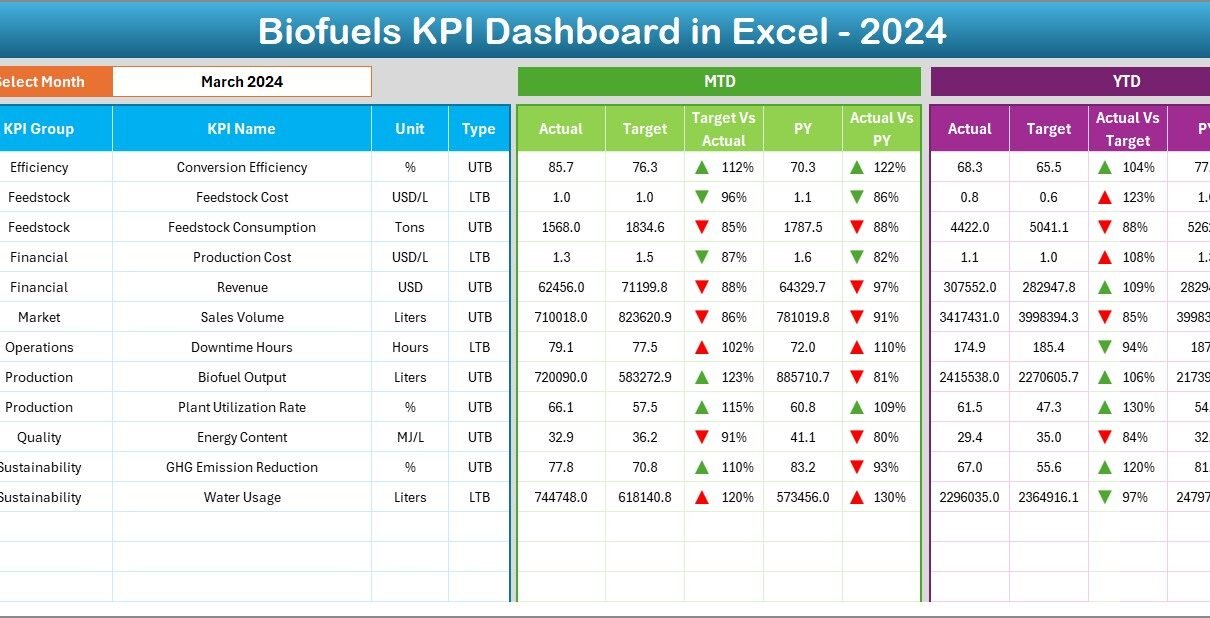
What Information Does the Dashboard Sheet Show?
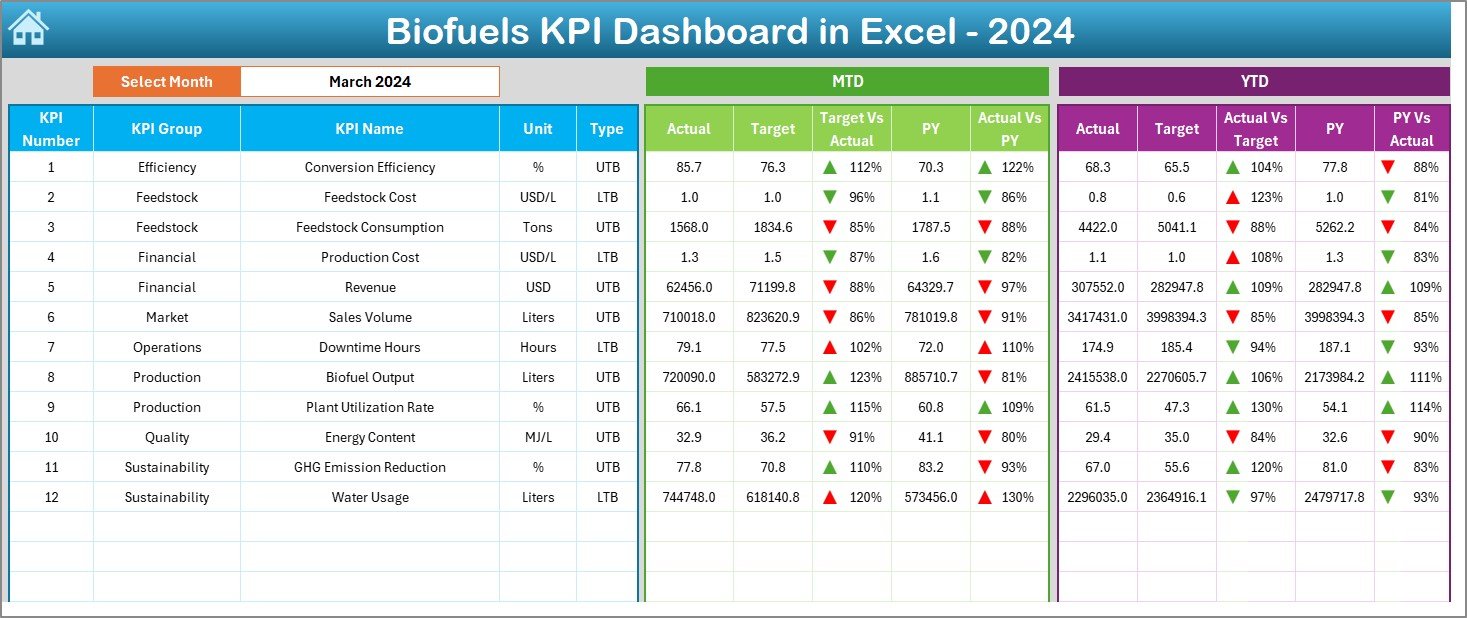
The Dashboard Sheet serves as the main performance overview.
Month Selection Feature
-
Located at cell D3
-
Uses a drop-down list
-
Updates the entire dashboard dynamically
Once you select a month, all KPI values adjust automatically.
Which KPIs Appear on the Dashboard Sheet?
The dashboard displays both MTD and YTD performance for each KPI.
MTD Metrics Displayed
-
MTD Actual
-
MTD Target
-
MTD Previous Year
-
Target vs Actual (MTD)
-
PY vs Actual (MTD)
YTD Metrics Displayed
-
YTD Actual
-
YTD Target
-
YTD Previous Year
-
Target vs Actual (YTD)
-
PY vs Actual (YTD)
Because the dashboard uses conditional formatting with up and down arrows, users immediately identify strong and weak KPIs.
Click to Purchases Biofuels KPI Dashboard in Excel
How Does Conditional Formatting Improve Decision-Making?
Conditional formatting highlights performance visually:
-
🔼 Up arrows indicate positive trends
-
🔽 Down arrows indicate negative trends
Therefore, teams spot issues quickly without scanning complex tables.
What Is the Purpose of the KPI Trend Sheet?
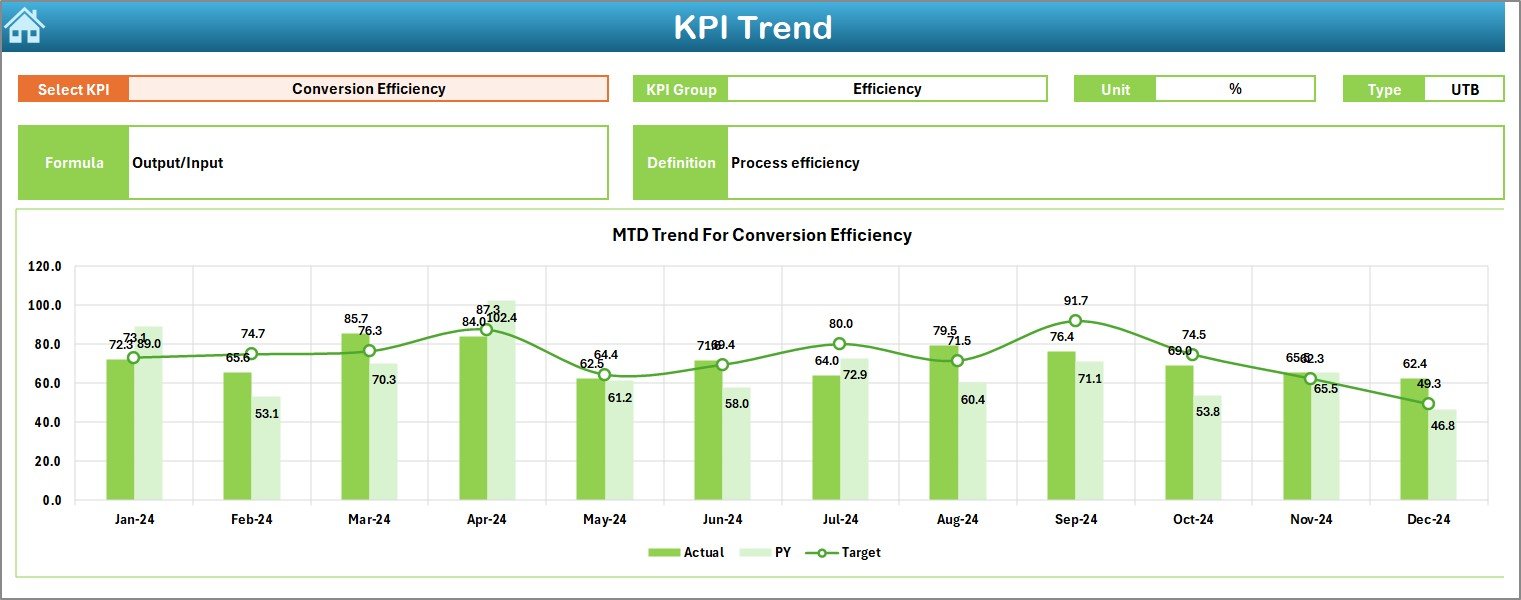
The KPI Trend Sheet allows deep KPI-level analysis.
KPI Selection Control
-
KPI selection available at cell C3
-
Instantly updates all related information
What Details Does the KPI Trend Sheet Display?
After selecting a KPI, the sheet shows:
-
KPI Group
-
Unit of Measurement
-
KPI Type (Lower the Better or Upper the Better)
-
KPI Formula
-
KPI Definition
This structure ensures clarity and standardization across teams.
Which Charts Are Available on the KPI Trend Sheet?
The sheet displays two trend charts:
-
MTD Trend Chart
-
YTD Trend Chart
Each chart compares:
-
Actual values
-
Target values
-
Previous year values
As a result, users understand trends, seasonality, and performance gaps clearly.
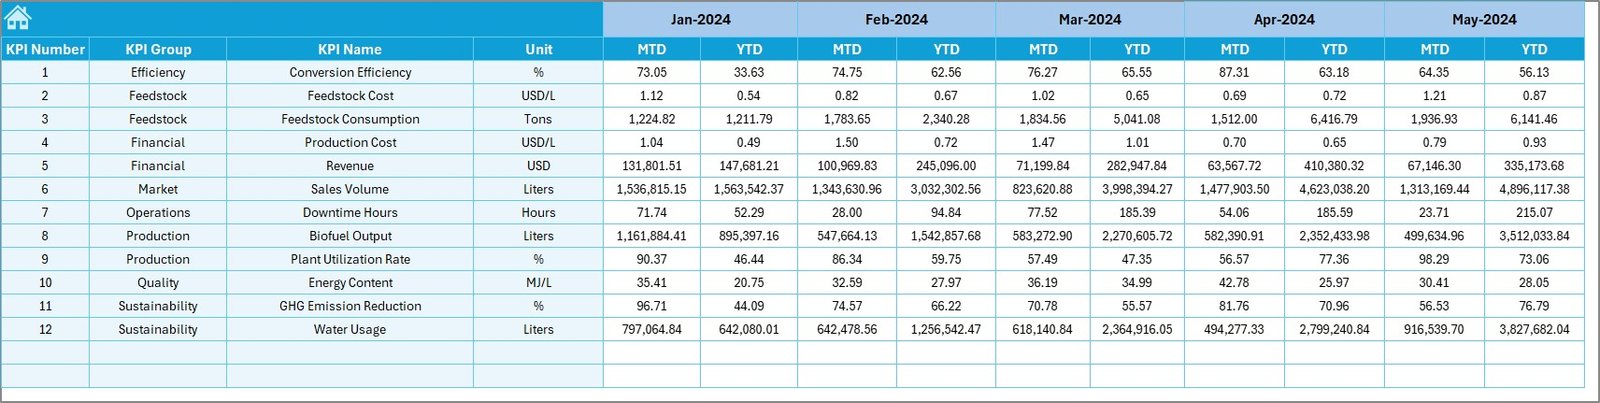
How Does the Actual Numbers Input Sheet Work?
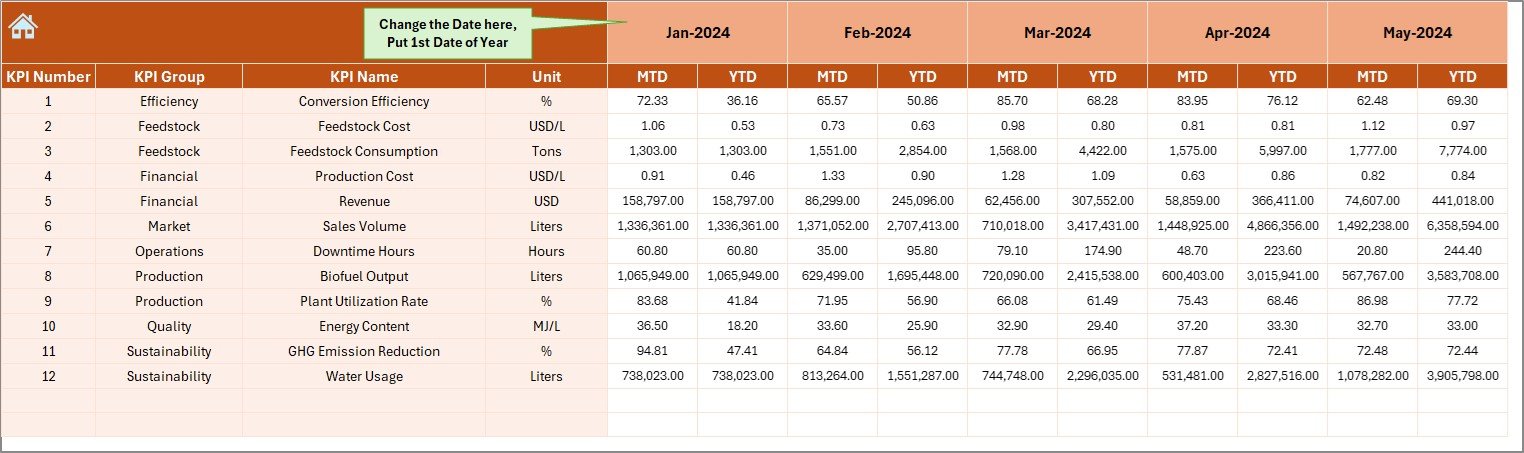
The Actual Numbers Input Sheet captures real operational data.
Key Inputs
-
Month selector at cell E1
-
Enter the first month of the year in E1
-
Input MTD and YTD actual values
This setup maintains time-based consistency across the dashboard.
Click to Purchases Biofuels KPI Dashboard in Excel
What Is the Purpose of the Target Sheet?
The Target Sheet stores planned performance goals.
Why the Target Sheet Matters
-
Keeps planning data separate
-
Allows flexible target changes
-
Supports monthly and yearly tracking
Because targets remain structured, performance comparisons stay accurate.
Why Is the Previous Year Number Sheet Important?
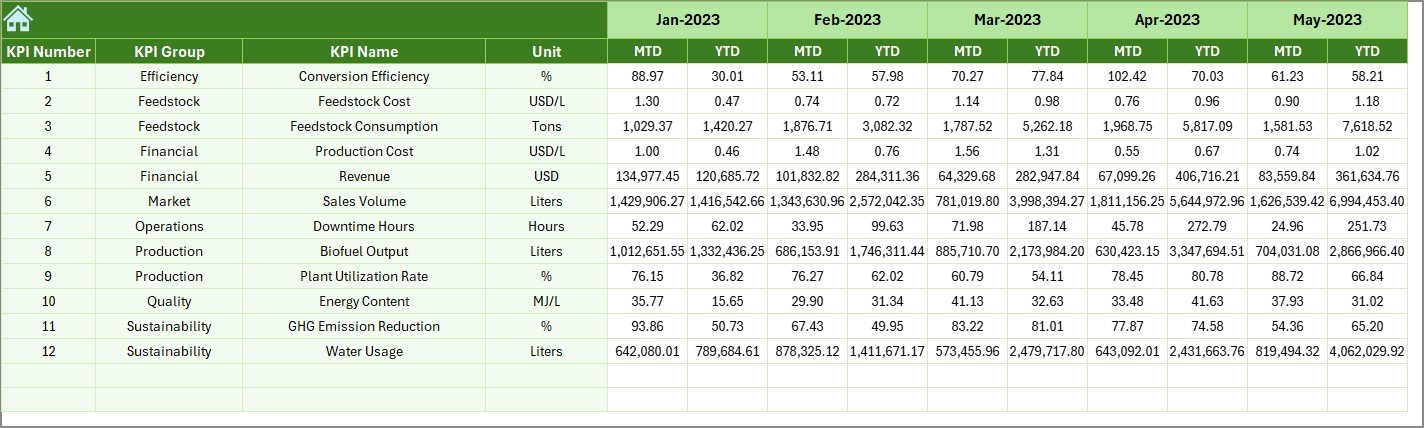
The Previous Year Number Sheet enables historical comparison.
Key Benefits
-
Track year-over-year improvement
-
Identify long-term trends
-
Measure operational maturity
Therefore, organizations evaluate growth realistically.
What Does the KPI Definition Sheet Contain?
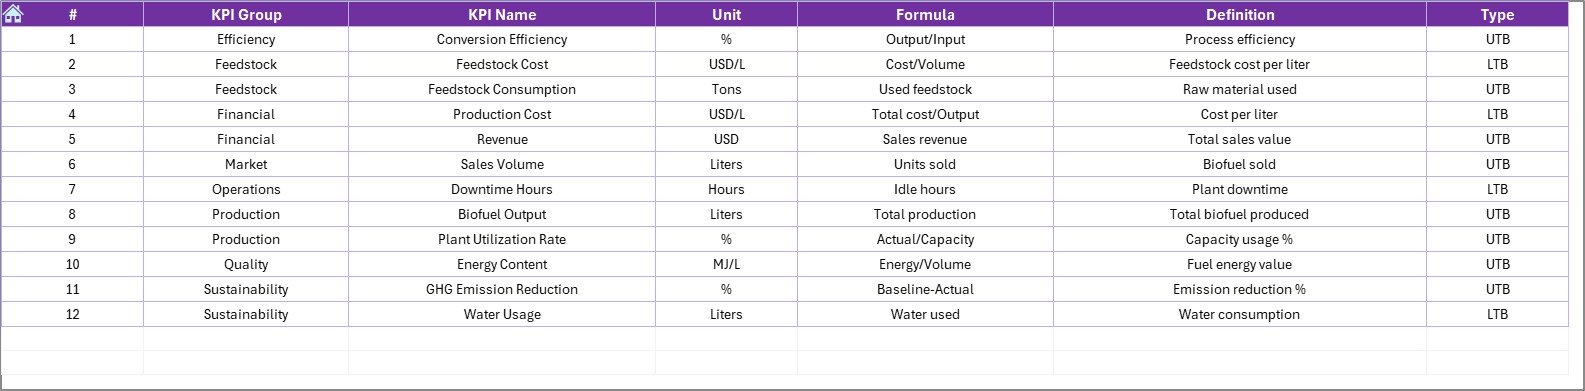
The KPI Definition Sheet ensures consistency and transparency.
Information Included
-
KPI Name
-
KPI Group
-
Unit
-
Formula
-
KPI Definition
Because all KPIs remain documented, interpretation errors reduce significantly.
Which KPIs Can Biofuel Companies Track?
This dashboard supports many biofuel-related KPIs, such as:
-
Biofuel production volume
-
Conversion efficiency
-
Feedstock utilization rate
-
Cost per unit produced
-
Energy yield
-
Emission reduction percentage
-
Plant utilization rate
Teams can add or modify KPIs easily based on operational needs.
Click to Purchases Biofuels KPI Dashboard in Excel
Advantages of Biofuels KPI Dashboard in Excel
Why Should Biofuel Organizations Use This Dashboard?
This dashboard delivers both operational and strategic benefits.
Key Advantages
-
📊 Centralized KPI monitoring
-
🚀 Faster performance reviews
-
🎯 Clear target tracking
-
📈 Trend-based insights
-
♻️ Sustainability performance visibility
-
🧩 Excel-based flexibility
-
⏱️ Reduced manual reporting effort
Because Excel updates instantly, teams save time and reduce errors.
How Does This Dashboard Support Sustainability Goals?
Biofuel organizations focus heavily on sustainability metrics. This dashboard tracks performance consistently, which helps teams align operations with environmental objectives.
As a result, sustainability reporting becomes simpler and more accurate.
Best Practices for the Biofuels KPI Dashboard in Excel
To maximize dashboard value, follow these best practices.
1. Define KPIs Clearly
Always define KPI formulas and logic before entering data.
2. Update Data Regularly
Update actuals, targets, and previous year data monthly.
3. Maintain Consistent Units
Use consistent units across all KPIs.
4. Monitor MTD and YTD Together
MTD shows short-term performance, while YTD reveals long-term trends.
5. Focus on Target Misses
Review underperforming KPIs frequently and act early.
6. Protect Dashboard Formulas
Enter data only in input sheets to avoid errors.
7. Expand KPIs Strategically
Add KPIs only when they align with business goals.
Click to Purchases Biofuels KPI Dashboard in Excel
Who Should Use a Biofuels KPI Dashboard in Excel?
This dashboard suits:
-
Biofuel plant managers
-
Operations teams
-
Sustainability officers
-
Finance teams
-
Business analysts
-
Renewable energy startups
Because Excel remains widely used, adoption stays quick and simple.
Why Choose Excel for Biofuel KPI Tracking?
Excel offers:
-
Low implementation cost
-
Familiar interface
-
High flexibility
-
Easy sharing
-
Quick customization
For many biofuel organizations, Excel provides the perfect balance between power and simplicity.
Conclusion: Why the Biofuels KPI Dashboard in Excel Matters
Biofuel operations require constant monitoring and optimization. Without clear KPIs, teams lose visibility and control. A Biofuels KPI Dashboard in Excel solves this challenge by delivering structured insights, trend analysis, and target comparisons in one file.
By combining MTD and YTD analysis, trend charts, and KPI documentation, this dashboard empowers teams to make confident, data-driven decisions consistently.
Click to Purchases Biofuels KPI Dashboard in Excel
Frequently Asked Questions (FAQs)
What is a Biofuels KPI Dashboard in Excel?
It is an Excel-based dashboard that tracks key performance indicators for biofuel operations using MTD, YTD, target, and previous year data.
Can non-technical users maintain this dashboard?
Yes. Users only need to enter data in structured sheets.
Can I add new KPIs?
Yes. You can add new KPIs by updating the input and definition sheets.
Does the dashboard support year-over-year analysis?
Yes. It compares current year performance with previous year values.
Does the dashboard update automatically?
Yes. Once you update the input sheets, all visuals update automatically.
Is this dashboard suitable for sustainability reporting?
Yes. It supports tracking efficiency, output, and sustainability-related KPIs.
Click to Purchases Biofuels KPI Dashboard in Excel
Visit our YouTube channel to learn step-by-step video tutorials