The biofuels industry plays a vital role in the global shift toward clean and renewable energy. However, as operations grow, tracking performance, meeting targets, and comparing results across months and years becomes more complex. Therefore, organizations need a clear, structured, and reliable way to monitor their key performance indicators.
That is exactly where a Biofuels KPI Dashboard in Power BI delivers exceptional value.
This in-depth guide explains what a Biofuels KPI Dashboard in Power BI is, why it matters, how it works, and how each dashboard page supports decision-making. Moreover, you will learn about its advantages, best practices, and common questions that organizations often ask before implementation.
Click to Purchases Biofuels KPI Dashboard in Power BI
What Is a Biofuels KPI Dashboard in Power BI?
A Biofuels KPI Dashboard in Power BI is a ready-to-use analytical solution designed to track, monitor, and compare critical performance metrics related to biofuel production, efficiency, sustainability, and compliance.
Instead of relying on scattered Excel sheets or manual reports, this dashboard consolidates all KPI data into a single interactive reporting environment using Power BI.
As a result, decision-makers gain:
-
Faster access to performance insights
-
Clear visibility into target achievement
-
Reliable month-to-date (MTD) and year-to-date (YTD) comparisons
Why Do Biofuel Organizations Need a KPI Dashboard?
Biofuel operations involve multiple KPIs across production, efficiency, cost, sustainability, and compliance. However, many organizations still track these metrics manually.
Because of that, teams often face:
-
Delayed reporting cycles
-
Inconsistent KPI definitions
-
Limited visibility into trends
-
Reactive decision-making
A Biofuels KPI Dashboard in Power BI solves these challenges by delivering real-time insights, standardized KPIs, and visual performance tracking.
How Does a Biofuels KPI Dashboard in Power BI Work?
The dashboard uses Excel as the data source and Power BI as the visualization and analytics layer. This structure keeps data entry simple while enabling powerful analysis.
Data Flow Overview
-
Users enter KPI data in Excel
-
Power BI refreshes the data
-
Dashboards update automatically
-
Users analyze trends and performance
This approach ensures flexibility, accuracy, and scalability for growing biofuel operations.
Click to Purchases Biofuels KPI Dashboard in Power BI
What Are the Key Pages in the Biofuels KPI Dashboard in Power BI?
The dashboard includes three structured pages, each designed to serve a specific analytical purpose.
1) Summary Page: How Does It Provide an Executive-Level Overview?
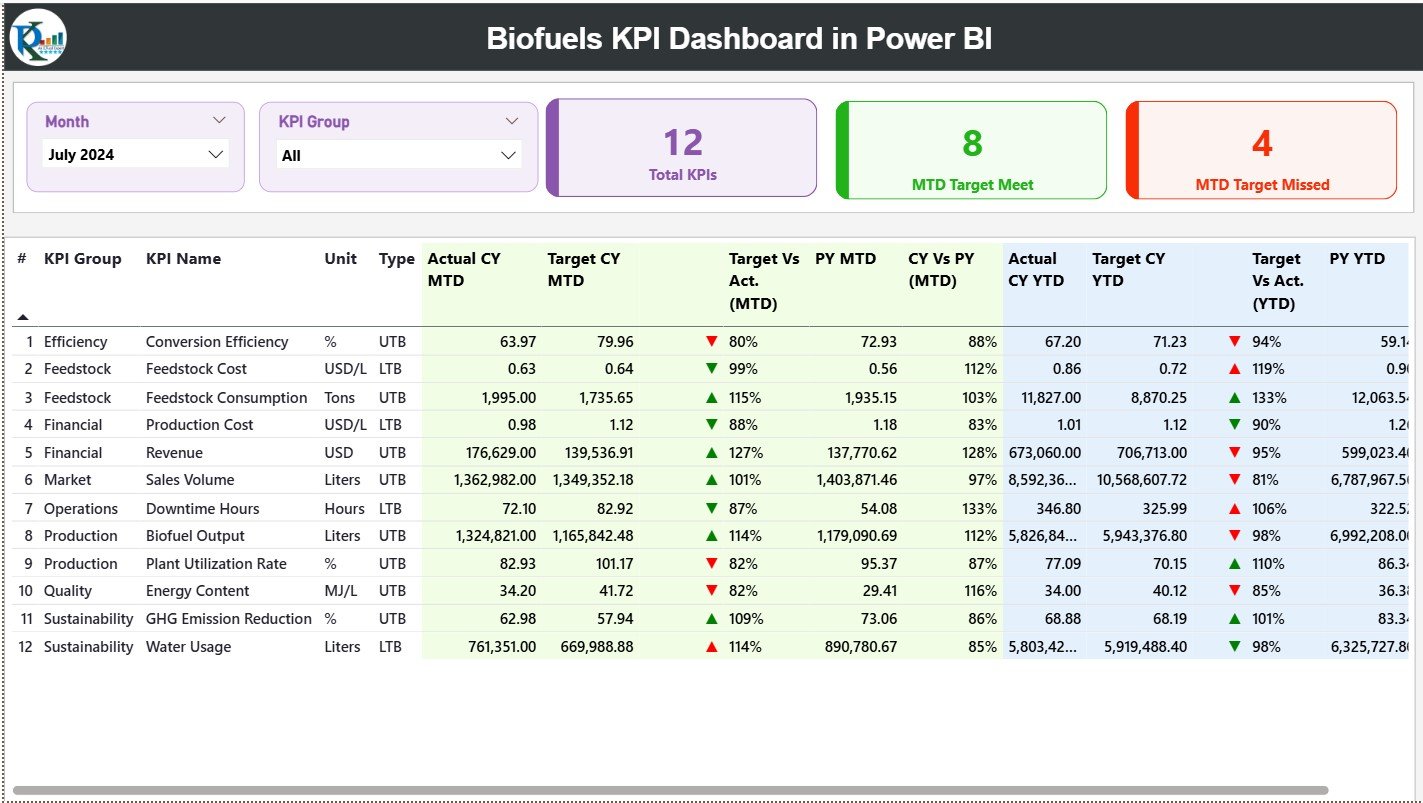
The Summary Page acts as the main landing page of the dashboard. It delivers a complete snapshot of KPI performance at a glance.
Interactive Slicers
At the top of the page, users can filter data using:
-
Month slicer
-
KPI Group slicer
Because of these slicers, decision-makers can instantly focus on specific time periods or KPI categories.
KPI Performance Cards
The summary page displays three key cards:
-
Total KPIs Count
-
MTD Target Met Count
-
MTD Target Missed Count
These cards help leaders immediately understand overall performance health.
Detailed KPI Performance Table
Below the cards, a comprehensive table displays all KPI-level details.
Columns Included in the Table
-
KPI Number – Sequence number for easy reference
-
KPI Group – Category or classification of the KPI
-
KPI Name – Name of the performance indicator
-
Unit – Measurement unit (%, tons, liters, etc.)
-
Type – KPI type:
-
LTB (Lower the Better)
-
UTB (Upper the Better)
-
Month-to-Date (MTD) Metrics
-
Actual CY MTD – Current year actual MTD value
-
Target CY MTD – Current year target MTD value
-
MTD Icon – ▲ or ▼ icons with green/red indicators
-
Target vs Actual (MTD %) – Actual ÷ Target
-
PY MTD – Previous year MTD value
-
CY vs PY (MTD %) – CY MTD ÷ PY MTD
Year-to-Date (YTD) Metrics
-
Actual CY YTD – Current year actual YTD value
-
Target CY YTD – Current year target YTD value
-
YTD Icon – ▲ or ▼ performance indicator
-
Target vs Actual (YTD %) – Actual ÷ Target
-
PY YTD – Previous year YTD value
-
CY vs PY (YTD %) – CY YTD ÷ PY YTD
Because of this structure, users can analyze performance both short-term and long-term without switching reports.
Click to Purchases Biofuels KPI Dashboard in Power BI
2) KPI Trend Page: How Can You Analyze KPI Performance Over Time?
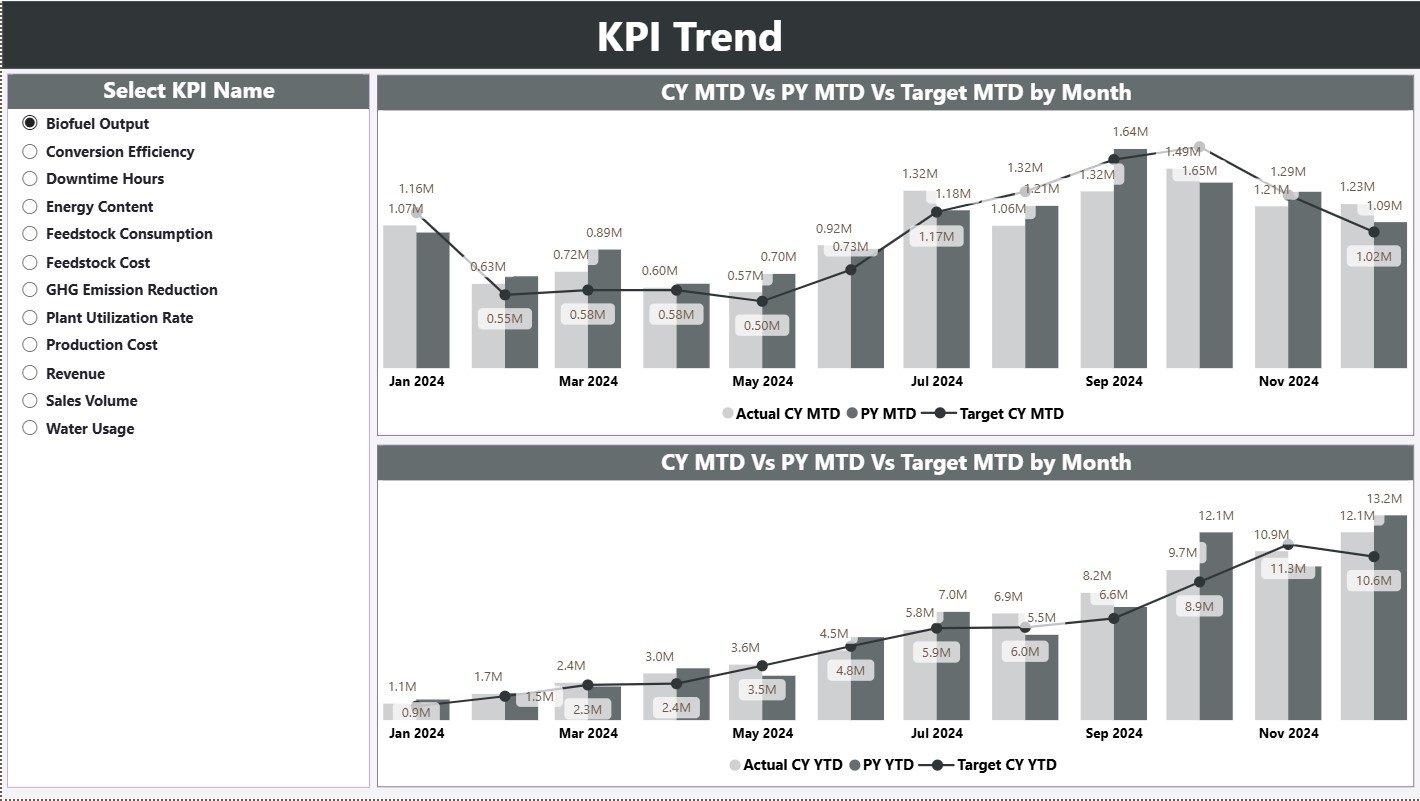
The KPI Trend Page focuses on trend-based analysis.
KPI Selection
A slicer on the left allows users to select a specific KPI.
Combo Charts
The page includes two combo charts:
-
MTD Trend Chart
-
YTD Trend Chart
Each chart compares:
-
Current Year Actual
-
Previous Year Actual
-
Target Values
Therefore, users can clearly identify:
-
Performance improvements
-
Seasonal patterns
-
Target achievement gaps
3) KPI Definition Page: Why Is Drill-Through Important?
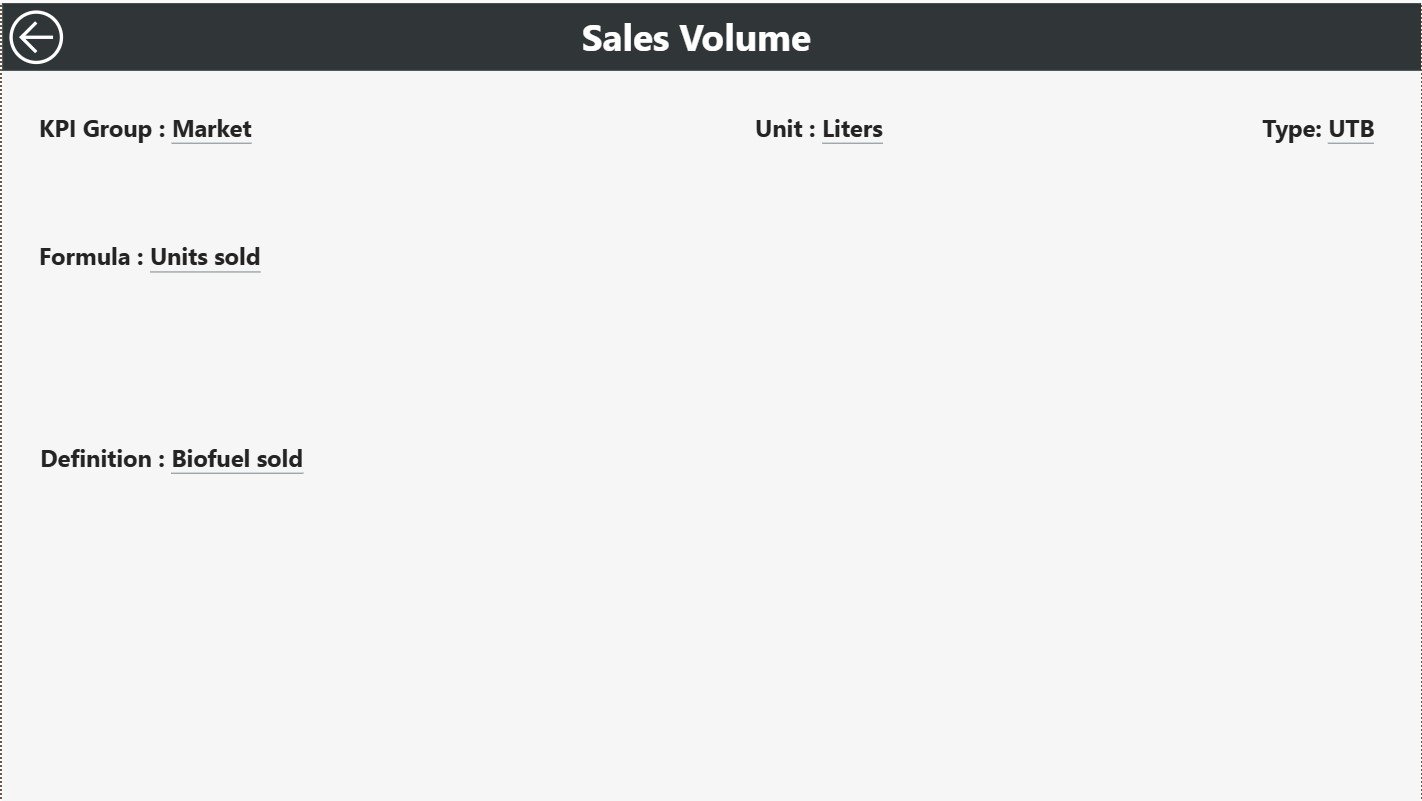
The KPI Definition Page acts as a drill-through page and remains hidden by default.
What Information Does It Show?
-
KPI Formula
-
KPI Definition
-
Unit of Measurement
-
KPI Type (LTB or UTB)
From the Summary Page, users can drill through to this page for clarity and context.
Navigation
A Back button on the top-left corner allows users to return to the main page instantly.
This feature ensures KPI transparency and eliminates confusion across teams.
Click to Purchases Biofuels KPI Dashboard in Power BI
How Is Excel Used as the Data Source?
The dashboard uses a structured Excel file with three input worksheets.
1) Input_Actual Sheet
This sheet captures actual performance values.
Columns Included
-
KPI Name
-
Month (first date of the month)
-
MTD Value
-
YTD Value
2) Input_Target Sheet
This sheet stores target benchmarks.
Columns Included
-
KPI Name
-
Month (first date of the month)
-
Target MTD Value
-
Target YTD Value
3) KPI Definition Sheet
This sheet defines KPI metadata.
Columns Included
-
KPI Number
-
KPI Group
-
KPI Name
-
Unit
-
Formula
-
Definition
-
Type (LTB or UTB)
Because of this structure, users can maintain clean, consistent, and reliable data.
Advantages of Biofuels KPI Dashboard in Power BI
Why Should Biofuel Organizations Use This Dashboard?
📊 Centralized Performance Monitoring
All KPIs stay in one dashboard, which eliminates scattered reports.
⏱ Faster Decision-Making
Real-time insights help leaders act quickly and confidently.
🎯 Clear Target Tracking
MTD and YTD target comparisons highlight performance gaps instantly.
🔍 Improved KPI Transparency
Drill-through definitions ensure everyone understands each KPI.
📈 Strong Trend Analysis
MTD and YTD trends reveal long-term patterns and risks.
🌱 Sustainability Alignment
The dashboard supports monitoring sustainability and efficiency goals.
How Does This Dashboard Support Sustainability Goals?
Biofuel organizations focus heavily on sustainability, efficiency, and emissions reduction. This dashboard helps by:
-
Tracking efficiency-related KPIs
-
Comparing performance year over year
-
Highlighting underperforming areas
-
Supporting data-driven sustainability initiatives
As a result, organizations align operational performance with environmental objectives.
Click to Purchases Biofuels KPI Dashboard in Power BI
Best Practices for the Biofuels KPI Dashboard in Power BI
How Can You Maximize Dashboard Value?
✔ Maintain Consistent KPI Definitions
Always standardize KPI formulas and units.
✔ Update Excel Data Regularly
Refresh actual and target data on a fixed schedule.
✔ Use First Date of Month Correctly
Always use the first date of the month for accurate time intelligence.
✔ Review MTD and YTD Together
Analyze short-term results along with long-term performance.
✔ Monitor LTB and UTB KPIs Carefully
Interpret KPI direction correctly to avoid wrong conclusions.
✔ Train Users on Drill-Through
Ensure teams know how to access KPI definitions.
Click to Purchases Biofuels KPI Dashboard in Power BI
Who Can Benefit from a Biofuels KPI Dashboard in Power BI?
This dashboard suits:
-
Biofuel manufacturers
-
Renewable energy companies
-
Sustainability managers
-
Operations heads
-
Strategy and planning teams
-
Compliance and reporting teams
Because of its flexible structure, both small and large organizations can use it effectively.
How Does This Dashboard Improve Operational Efficiency?
The dashboard reduces manual reporting, improves visibility, and encourages proactive management. Therefore, teams spend less time preparing reports and more time optimizing performance.
Conclusion: Why Is a Biofuels KPI Dashboard in Power BI a Smart Investment?
A Biofuels KPI Dashboard in Power BI transforms raw data into meaningful insights. It simplifies KPI tracking, improves transparency, and enables faster, smarter decisions.
By combining structured Excel inputs with interactive Power BI visuals, organizations gain a powerful tool to manage performance, achieve targets, and support sustainability goals.
In today’s data-driven renewable energy landscape, this dashboard is not just useful—it is essential.
Frequently Asked Questions (FAQs)
What is the main purpose of a Biofuels KPI Dashboard in Power BI?
It helps organizations monitor, analyze, and compare biofuel KPIs efficiently using interactive visuals.
Do I need technical expertise to use this dashboard?
No. Users only need to update Excel data and refresh the dashboard.
Can I add more KPIs to the dashboard?
Yes. You can extend the KPI Definition and input sheets easily.
How often should I refresh the data?
You should refresh data monthly or as frequently as operations require.
Can this dashboard support sustainability reporting?
Yes. It supports efficiency, performance, and sustainability-focused KPIs.
Is Excel mandatory as a data source?
In this setup, Excel acts as the primary data source for simplicity and flexibility.
Click to Purchases Biofuels KPI Dashboard in Power BI
Visit our YouTube channel to learn step-by-step video tutorials