In today’s fast-growing biotech and life sciences industry, companies generate massive volumes of data every day. However, many professionals still struggle to convert that data into meaningful insights. As a result, decision-making becomes slow and inefficient.
So, how can you track funding, valuation, revenue, innovation, and performance in one place?
The answer is simple: Bioinformatics Companies Dashboard in Excel
In this article, you will learn everything about this powerful dashboard, including its features, analysis pages, advantages, best practices, and how it can transform your business decisions.
Click to buy Bioinformatics Companies Dashboard in Excel
What is a Bioinformatics Companies Dashboard in Excel?
A Bioinformatics Companies Dashboard in Excel is a ready-to-use analytical tool that helps you monitor and evaluate the performance of bioinformatics companies using structured data and visual insights.
Instead of using multiple spreadsheets, you can view all key metrics in one interactive dashboard. Therefore, you can quickly identify trends, compare performance, and make data-driven decisions.
Moreover, this dashboard focuses on key business areas such as:
- Funding and valuation
- Revenue and growth
- R&D performance
- Regulatory readiness
- Product outcomes
- Regional performance
Why Do Bioinformatics Companies Need a Dashboard?
Bioinformatics companies operate in a highly competitive and data-driven environment. However, without proper tools, tracking performance becomes difficult.
Here’s why a dashboard becomes essential:
- Centralized Data View – You can see all KPIs in one place
- Faster Decision Making – You can analyze trends instantly
- Performance Monitoring – You can track growth and efficiency
- Better Insights – You can identify opportunities and risks quickly
Therefore, using an Excel dashboard helps companies stay ahead in the competitive biotech landscape.
What Does the Bioinformatics Companies Dashboard Include?
This dashboard contains multiple sheets that provide deep insights into different aspects of business performance. Let’s explore each page in detail.
Overview Sheet – What High-Level Insights Can You Get?
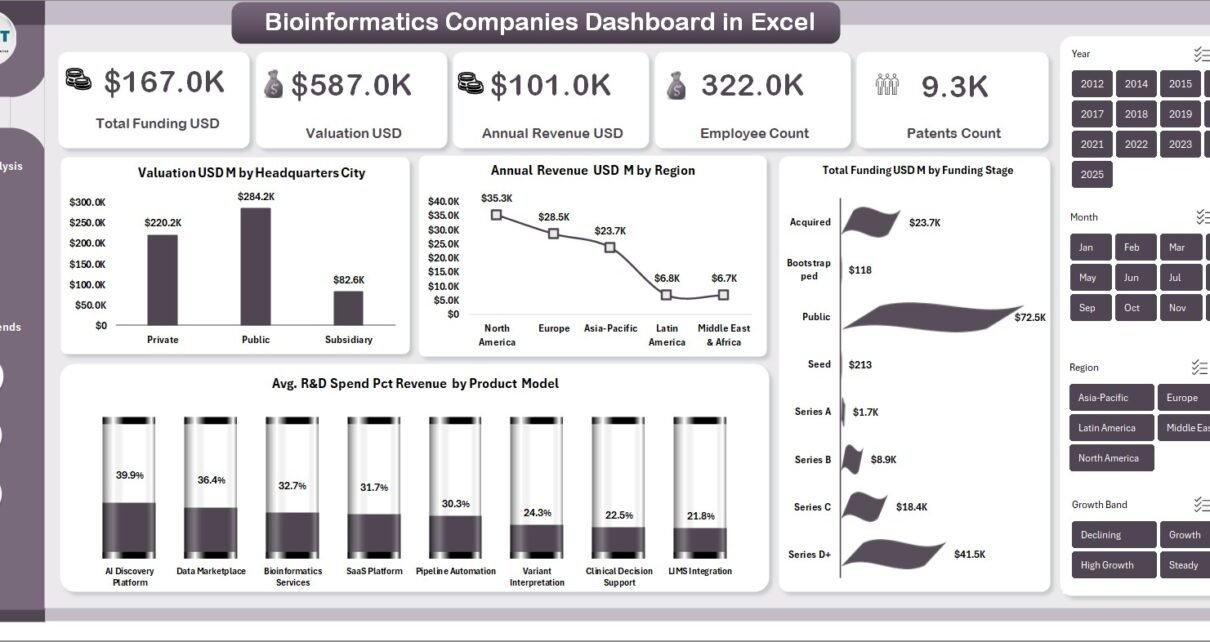
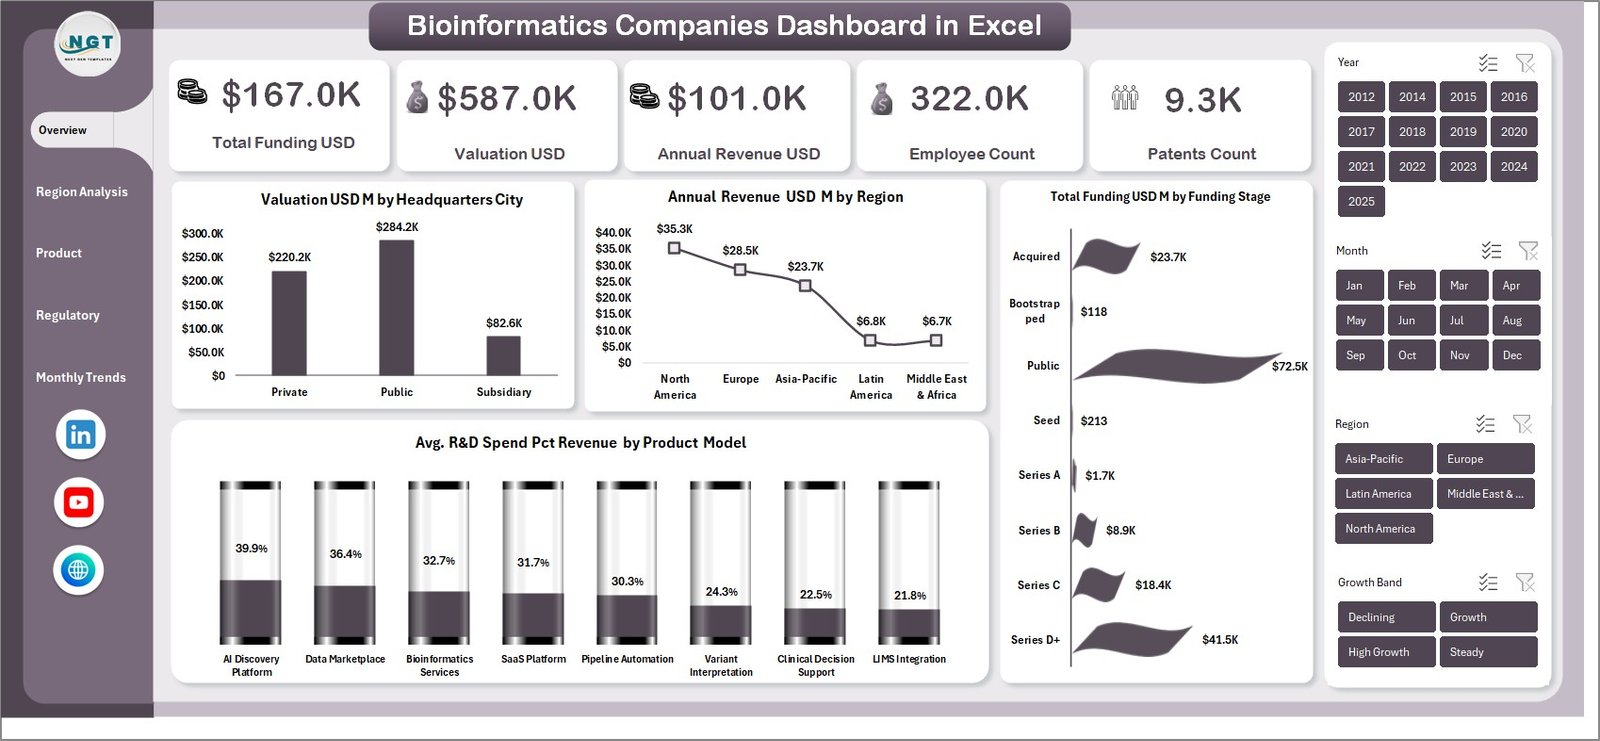
The Overview Page gives you a complete snapshot of your company’s performance.
Key KPI Cards:
- Total Funding USD – Shows the total investment received
- Valuation USD – Displays company valuation
- Annual Revenue USD – Highlights total revenue
- Employee Count – Shows workforce sizePatents Count – Reflects innovation capability
Charts Included:
- Valuation USD (M) by Headquarters City
This chart helps you identify which cities have the highest company valuations. Therefore, you can understand geographical dominance. - Annual Revenue USD (M) by Region
It shows revenue distribution across regions. As a result, you can focus on high-performing markets. - Total Funding USD (M) by Funding Stage
This chart explains how funding varies across different stages like seed, series A, or IPO. - Avg. R&D Spend (% of Revenue) by Product Model
It highlights how much companies invest in innovation based on their product strategy.
Overall, the Overview page gives quick insights that support strategic planning.
Click to buy Bioinformatics Companies Dashboard in Excel
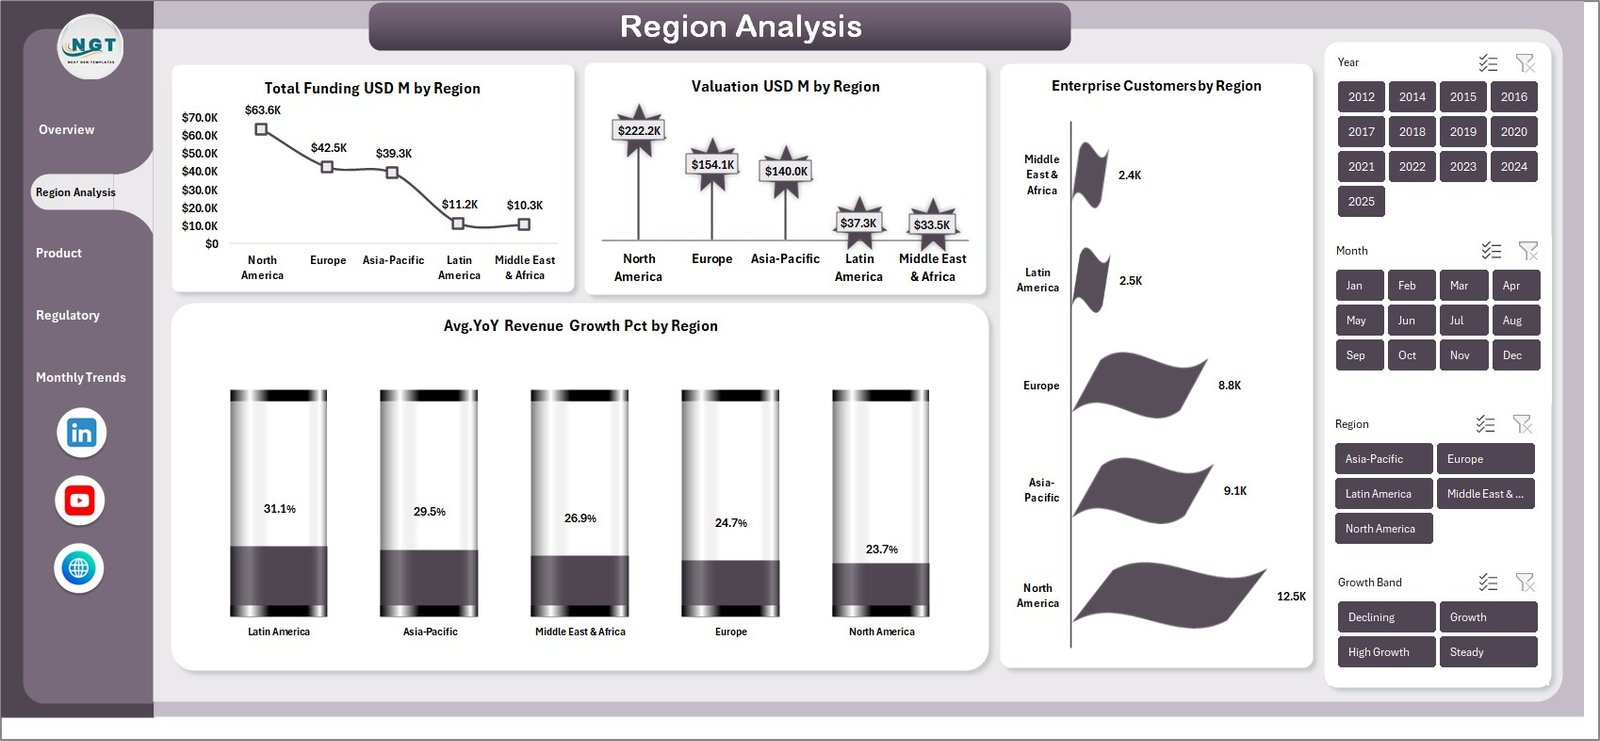
Region Analysis – How Does Performance Vary Across Regions?
The Region Analysis Page focuses on geographical performance. This helps companies understand regional strengths and weaknesses.
Charts Included:
- Total Funding USD (M) by Region
You can identify which regions attract more investment. - Valuation USD (M) by Region
This chart shows how company valuation differs globally. - Enterprise Customers by Region
It highlights customer distribution across regions. - Avg YoY Revenue Growth (%) by Region
You can track growth trends in each region.
Therefore, this page helps businesses expand strategically into high-growth regions.
Click to buy Bioinformatics Companies Dashboard in Excel
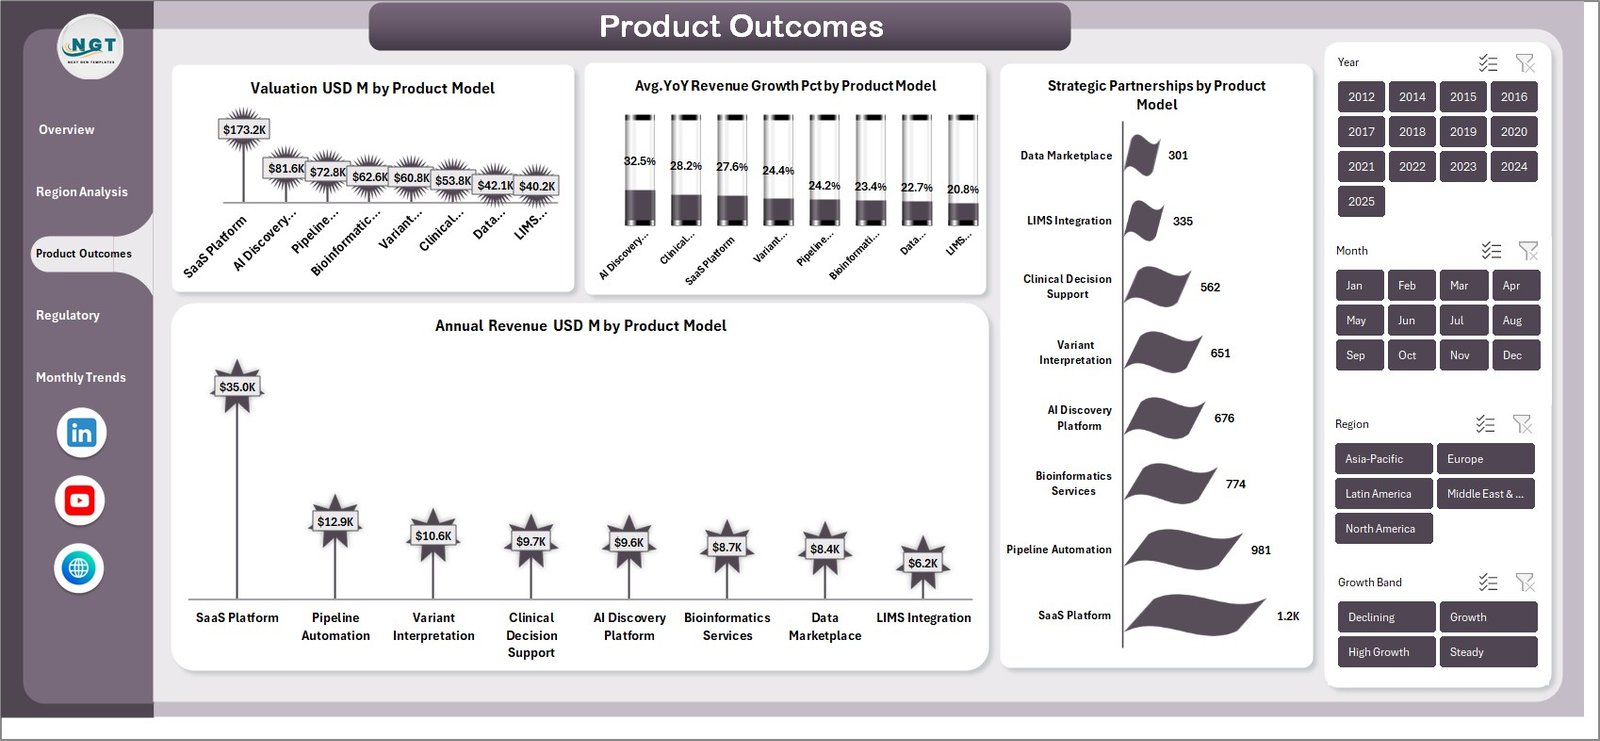
Product Outcomes – Which Products Perform the Best?
The Product Outcomes Page provides insights into how different product models perform.
Charts Included:
- Valuation USD (M) by Product Model
You can identify which product types drive higher valuations. - Avg YoY Revenue Growth (%) by Product Model
This chart shows which products grow faster. - Strategic Partnerships by Product
It highlights collaboration opportunities across products. - Annual Revenue USD (M) by Product Model
You can compare revenue contribution by each product type.
As a result, companies can focus on high-performing product strategies.
Click to buy Bioinformatics Companies Dashboard in Excel
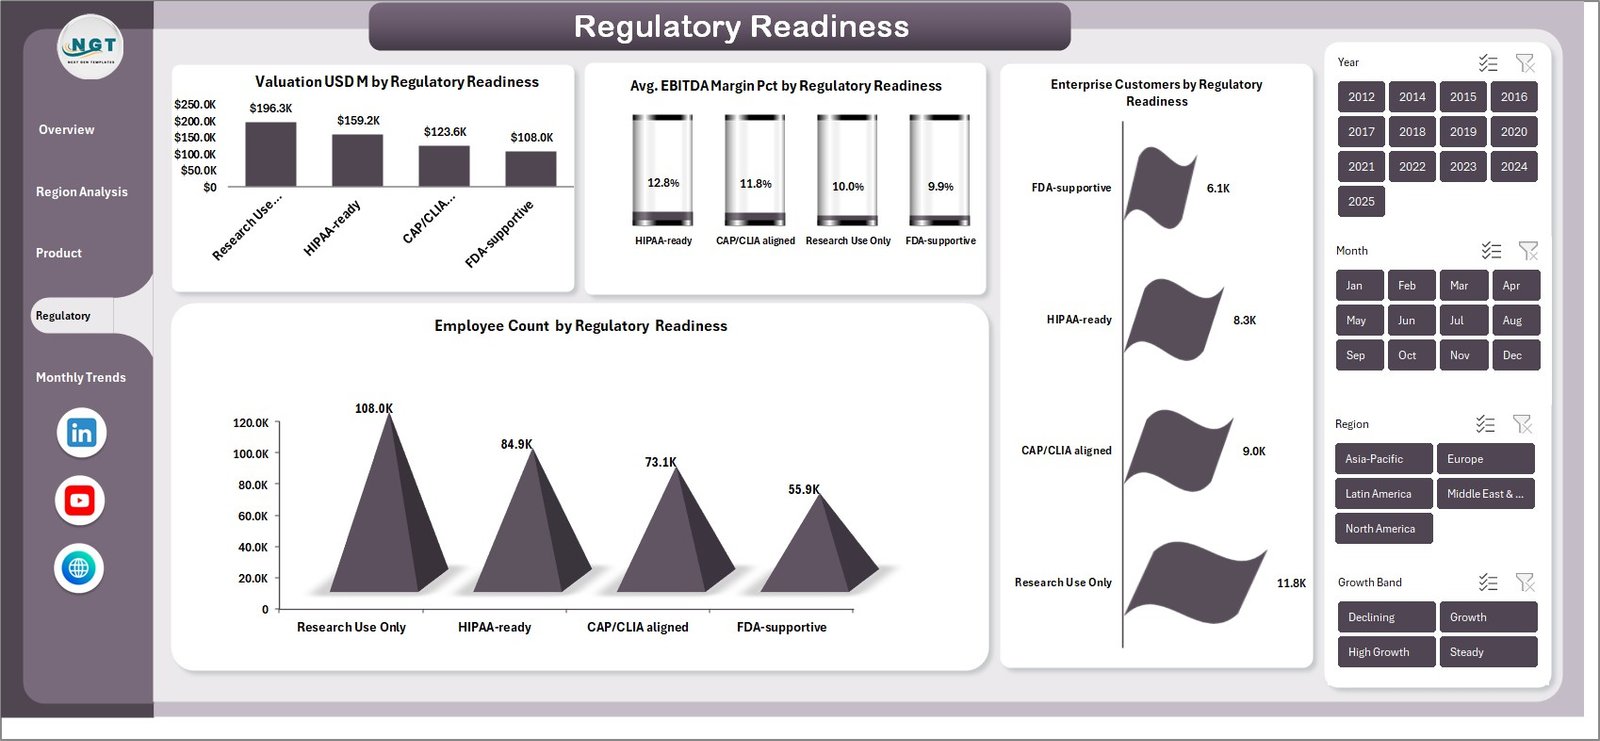
Regulatory Readiness – How Prepared is Your Business?
In bioinformatics, regulatory compliance plays a crucial role. Therefore, the Regulatory Readiness Page becomes extremely important.
Charts Included:
- Valuation USD (M) by Regulatory Readiness
You can see how compliance impacts valuation. - Avg EBITDA Margin (%) by Regulatory Readiness
This chart shows profitability based on regulatory status. - Enterprise Customers by Regulatory Readiness
It helps identify customer trust levels. - Employee Count by Regulatory Readiness
You can analyze workforce distribution based on compliance.
Hence, this page helps organizations improve compliance and trust.
Click to buy Bioinformatics Companies Dashboard in Excel
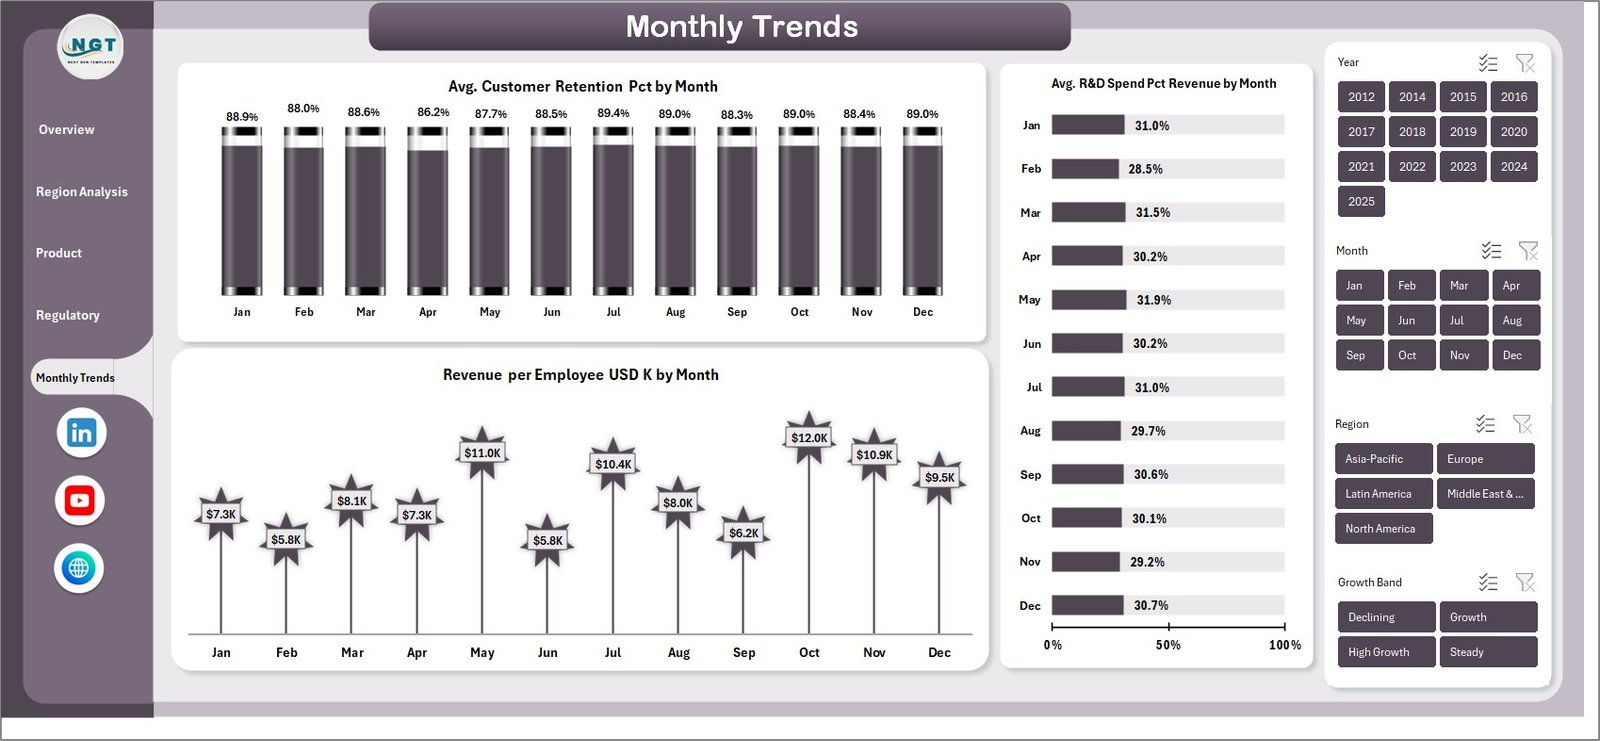
Monthly Trends – How Does Performance Change Over Time?
The Monthly Trends Page focuses on time-based analysis.
Charts Included:
- Avg Customer Retention (%) by Month
You can track how well companies retain customers. - Avg R&D Spend (% of Revenue) by Month
It shows how investment in innovation changes over time. - Revenue per Employee (USD K) by Month
This chart highlights productivity trends.
Therefore, this page helps in forecasting and performance tracking.
Click to buy Bioinformatics Companies Dashboard in Excel
What Insights Can You Generate from This Dashboard?
Using this dashboard, you can perform multiple types of analysis:
- Growth Analysis – Track revenue and valuation trends
- Financial Analysis – Evaluate funding and profitability
- Regional Analysis – Compare global performance
- Innovation Analysis – Monitor patents and R&D spend
- Customer Analysis – Understand retention and enterprise clients
As a result, businesses can make smarter and faster decisions.
Advantages of Bioinformatics Companies Dashboard in Excel
Using this dashboard provides several benefits:
Improved Decision Making
You can access real-time insights, so you can make faster decisions.
Better Data Visualization
You can convert complex data into simple charts and visuals.
Time Saving
You no longer need to create reports manually.
Performance Tracking
You can monitor KPIs regularly and identify gaps quickly.
Increased Accuracy
You reduce human errors by using automated calculations.
Scalability
You can easily update and expand the dashboard as your business grows.
Best Practices for the Bioinformatics Companies Dashboard in Excel
To get the best results, you should follow these best practices:
Keep Data Clean and Structured
Always maintain consistent and accurate data.
Use Dynamic Filters and Slicers
This allows users to interact with the dashboard easily.
Update Data Regularly
Frequent updates ensure accurate insights.
Focus on Key KPIs Only
Avoid overcrowding the dashboard with too many metrics.
Use Clear Visuals
Choose charts that are easy to understand.
Optimize Performance
Reduce heavy formulas to ensure smooth performance.
How Can This Dashboard Improve Business Strategy?
This dashboard not only shows data but also helps you take action.
For example:
- You can identify high-growth regions and expand operations
- You can invest more in high-performing product models
- You can improve regulatory compliance for better valuation
- You can optimize R&D spending for innovation
Therefore, it becomes a powerful tool for strategic planning.
Who Can Benefit from This Dashboard?
This dashboard is useful for multiple professionals:
- Business Analysts
- Bioinformatics Researchers
- Data Analysts
- Investors and Venture Capitalists
- Company Executives
Hence, anyone working in biotech or analytics can benefit from this tool.
Conclusion – Why Should You Use This Dashboard?
The Bioinformatics Companies Dashboard in Excel is a powerful and user-friendly solution that transforms complex data into actionable insights.
Instead of relying on scattered reports, you can monitor everything in one place. Moreover, you can track performance, identify trends, and improve decision-making with ease.
Therefore, if you want to stay competitive in the bioinformatics industry, this dashboard becomes an essential tool.
Frequently Asked Questions (FAQs)
What is a Bioinformatics Dashboard?
A bioinformatics dashboard is a tool that visualizes data related to biotech companies, including funding, revenue, and research metrics.
Why should I use Excel for dashboards?
Excel is easy to use, flexible, and widely available. Therefore, it becomes a great tool for building dashboards.
Can I customize this dashboard?
Yes, you can easily modify KPIs, charts, and filters based on your business needs.
What type of data is required?
You need data related to funding, revenue, employees, R&D, and customer metrics.
How often should I update the dashboard?
You should update it regularly, preferably monthly, to ensure accurate insights.
Is this dashboard suitable for small companies?
Yes, both small and large companies can use this dashboard effectively.
Visit our YouTube channel to learn step-by-step video tutorials
Click to buy Bioinformatics Companies Dashboard in Excel