In today’s rapidly evolving financial landscape,Blockchain Finance Dashboard in Power BI
generates massive volumes of transactional data every second. From cryptocurrency transfers to smart contract executions, businesses must handle complex datasets efficiently. However, when this data remains scattered across multiple systems, it becomes difficult to extract meaningful insights.
So, how can financial analysts, crypto traders, and blockchain businesses track transactions, monitor risks, and analyze performance—all in one place?
Click to Purchases Blockchain Finance Dashboard in Power BI
👉 The answer is the Blockchain Finance Dashboard in Power BI.
This powerful, ready-to-use dashboard transforms raw blockchain data into actionable insights using dynamic visuals, KPI cards, and interactive filters. Moreover, it helps you make faster, smarter, and data-driven financial decisions.
In this detailed guide, you will learn everything about this dashboard, including its features, structure, advantages, best practices, and frequently asked questions.
📊 What is a Blockchain Finance Dashboard in Power BI?
A Blockchain Finance Dashboard in Power BI is an advanced analytics tool designed to monitor, analyze, and visualize blockchain financial data in real time.
Instead of managing multiple reports, you can use this dashboard to:
-
📈 Track blockchain transactions and performance
-
💰 Analyze transaction amounts and gas fees
-
🔍 Monitor wallet behavior and transaction types
-
⚠️ Identify high-risk transactions instantly
-
📊 Compare trends across months and blockchain types
As a result, you gain complete control over your blockchain financial ecosystem.
❓ Why Do You Need a Blockchain Finance Dashboard?
Blockchain data grows rapidly. Therefore, manual analysis becomes inefficient and time-consuming.
Here’s why you need this dashboard:
-
✔️ You get a centralized view of all blockchain transactions
-
✔️ You reduce decision-making time significantly
-
✔️ You identify risks before they impact your operations
-
✔️ You improve financial transparency and accuracy
-
✔️ You enhance strategic planning with real-time insights
In short, this dashboard turns complex blockchain data into simple and actionable visuals.
🧩 Key Features of Blockchain Finance Dashboard in Power BI
Click to Purchases Blockchain Finance Dashboard in Power BI
This dashboard includes 5 powerful and interactive pages, each designed for specific analysis.
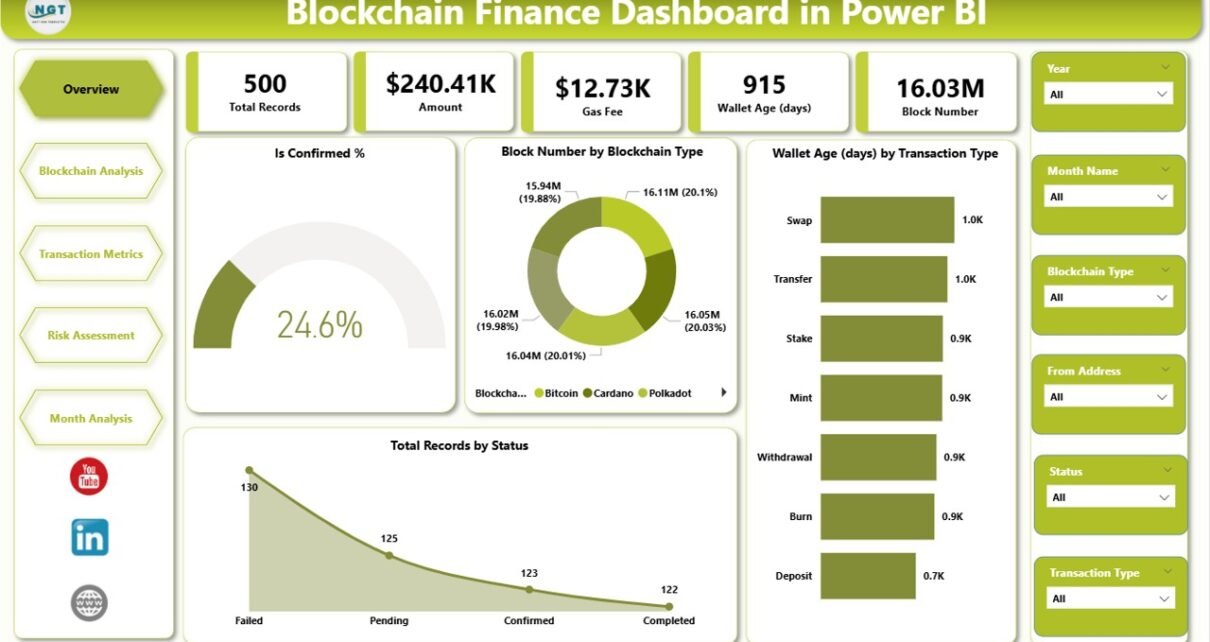
🏠 1. Overview Page – Get a Complete Snapshot
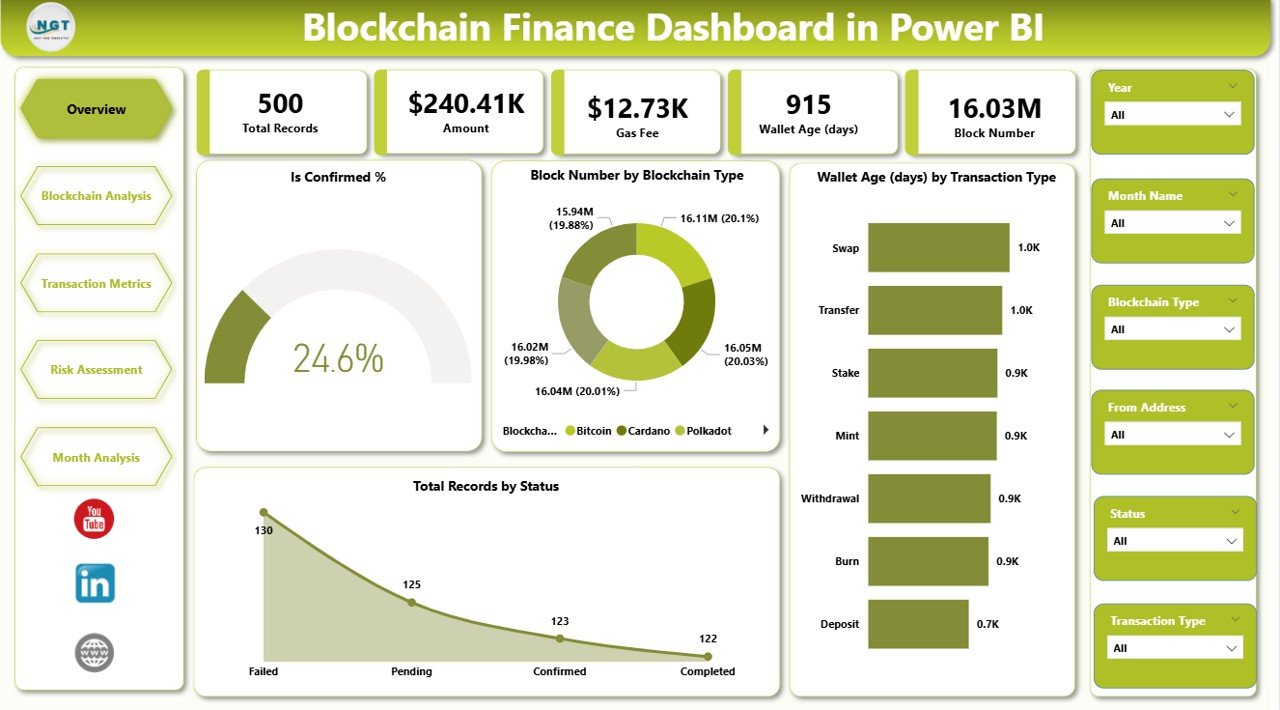
The Overview Page acts as the main control center of the dashboard. Here, you can quickly understand the overall performance.
🔑 Key Highlights:
-
🎯 5 KPI Cards:
-
Is Confirmed %
-
Block Number by Blockchain Type
-
Wallet Age by Transaction Type
-
Total Records by Status
-
-
🎛️ Interactive Slicers (Filters):
-
Easily filter data by blockchain type, transaction type, or status
-
💡 Why This Page Matters:
Because it provides a quick snapshot, you can instantly identify trends, anomalies, and performance gaps.
🔗 2. Blockchain Analysis – Compare Blockchain Performance
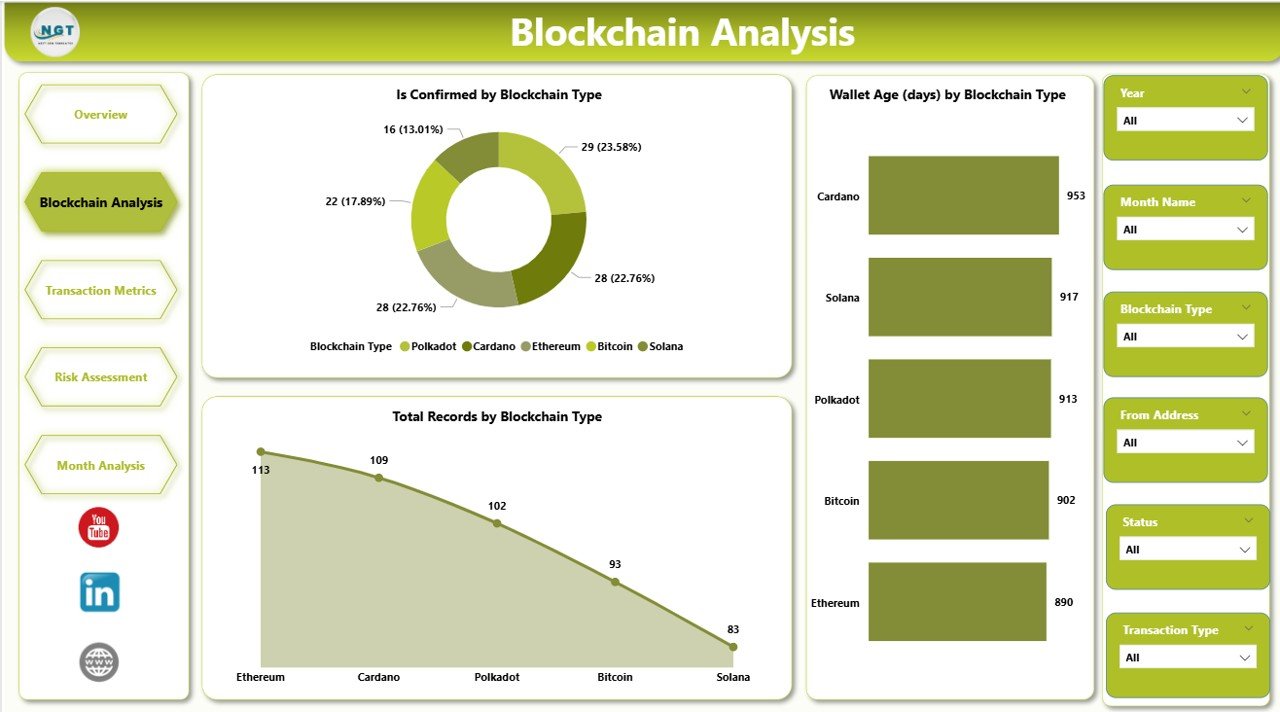
The Blockchain Analysis Page helps you evaluate performance across different blockchain networks.
📊 Charts Included:
-
📈 Is Confirmed by Blockchain Type
-
👛 Wallet Age by Blockchain Type
-
📊 Total Records by Blockchain Type
💡 Insights You Can Gain:
-
Which blockchain processes transactions faster
-
Which network has higher activity
-
How wallet behavior varies across blockchains
💸 3. Transaction Metrics – Analyze Financial Transactions
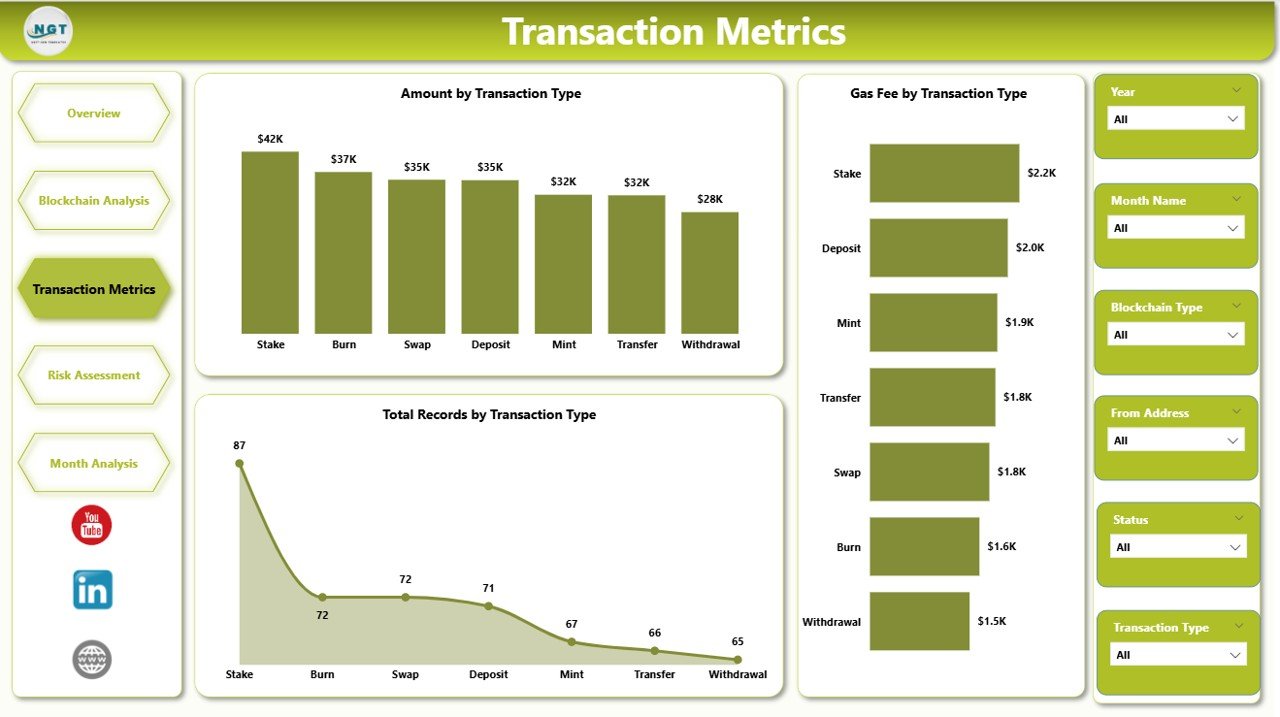
The Transaction Metrics Page focuses on financial data related to blockchain transactions.
📊 Charts Included:
-
💰 Amount by Transaction Type
-
⛽ Gas Fee by Transaction Type
-
📊 Total Records by Transaction Type
💡 Why It’s Important:
Because it helps you:
-
Understand transaction costs
-
Identify high-value transactions
-
Optimize gas fees and reduce expenses
⚠️ 4. Risk Assessment – Detect High-Risk Transactions
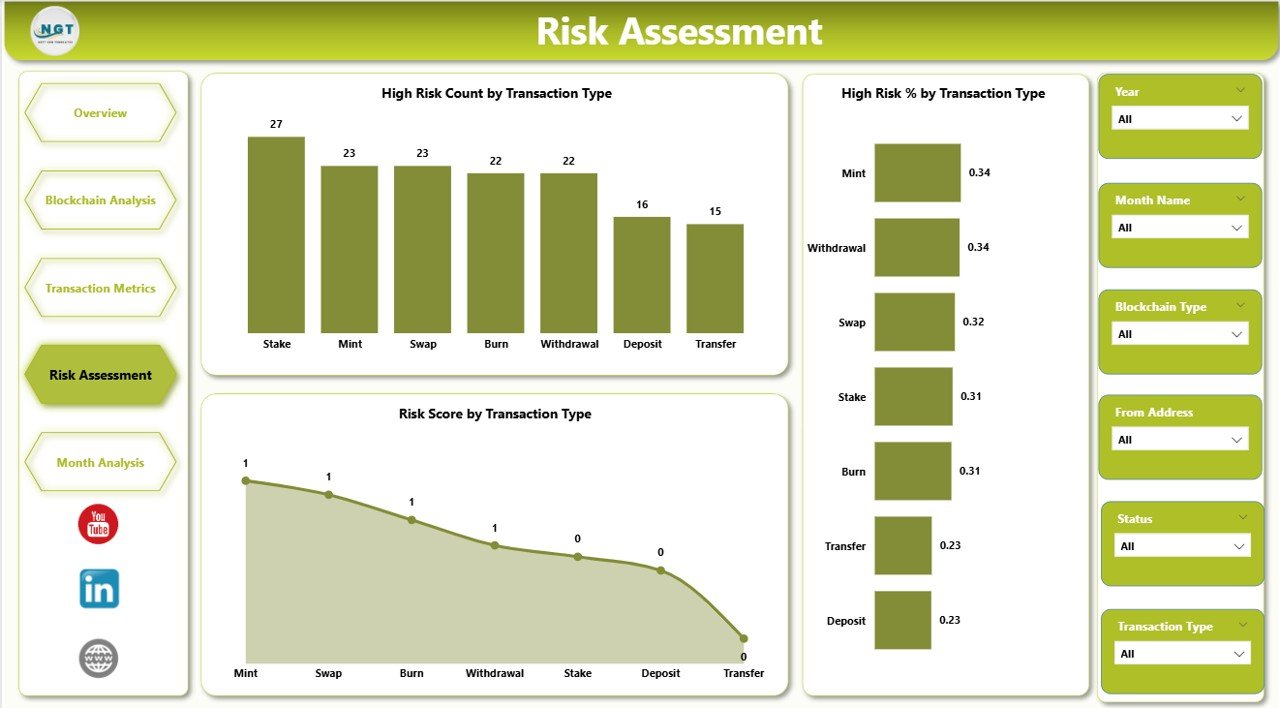
The Risk Assessment Page plays a crucial role in financial security and compliance.
📊 Charts Included:
-
🚨 High Risk Count by Transaction Type
-
⚠️ High Risk % by Transaction Type
-
📊 Risk Score by Transaction Type
💡 Key Benefits:
-
Detect suspicious activities quickly
-
Reduce fraud and financial risks
-
Improve compliance with regulations
- Click to Purchases Blockchain Finance Dashboard in Power BI
📅 5. Month Analysis – Track Trends Over Time
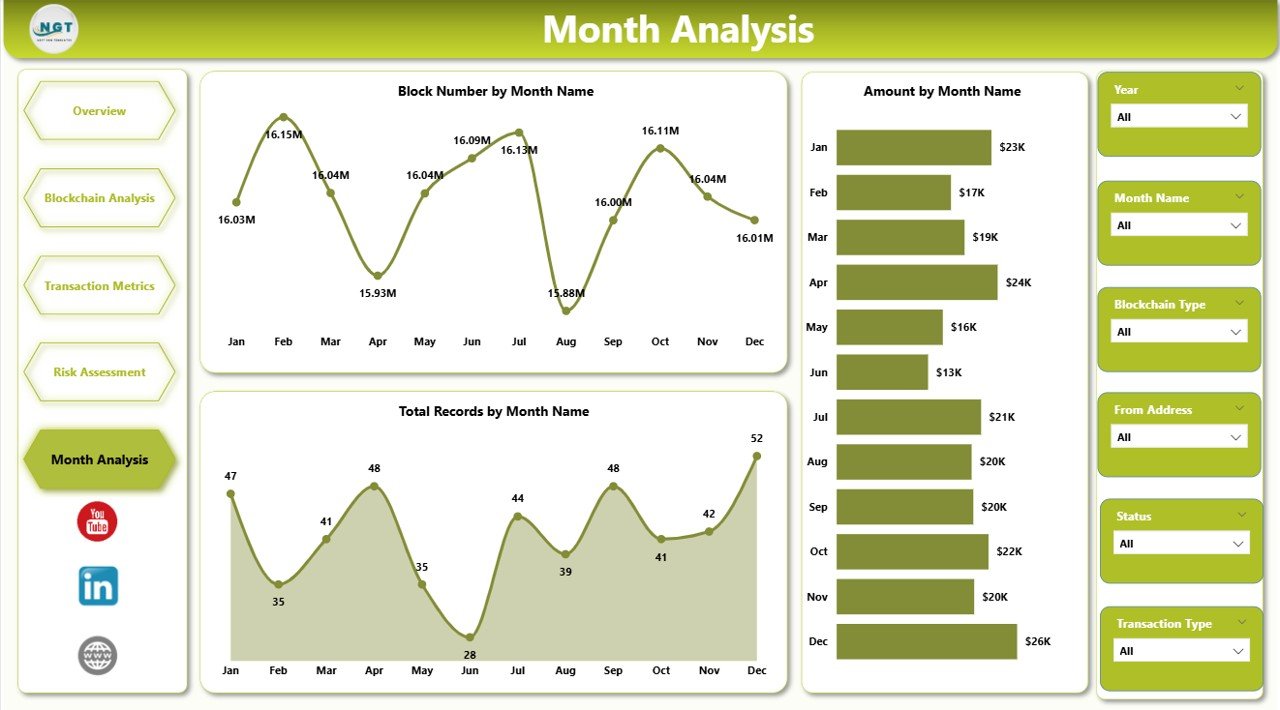
The Month Analysis Page helps you monitor performance trends across different months.
📊 Charts Included:
-
📈 Block Number by Month
-
💰 Amount by Month
-
📊 Total Records by Month
💡 Why This Matters:
Because it allows you to:
-
Identify growth patterns
-
Analyze seasonal trends
-
Make future predictions based on data
🌟 Advantages of Blockchain Finance Dashboard in Power BI
Using this dashboard offers multiple benefits. Let’s explore them:
✅ 1. Real-Time Data Insights
You can monitor blockchain transactions instantly. Therefore, you always stay updated.
✅ 2. Improved Decision-Making
Since you get clear visuals, you can make faster and better decisions.
✅ 3. Risk Management
You can identify high-risk transactions early. As a result, you reduce financial losses.
✅ 4. Better Financial Control
You can track amounts, gas fees, and transaction types easily.
✅ 5. Enhanced Data Visualization
Power BI provides interactive charts. Therefore, data becomes easy to understand.
✅ 6. Time-Saving Automation
Instead of manual reporting, this dashboard automates analysis.
🔧 Opportunities for Improvement
Although this dashboard is powerful, you can enhance it further:
-
🔄 Integrate real-time blockchain APIs for live data
-
📊 Add predictive analytics using AI models
-
🔐 Include advanced fraud detection mechanisms
-
📱 Optimize dashboard for mobile devices
-
🌍 Add geo-based transaction analysis
🏆 Best Practices for the Blockchain Finance Dashboard in Power BI
To get the best results, follow these best practices:
📌 1. Keep Data Clean and Structured
Always ensure your data remains accurate and consistent.
📌 2. Use Meaningful KPIs
Select KPIs that align with your business goals.
📌 3. Optimize Visual Design
Use clear charts and avoid clutter.
📌 4. Apply Filters Effectively
Use slicers to make the dashboard interactive and user-friendly.
📌 5. Monitor Risk Regularly
Check risk metrics frequently to avoid fraud.
📌 6. Update Data Frequently
Always refresh your dashboard to get the latest insights.
👥 Who Can Benefit from This Dashboard?
This dashboard suits a wide range of users:
-
💼 Financial Analysts
-
💻 Blockchain Developers
-
🪙 Crypto Traders & Investors
-
🏦 FinTech Companies
-
🔐 Compliance & Risk Teams
🚀 How Does This Dashboard Improve Business Performance?
Click to Purchases Blockchain Finance Dashboard in Power BI
This dashboard directly impacts your business in several ways:
-
✔️ It improves operational efficiency
-
✔️ It enhances financial transparency
-
✔️ It reduces risks and fraud
-
✔️ It supports strategic decision-making
Therefore, businesses can scale faster and more efficiently.
🔮 Future Scope of Blockchain Finance Dashboards
Blockchain technology continues to evolve. Therefore, dashboards will become more advanced.
In the future, you can expect:
-
🤖 AI-powered analytics
-
🔗 Integration with multiple blockchain networks
-
📊 Real-time predictive insights
-
🔐 Enhanced cybersecurity monitoring
🧾 Conclusion
The Blockchain Finance Dashboard in Power BI is a game-changing tool for managing and analyzing blockchain financial data. It simplifies complex datasets, improves decision-making, and enhances risk management.
Moreover, with its interactive pages, real-time insights, and powerful visuals, it helps businesses stay ahead in the competitive financial world.
If you want to unlock the full potential of blockchain data, this dashboard is the perfect solution.
❓ Frequently Asked Questions (FAQs)
❓ What is a Blockchain Finance Dashboard?
A Blockchain Finance Dashboard is a tool that helps you track, analyze, and visualize blockchain financial data in one place.
❓ Can beginners use this dashboard?
Yes, beginners can easily use it because it includes simple visuals and interactive filters.
❓ Does this dashboard support real-time data?
Yes, you can connect it to real-time data sources for live updates.
❓ What tools are required to use this dashboard?
You need Microsoft Power BI Desktop to use and customize this dashboard.
❓ How does it help in risk management?
It identifies high-risk transactions and provides risk scores for better decision-making.
❓ Can I customize this dashboard?
Yes, you can modify KPIs, charts, and filters based on your needs.
Visit our YouTube channel to learn step-by-step video tutorials
Click to Purchases Blockchain Finance Dashboard in Power BI