Boutique Hotels Dashboard in Excel is a professionally designed, ready-to-use Excel template that empowers boutique hotel owners, hospitality managers, and revenue analysts to visualize and analyze their hotel booking data with stunning interactive charts, dynamic slicers, and pivot-powered analysis pages. Whether you manage a single boutique property or a portfolio of unique hotels across multiple cities, this dashboard delivers instant insights into revenue, profitability, guest satisfaction, and seasonal trends — all without writing a single formula.
In the competitive world of boutique hospitality, data-driven decisions separate thriving properties from struggling ones. This Excel dashboard template brings enterprise-level analytics to your fingertips, helping you identify your most profitable rooms, understand guest booking patterns, and optimize your pricing strategy across seasons. Let’s explore everything this powerful template has to offer.
Key Features of Boutique Hotels Dashboard in Excel
This dashboard template is loaded with features that make hotel performance tracking effortless and visually engaging. Here are the standout capabilities that set it apart:
- 5 Interactive Dashboard Pages – The template includes dedicated pages for Overview, Room Analysis, Guest Insights, Revenue Trends, and Property Performance, giving you a comprehensive 360-degree view of your hotel operations.
- High-Level KPI Cards – The Overview page features summary cards displaying Total Records, Total Operating Cost, Total Revenue, Net Profit, and Avg. Guest Rating for quick at-a-glance performance monitoring.
- Dynamic Slicers and Filters – Multiple slicers on each page let you instantly filter the dashboard by guest type, room type, season, booking source, city, and other dimensions with a single click.
- Pivot-Powered Visualizations – Every chart in the dashboard is driven by pivot tables in the Support Sheet, ensuring the entire dashboard refreshes automatically when you update your data.
- Revenue and Profit Tracking – Comprehensive analysis of total revenue, operating costs, net profit, and profit margins broken down by room type, guest type, season, city, and booking source.
- Guest Satisfaction Analytics – Track average guest ratings by room type to identify your best-performing accommodations and areas needing improvement.
- Seasonal and Monthly Trend Analysis – Visualize revenue patterns across months, years, and seasons to optimize your dynamic pricing strategy and maximize occupancy during peak periods.
- One-Click Data Refresh – Simply update the Data Sheet with your latest booking records, navigate to the Data tab in the Excel Ribbon, click Refresh All, and every pivot table and chart updates automatically.
Dashboard Pages Explained
1. Overview Page
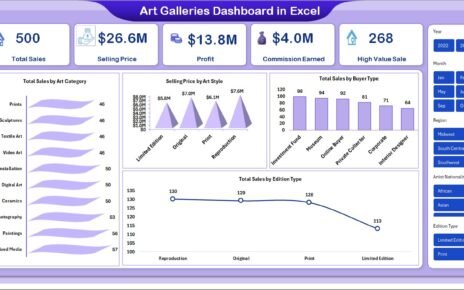
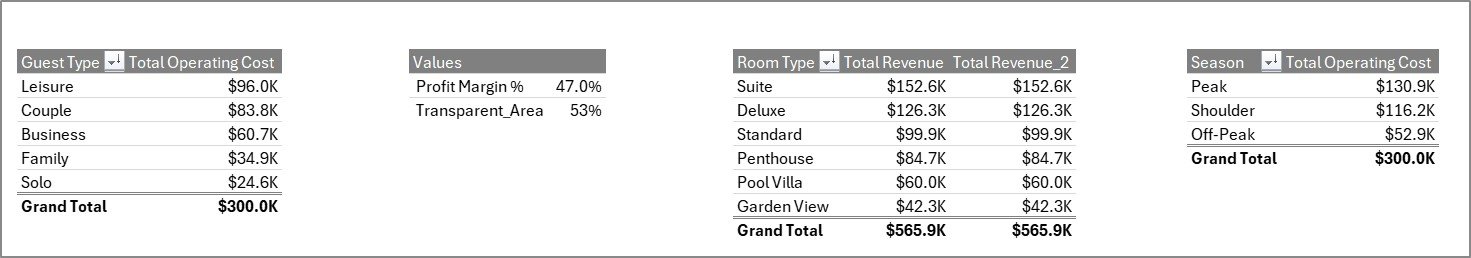
The Overview page serves as your hotel’s command center. At the top, you’ll find high-level KPI cards that display the most critical metrics at a glance: Total Records, Total Operating Cost, Total Revenue, Net Profit, and Avg. Guest Rating. These cards give you an immediate pulse check on your hotel’s overall health.
Below the cards, the page features several analytical charts that break down your data across key dimensions. The Total Operating Cost by Guest Type chart reveals how much you spend serving different guest segments. The Profit Margin % chart shows your overall profitability ratio, while the Total Revenue by Room Type chart highlights which room categories generate the most income. The Total Operating Cost by Season chart helps you understand how your expenses fluctuate with seasonal demand. Multiple slicers are available to apply filters and see the filtered dashboard instantly.
Boutique Hotels Dashboard in Excel
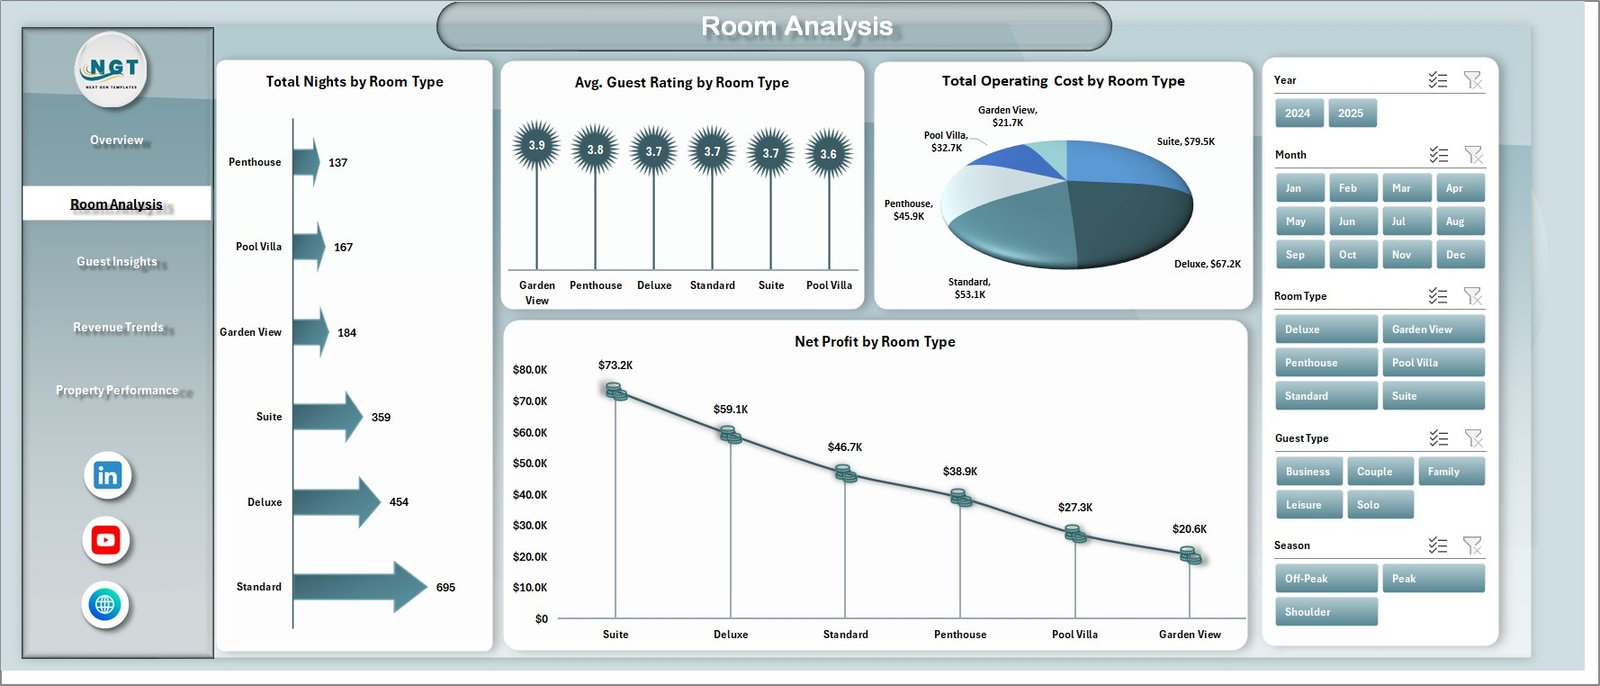
2. Room Analysis
The Room Analysis page provides a deep dive into your accommodation performance. This sheet contains four focused visualizations: Total Nights by Room Type shows you which room categories are most popular among guests. Avg. Guest Rating by Room Type reveals how guests rate their experience in different room categories, helping you identify which rooms consistently delight guests and which may need upgrades. Total Operating Cost by Room Type breaks down your expenses per room category, and Net Profit by Room Type shows you exactly which rooms are your biggest money-makers after accounting for all costs. This page is essential for making informed decisions about room pricing, renovations, and inventory allocation.
Room Analysis
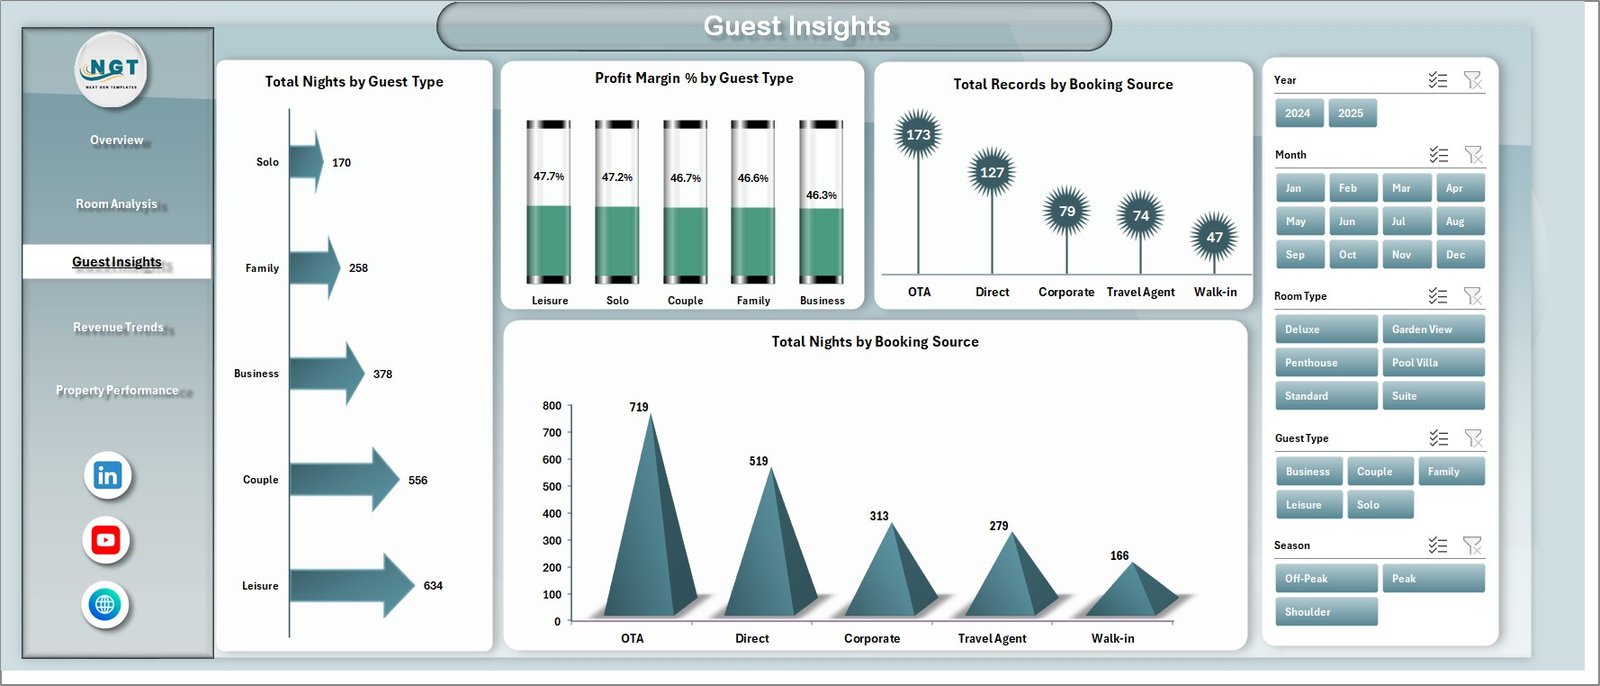
3. Guest Insights
Understanding your guests is the key to delivering exceptional hospitality experiences, and the Guest Insights page makes this effortless. This sheet features Total Nights by Guest Type, which shows how different guest segments contribute to your occupancy. The Profit Margin % by Guest Type chart reveals which guest categories are most profitable for your business. Total Records by Booking Source and Total Nights by Booking Source help you understand where your bookings are coming from — whether it’s direct bookings, online travel agencies, corporate partnerships, or walk-ins. These insights are invaluable for optimizing your marketing spend and channel strategy. If you’re also exploring web-based hospitality analytics, check out the Hospitality Dashboard in HTML for a browser-based alternative.
Guest Insights
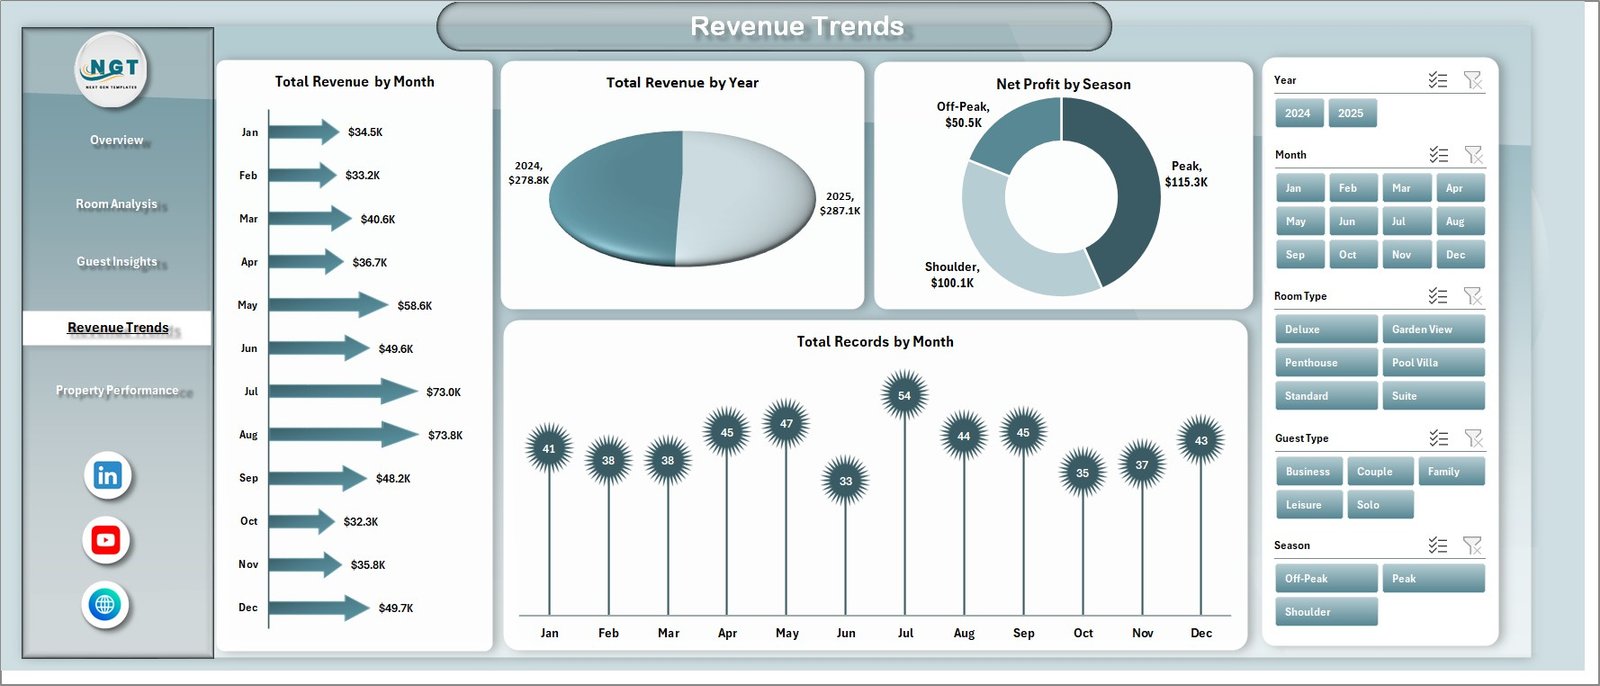
4. Revenue Trends
The Revenue Trends page is your financial forecasting companion. It features Total Revenue by Month to track monthly performance fluctuations, Total Revenue by Year for year-over-year growth comparisons, Net Profit by Season to identify your most and least profitable seasons, and Total Records by Month to understand booking volume patterns throughout the year. These trend visualizations are essential for revenue managers who need to implement dynamic pricing strategies, plan marketing campaigns around peak seasons, and forecast future performance with confidence. For similar tourism-related analytics, you might also enjoy the Adventure Tourism KPI Dashboard in Excel.
Revenue Trends
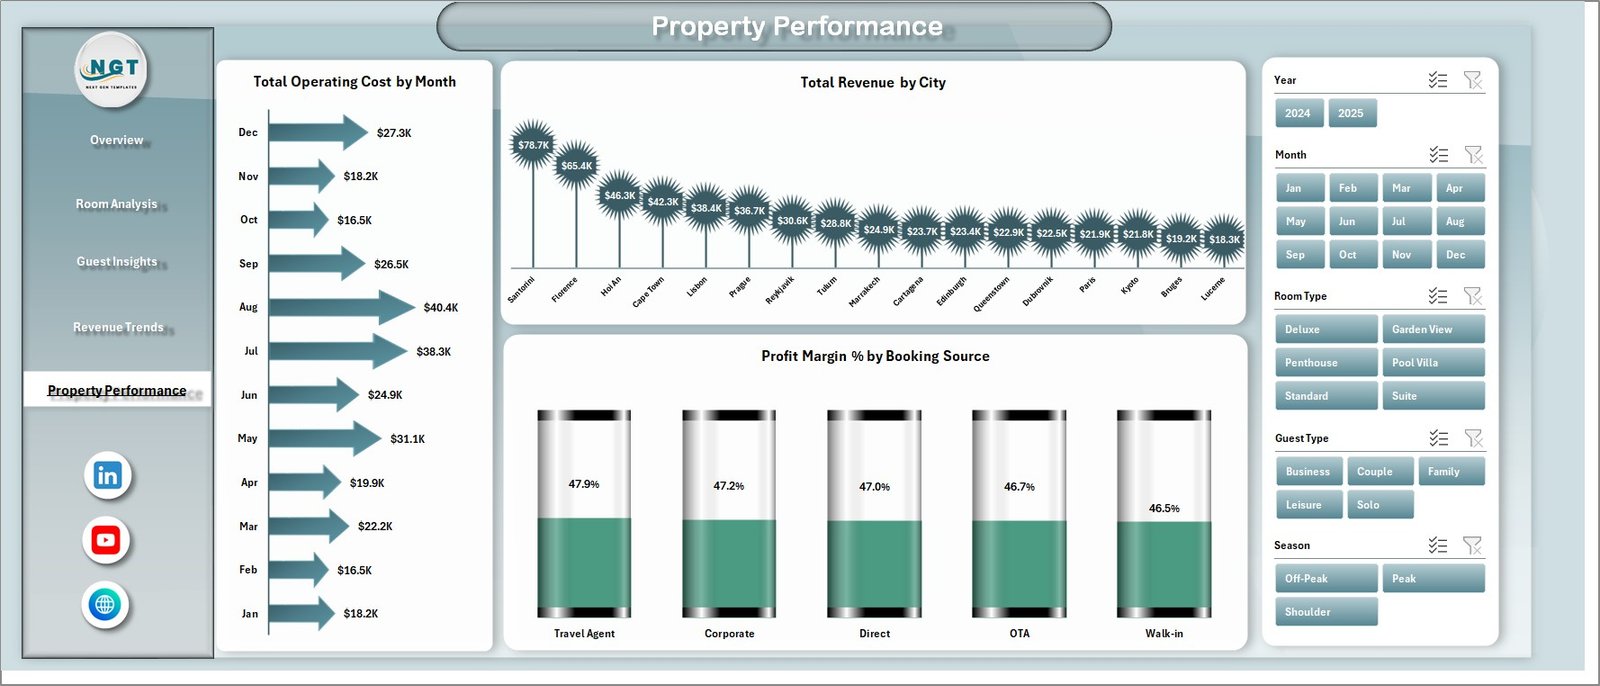
5. Property Performance
For hoteliers managing properties across multiple locations, the Property Performance page is a game-changer. This sheet includes Total Operating Cost by Month for tracking expense trends over time, Total Revenue by City for comparing how different property locations perform against each other, and Profit Margin % by Booking Source for understanding which booking channels deliver the best returns. This page helps multi-property operators make data-backed decisions about where to invest, which locations need attention, and which booking partnerships are most valuable. For a Power BI alternative for chain operations, explore the Hotel Chains KPI Dashboard in Power BI.
Property Performance
6. Data Sheet
The Data Sheet is where all the magic begins. This is the input sheet where you enter or paste your hotel booking records in the predefined column format. Each row represents a single booking with all relevant fields such as guest type, room type, booking source, city, season, revenue, operating cost, guest rating, and more. Simply add your data in the same format, and the rest of the dashboard will pull everything automatically through the pivot tables.
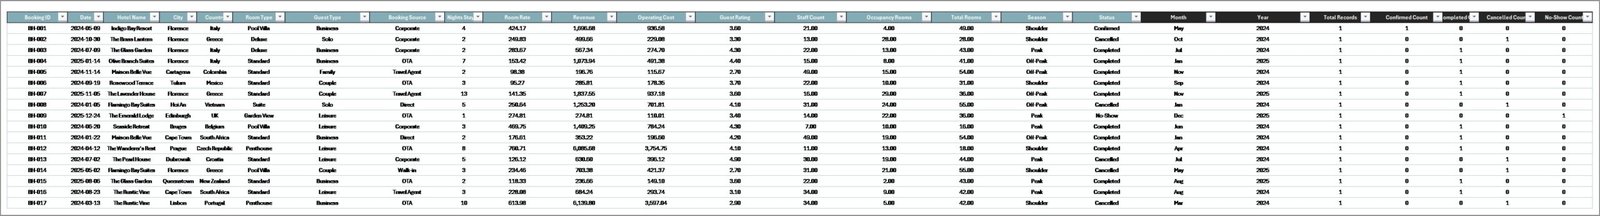
Data Sheet tab
7. Support Sheet
The Support Sheet is the engine room of the entire dashboard. It contains multiple pivot tables that power every single chart across all five dashboard pages. When you update the data in the Data Sheet and click Refresh All from the Data tab in the Excel Ribbon, all pivot tables in this sheet get refreshed first, which then cascades the updates to every chart on every page. You can keep this sheet hidden for a cleaner user experience while it works silently in the background. This design ensures the dashboard remains fully dynamic and maintenance-free. Similar pivot-based architecture is used in the Backpacker Hostels Dashboard in Excel.
Support Sheet tab
Advantages of Boutique Hotels Dashboard in Excel
- No Technical Skills Required – The dashboard is fully pre-built with all formulas, pivots, and charts ready to go. You just need to paste your data and refresh.
- Instant Visual Insights – Transform raw booking data into beautiful, actionable visualizations in seconds without any manual chart creation.
- Cost-Effective Analytics – Get professional-grade hotel analytics without expensive BI software subscriptions or custom development costs.
- Works Offline – Being an Excel file, this dashboard works completely offline on any computer with Microsoft Excel installed. No internet connection or cloud service needed.
- Fully Customizable – You can modify colors, add new charts, adjust pivot table fields, or extend the data structure to fit your specific hotel’s needs.
- Multi-Dimensional Analysis – Analyze your data across room types, guest types, booking sources, seasons, cities, months, and years all in one place.
- Dynamic and Auto-Refreshing – The pivot-powered architecture ensures that every chart updates automatically with a single click of Refresh All.
Opportunities for Improvement
- Occupancy Rate Metric – Adding an occupancy rate calculation would provide an even more complete picture of hotel utilization alongside revenue and profit metrics.
- ADR and RevPAR Tracking – Including Average Daily Rate and Revenue Per Available Room would align the dashboard with industry-standard hospitality KPIs used by most hotel management professionals.
- Year-Over-Year Comparison View – A dedicated YoY comparison page or conditional formatting showing growth percentages would help managers quickly spot improvement or decline trends.
- Guest Feedback Integration – Expanding beyond numeric ratings to include guest review sentiment or comment categories could provide richer insights into guest satisfaction drivers.
- Automated Data Connection – For larger operations, integrating with Power Query to pull data directly from PMS systems would eliminate manual data entry entirely.
Best Practices for Using This Dashboard
- Keep Data Consistent – Always enter data in the exact same column format as the predefined structure in the Data Sheet. Inconsistent column names or missing fields will cause pivot table errors.
- Refresh Regularly – Make it a habit to update your booking data weekly or monthly and click Refresh All immediately after to keep the dashboard current.
- Use Slicers Strategically – Combine multiple slicers to drill down into specific segments, such as filtering by a particular season and room type simultaneously to uncover hidden patterns.
- Archive Historical Data – Keep a backup of your data periodically so you can always reference historical performance and create custom year-over-year comparisons.
- Share with Your Team – Export specific pages as PDFs or screenshots for team meetings and stakeholder presentations to communicate insights effectively.
- Hide the Support Sheet – Right-click the Support Sheet tab and select Hide to keep the workbook clean and focused on the analytical pages.
Explore Relevant Templates
If you found this Boutique Hotels Dashboard in Excel useful, you might also love these related templates from our collection:
- Hospitality Dashboard in HTML – A stunning browser-based dashboard for hospitality analytics.
- Backpacker Hostels Dashboard in Excel – Tailored analytics for hostel and backpacker accommodation management.
- Hotel Chains KPI Dashboard in Power BI – KPI tracking designed for hotel chain operations in Power BI.
- Sustainable Tourism KPI Scorecard In Excel – Track sustainability metrics for eco-friendly tourism businesses.
- Backpacker Hostels Dashboard in Power BI – Power BI version of hostel performance analytics.
Click here to Purchase Boutique Hotels Dashboard in Excel
Frequently Asked Questions
What version of Excel do I need to use this dashboard?
This dashboard works best with Microsoft Excel 2016 or later, including Excel for Microsoft 365. Earlier versions may not fully support all slicer and pivot table features used in the template.
Can I add more data fields or columns to the Data Sheet?
Yes, you can extend the Data Sheet with additional columns. However, you would also need to update the corresponding pivot tables in the Support Sheet to include the new fields in the analysis.
How many booking records can this dashboard handle?
Excel can handle over a million rows, so the dashboard can comfortably work with tens of thousands of booking records. For extremely large datasets exceeding 100,000 rows, you may notice slower refresh times depending on your computer’s processing power.
Does this template work on Mac?
Yes, the template is compatible with Excel for Mac. However, some slicer formatting may appear slightly different on Mac compared to Windows. All functionality including pivot tables and charts will work as expected.
Can I use this dashboard for multiple hotel properties?
Absolutely! The Data Sheet can include records from multiple properties with a city or location column. The Property Performance page and slicers allow you to filter and compare across different locations seamlessly.
How do I refresh the dashboard after updating data?
After entering or pasting new data in the Data Sheet, go to the Data tab in the Excel Ribbon and click Refresh All. This will refresh all pivot tables and charts across all pages automatically.
Conclusion
The Boutique Hotels Dashboard in Excel is a must-have analytics tool for anyone in the boutique hospitality industry. With 5 interactive pages covering overview metrics, room performance, guest behavior, revenue trends, and property comparisons, this template gives you everything you need to make data-driven decisions that boost profitability and guest satisfaction. The pivot-powered architecture ensures your dashboard stays dynamic and up-to-date with minimal effort. Get your copy today and start transforming your hotel data into actionable insights!
For more Excel dashboard tutorials and templates, visit our YouTube channel at Youtube.com/@PK-AnExcelExpert where we share step-by-step video guides on building professional dashboards and mastering Excel analytics.