Budget vs actual Excel tracking is the process of comparing planned numbers with real results, then calculating variance amount, variance percentage, budget utilization, and status. That matters because financial drift is rarely obvious at first. The U.S. Bureau of Labor Statistics reported that only 34.7 percent of U.S. private-sector business establishments born in March 2013 were still operating in March 2023, which is a useful reminder that small budget signals deserve attention before they become survival problems.
The basic Excel setup is simple: put Budget in one column, Actual in the next column, and use formulas to show whether the result is over budget, under budget, or on target. The important part is choosing one calculation convention and labeling it clearly. For expenses, many finance teams use Actual - Budget, where a positive value means overspending. For personal budgeting, many users prefer Budget - Actual, where a positive value means money is still available.
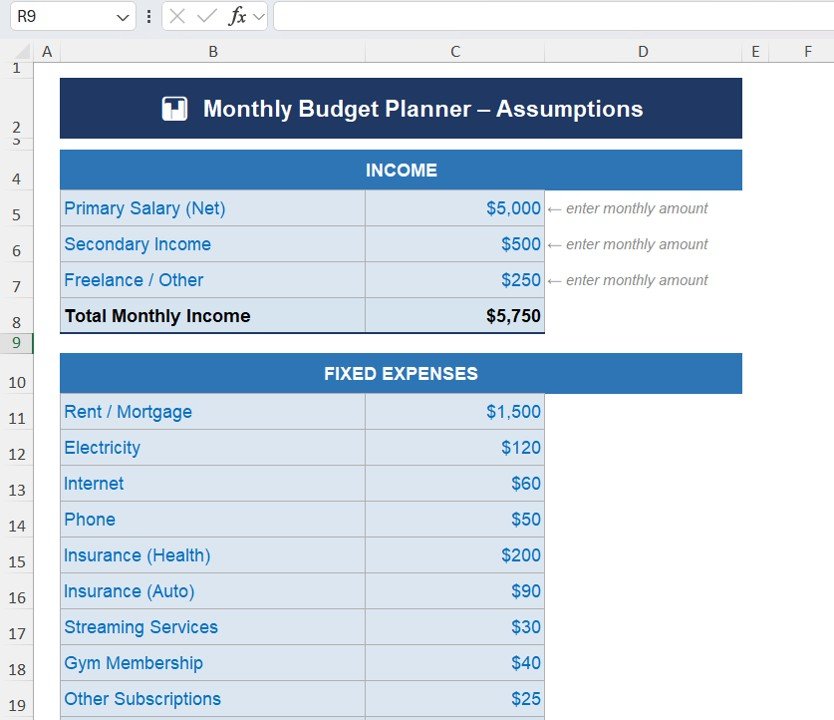
Download the Monthly Budget Planner Template in Excel
Key Features of a Budget vs Actual Excel Tracker
A good budget tracker should do more than show two numbers side by side. It should explain the difference in a way that helps you act. The core fields are usually Budget, Actual, Variance Amount, Variance %, Status, Budget Utilization %, and Remaining Budget.
For a clean worksheet, use a structured table with these columns:
| Column | Purpose | Example Formula |
|---|---|---|
| Budget | Planned amount for the month, category, vendor, or department | Manual input |
| Actual | Real spending, revenue, or cost recorded for the same period | Manual input or imported value |
| Variance Amount | Dollar difference between actual and budget | =D2-C2 |
| Variance % | Variance divided by budget | =IF(C2=0,"",(D2-C2)/C2) |
| Status | Text label for quick scanning | =IF(D2>C2,"Over Budget",IF(D2<C2,"Under Budget","On Budget")) |
| Utilization % | Actual amount as a percentage of budget | =IF(C2=0,"",D2/C2) |
Microsoft’s official documentation is useful when building these calculations: IF handles status labels, SUMIFS handles month, category, department, or vendor totals, and ABS converts a variance into its unsigned size.
Variance Formula Sections Explained
1. Amount Variance Formula
For expense tracking, use:
=Actual-Budget
If Budget is in C2 and Actual is in D2, the Excel formula is:
=D2-C2
A positive result means actual spending is higher than the approved budget. A negative result means spending is below budget. This is the most common formula for office expense reports, department budget dashboards, vendor spend reports, and finance team variance analysis.
2. Remaining Budget Formula
For personal finance or household budget tracking, the more intuitive formula is:
=Budget-Actual
In Excel:
=C2-D2
A positive result means money is still available. A negative result means the category has gone over plan. This is why a personal monthly budget planner may display the opposite sign from a corporate budget report. Neither approach is wrong; the label must make the meaning obvious.
3. Variance Percentage Formula
Variance percentage shows the size of the difference relative to the original budget:
=(Actual-Budget)/Budget
In Excel:
=IF(C2=0,"",(D2-C2)/C2)
The IF wrapper prevents a divide-by-zero error when the budget cell is blank or zero. Format the result as Percentage. If Actual is 12,000 and Budget is 10,000, the variance percentage is 20 percent over budget.
4. Absolute Variance Formula
Sometimes you only care about the size of the gap, not whether it is positive or negative:
=ABS(D2-C2)
This is helpful in dashboard cards such as Top 5 Largest Variances. It lets you sort by biggest movement regardless of direction, then use a separate status field to say whether the variance is favorable or unfavorable.
5. Favorable vs Unfavorable Variance Formula
For expense lines, lower actual spending is usually favorable:
=IF(D2>C2,"Unfavorable",IF(D2<C2,"Favorable","On Budget"))
For revenue lines, higher actual revenue is usually favorable:
=IF(D2>=C2,"Favorable","Unfavorable")
This distinction is critical. The same variance sign can mean different things depending on whether the line is an expense, revenue, headcount, output, error rate, or inventory metric.
6. YTD Budget vs Actual with SUMIFS
For dashboards, you usually need totals by month, department, category, or vendor. A structured table makes this much easier. If your table is named tblBudget, a YTD budget formula can look like this:
=SUMIFS(tblBudget[Budget],tblBudget[Department],$A2,tblBudget[Month],"<="&$B$1)
A matching YTD actual formula uses the Actual column instead of the Budget column. Then YTD variance is simply YTD Actual minus YTD Budget. This is the backbone of most budget vs actual dashboards in Excel.
Budget vs Actual Excel vs Google Sheets vs Paid Finance Software – Feature Comparison
| Feature | Budget vs Actual Excel Tracker | Google Sheets Budget Tracker | Paid Finance / FP&A Software |
|---|---|---|---|
| Cost | Low one-time template cost | Low if you already use Google Workspace | Monthly or annual subscription |
| Platform | Microsoft Excel desktop or Microsoft 365 | Browser-based spreadsheet | Cloud application |
| Setup time | Fast with a ready-made template | Fast for simple sheets, slower for dashboards | Longer setup, configuration, and onboarding |
| Formula transparency | High; every formula can be inspected | High; formulas are visible | Lower; logic may be hidden in configuration |
| Real-time team collaboration | Available through OneDrive or SharePoint | Native real-time collaboration | Role-based collaboration |
| Mobile access | Available, but best reviewed on desktop | Good browser/mobile support | Usually strong mobile/browser access |
| Customizable fields | Very flexible | Very flexible | Depends on plan and admin permissions |
| Share with link | Possible through Microsoft 365 | Native sharing | Usually built in |
| Year-1 cost at 5 users | Often one template purchase plus Excel access | Often included in workspace subscription | Can become expensive as seats increase |
| Best fit | Formula control, small teams, fast reporting | Collaborative lightweight tracking | Complex planning, approvals, integrations |
Who Should Use This Template
A budget vs actual Excel tracker is useful for finance managers, office administrators, department heads, project managers, event planners, wedding planners, freelancers, and household budget users. It is especially helpful when the goal is to understand variance quickly without paying for a larger financial planning system.
It is not the right tool if you need live bank feeds, formal purchase approvals, ERP integrations, or multi-entity consolidation with audit controls. In those cases, Excel can still be the analysis layer, but the transaction system should be more controlled.
Real-World Use Cases
An office manager can compare approved monthly budgets against actual vendor spend, then flag departments that have exceeded the plan before the end of the month.
A small business owner can use budget utilization percentage to see whether marketing, payroll, software, rent, and travel are tracking normally or require adjustment.
A wedding planner can track estimated vs actual cost by vendor, payment method, month, and wedding phase so the couple can see where the event budget is changing.
Advantages of Budget vs Actual Tracking in Excel
The main advantage is transparency. You can see every formula, adjust the logic, and tailor the workbook around the way your team talks about money. Excel also makes it easy to add charts, slicers, pivot tables, conditional formatting, and dashboard cards without building a custom application.
Another advantage is speed. A ready-made budget tracker lets you start with a working structure instead of spending hours building formulas, formatting tables, and testing edge cases. For many teams, that speed is worth more than the template cost.
Opportunities for Improvement
Budget workbooks can become unreliable when too many people edit formulas directly. Protect formula cells, keep input areas separate from calculation areas, and use structured tables so formulas copy down safely. If your file is used for management reporting, add a version history tab and a simple change log.
Another improvement is to separate expense and revenue logic. Expense variance, revenue variance, and KPI variance do not always use the same favorable/unfavorable rules. A clean setup table with a Line Type column can prevent confusing status labels.
Best Practices
- Use one sign convention and explain it in the header row.
- Use
IFto suppress divide-by-zero errors in variance percentage formulas. - Use
ABSonly when ranking variance size, not when judging favorable or unfavorable status. - Use
SUMIFSfor monthly, department, category, and vendor totals. - Format variance percentages consistently and use conditional formatting for quick scanning.
- Keep inputs, calculations, and dashboards on separate sheets when the workbook grows.
Explore Relevant Templates
If you want to build from scratch, the formulas above are enough. If you want a tested structure with charts, KPI cards, and budget views already built, these paid NextGenTemplates products are the best matches for this tutorial.
| Template | Best For | Why It Fits | Price |
|---|---|---|---|
| Monthly Budget Planner Template in Excel | Personal and household budgeting | Tracks income, actual spending, variance, and visual budget analysis | $6.99 sale price |
| Budget Forecasting Dashboard in Excel | Business budget forecasting | Compares budget, actual, forecast, variance %, and over-budget % by department and category | $17.99 sale price |
| Office Budget Utilization Report in Excel | Office and department budget control | Shows total budget, actual spend, utilization %, variance %, and remaining budget | $6.99 sale price |
| Wedding Budget Dashboard in Excel | Wedding and event cost tracking | Tracks estimated vs actual cost, vendor payments, deposits, categories, and wedding phases | $17.99 sale price |
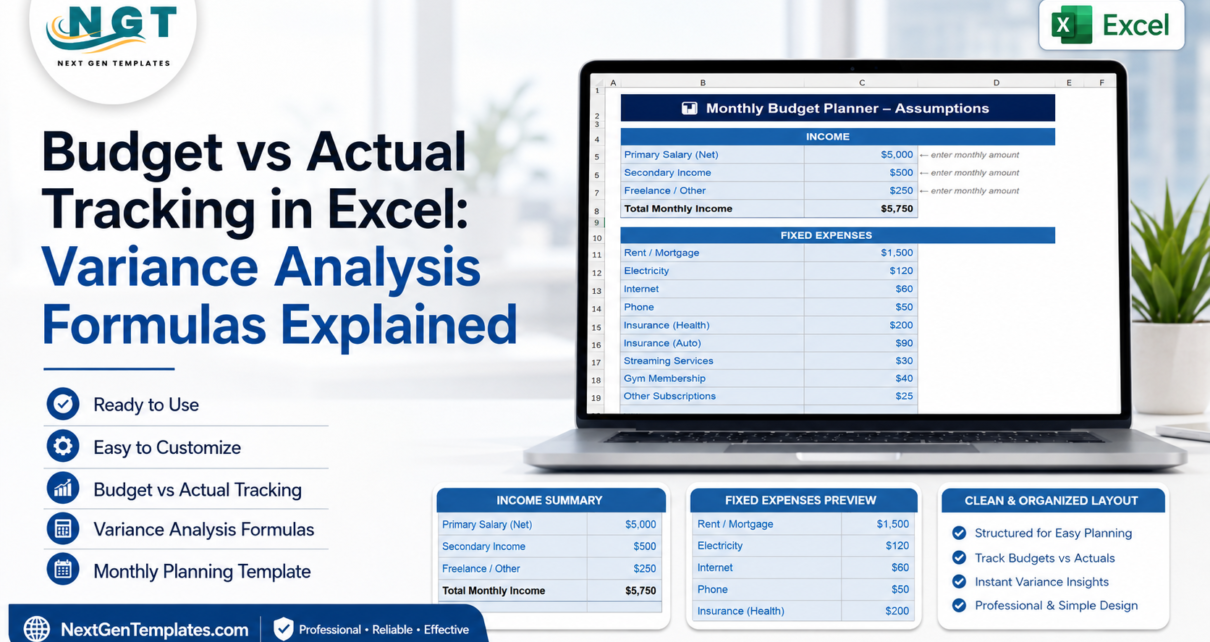
Monthly Budget Planner Template in Excel
This is the simplest starting point for individuals, families, students, and professionals who want a monthly budget tracker with income, planned expenses, actual expenses, variance, and a chart view.
Get the Monthly Budget Planner Template in Excel
Budget Forecasting Dashboard in Excel
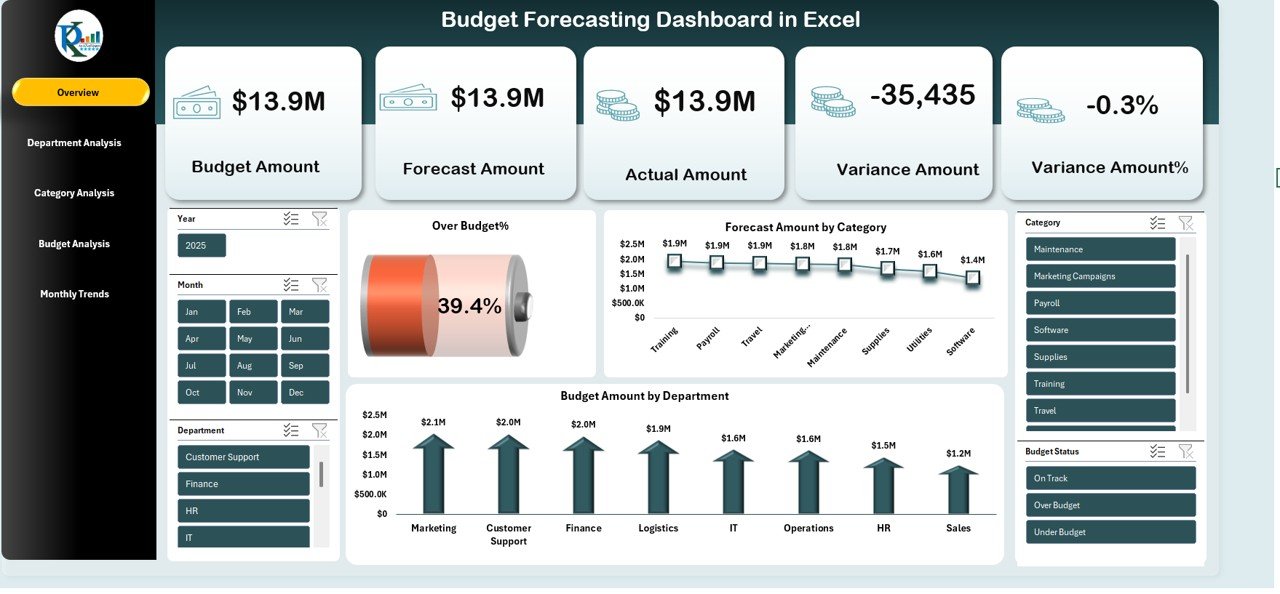
This dashboard is better for business users who need budget, actual, forecast amount, variance %, over-budget %, department analysis, category reporting, and monthly trends in one workbook.
Get the Budget Forecasting Dashboard in Excel
Office Budget Utilization Report in Excel
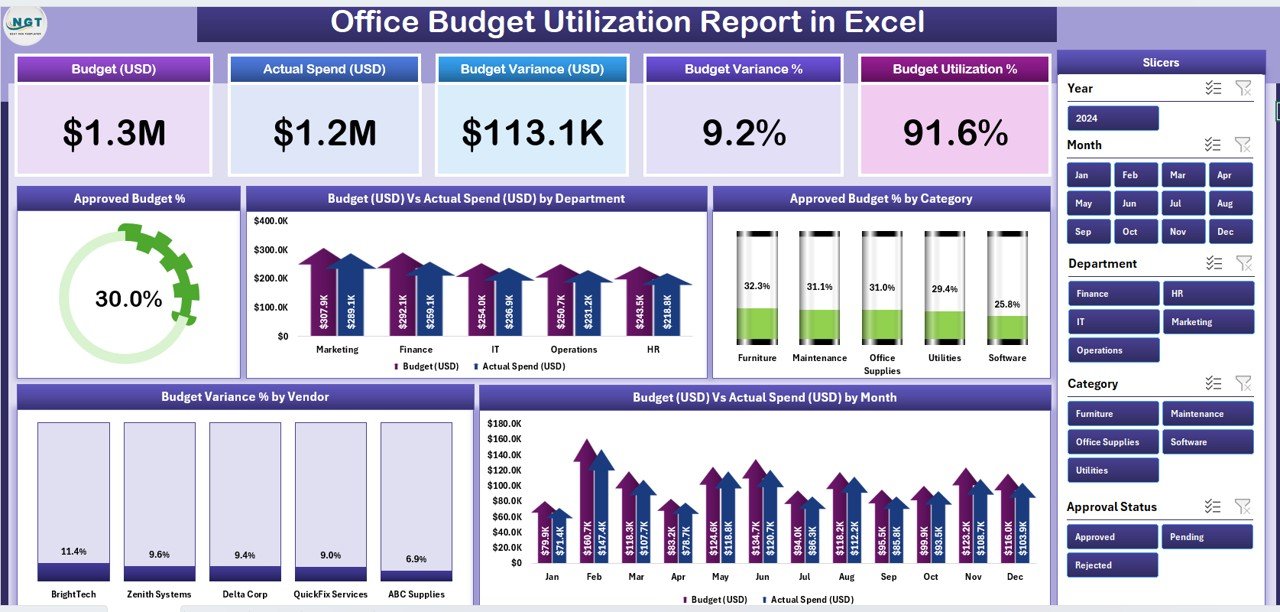
This report is a strong fit for finance managers, office administrators, operations teams, and leaders who want budget utilization, remaining budget, vendor analysis, and department-level variance reporting.
Get the Office Budget Utilization Report in Excel
Wedding Budget Dashboard in Excel
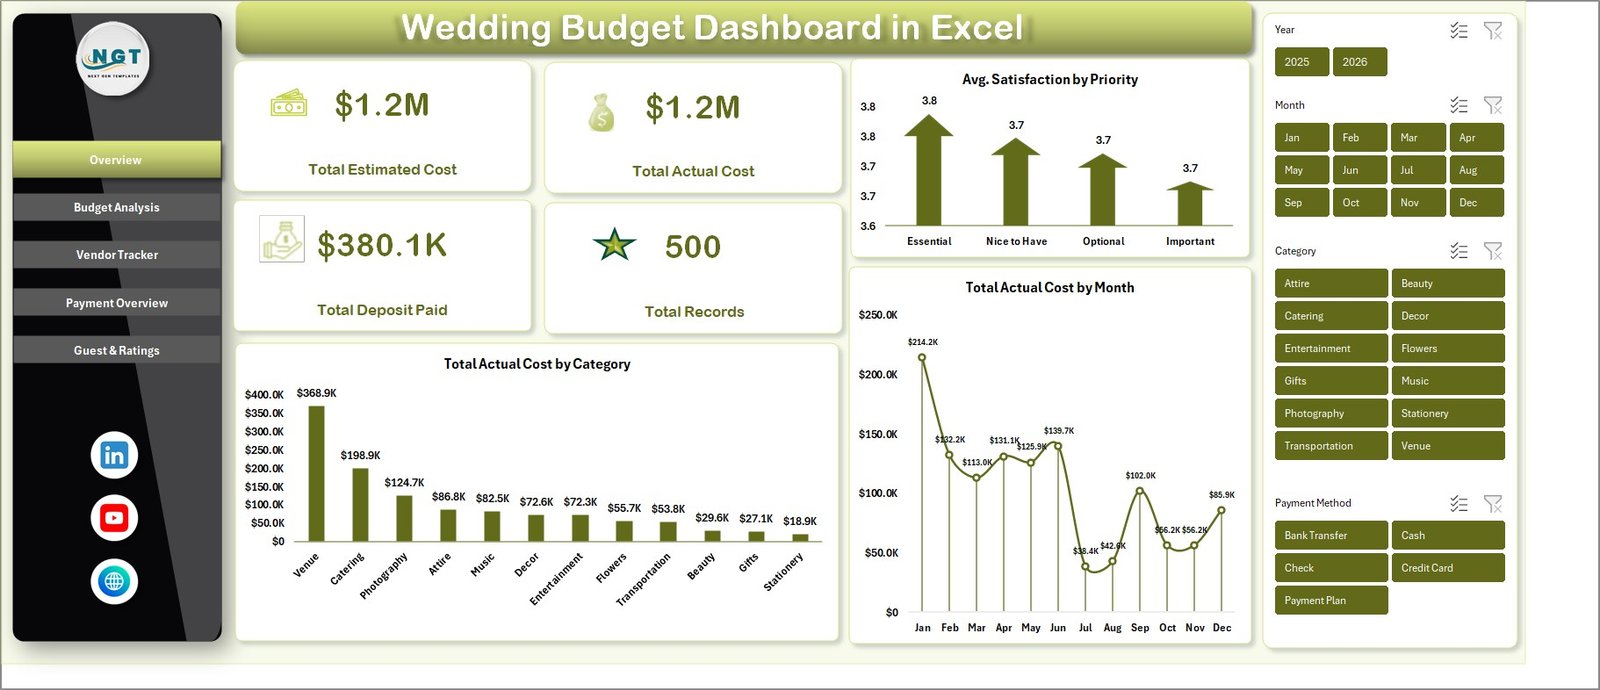
This template is useful when the budget is event-based. Couples, families, and wedding planners can compare estimated cost, actual cost, deposits, vendor payments, guest impact, and payment status across dashboard pages.
Get the Wedding Budget Dashboard in Excel
For more product walkthroughs, visit the NextGenTemplates YouTube channel. For Excel tutorials from PK, visit YouTube.com/@PKAnExcelExpert.
Frequently Asked Questions
What is the basic budget vs actual formula in Excel?
For expense reporting, the basic formula is =Actual-Budget. If Budget is in C2 and Actual is in D2, use =D2-C2. Positive means over budget, negative means under budget.
How do I calculate variance percentage in Excel?
Use =IF(Budget=0,"",(Actual-Budget)/Budget). With Budget in C2 and Actual in D2, use =IF(C2=0,"",(D2-C2)/C2), then format the result as Percentage.
Should variance be actual minus budget or budget minus actual?
For business expense reporting, actual minus budget is common because positive means overspending. For personal budgeting, budget minus actual is often easier because positive means remaining money. Use one convention and label it clearly.
How do I show favorable and unfavorable variance?
For expenses, use =IF(D2>C2,"Unfavorable",IF(D2<C2,"Favorable","On Budget")). For revenue, reverse the logic because higher actual revenue is normally favorable.
Which Excel functions are most useful for budget variance analysis?
The most useful functions are IF for status labels, SUMIFS for filtered totals, ABS for ranking variance size, and structured table references for formulas that copy reliably.
About the Author
Built by PK – Microsoft Certified Professional with 15+ years of Excel, Google Sheets, and Power BI experience. Founder of NextGenTemplates, reaching 300K+ subscribers across YouTube channels. Every template is hand-built and tested before release.
Conclusion
Budget vs actual tracking in Excel becomes reliable when the formula logic is clear. Start with amount variance, add percentage variance, use status labels for quick review, and build YTD totals with SUMIFS when the workbook needs monthly or department-level reporting.
If you only need formulas, the examples in this tutorial are enough to build a clean tracker. If you want dashboards, charts, slicers, and template structure already prepared, start with one of the paid budget templates linked above and customize it around your own categories, vendors, departments, or events.
Sources: U.S. Bureau of Labor Statistics business establishment survival data, Microsoft IF function documentation, Microsoft SUMIFS function documentation, and Microsoft ABS function documentation.
Last updated: July 2026