In today’s data-driven world, businesses generate massive amounts of data every single day. However, when this data stays scattered across multiple spreadsheets, it becomes difficult to analyze, understand, and act on it. As a result, decision-making slows down, and opportunities get missed.
So, how can you turn raw data into meaningful insights quickly and effectively?
👉 The answer is the Business Intelligence (BI) Dashboard in Excel.
Click to Purchases Business Intelligence (BI) Dashboard in Excel
This powerful and ready-to-use Excel dashboard helps you monitor performance, track key metrics, and analyze trends in one centralized place. Moreover, it transforms complex data into easy-to-understand visuals. Therefore, you can make faster, smarter, and more confident business decisions.
📌 What is a Business Intelligence (BI) Dashboard in Excel?
A Business Intelligence (BI) Dashboard in Excel is an interactive reporting tool that allows you to collect, analyze, and visualize business data using charts, KPIs, and filters.
Instead of using multiple reports, this dashboard enables you to:
- 📊 Track performance metrics in real time
- 📈 Analyze trends and patterns
- 🎯 Monitor KPIs across departments
- ⚡ Make data-driven decisions quickly
In addition, Excel makes it highly accessible because most professionals already use it daily.
🚀 Why Should You Use a BI Dashboard in Excel?
Many businesses struggle with scattered data and manual reporting. However, with a BI dashboard, you can simplify everything.
Here’s why it is essential:
- ✅ It centralizes all your business data
- ✅ It improves decision-making speed
- ✅ It reduces manual errors
- ✅ It enhances data visualization
- ✅ It increases productivity
Moreover, you can customize it according to your business needs.
Click to Purchases Business Intelligence (BI) Dashboard in Excel
📊 Key Features of Business Intelligence (BI) Dashboard in Excel
Let’s explore the powerful features included in this ready-to-use dashboard.
🔹 Page Navigator
- Located on the left side
- Allows quick navigation across all pages
- Improves user experience significantly
📁 Dashboard Structure (5 Powerful Pages)
This BI dashboard includes 5 interactive pages, each designed for a specific type of analysis.
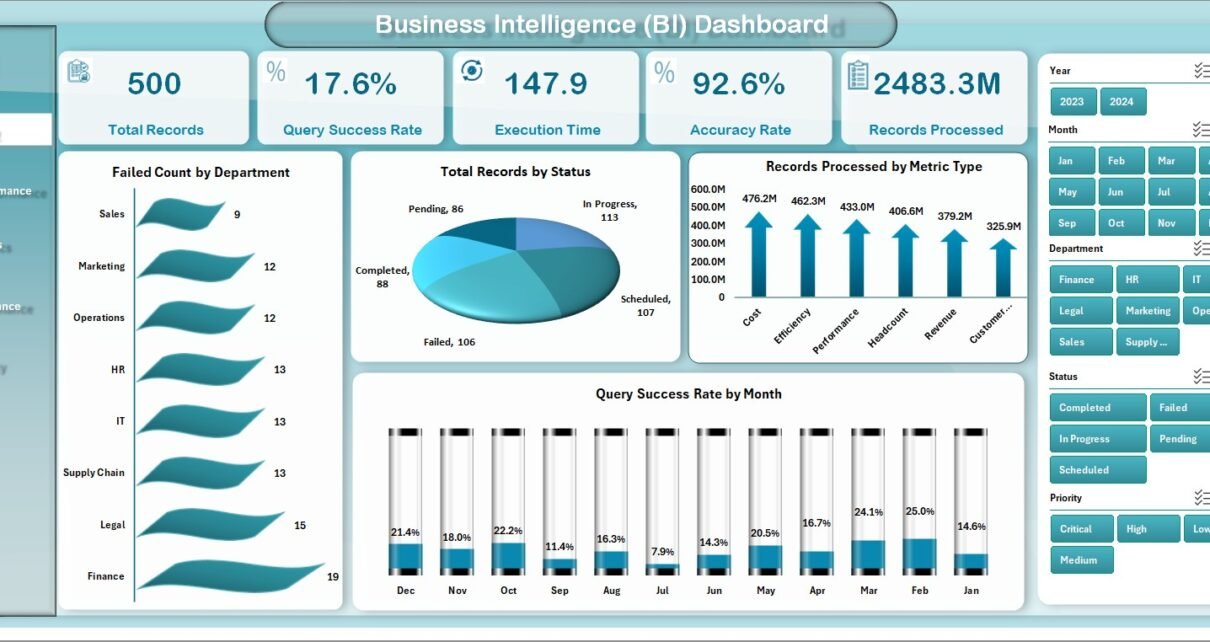
📊 1. Overview Page – Get a Complete Snapshot
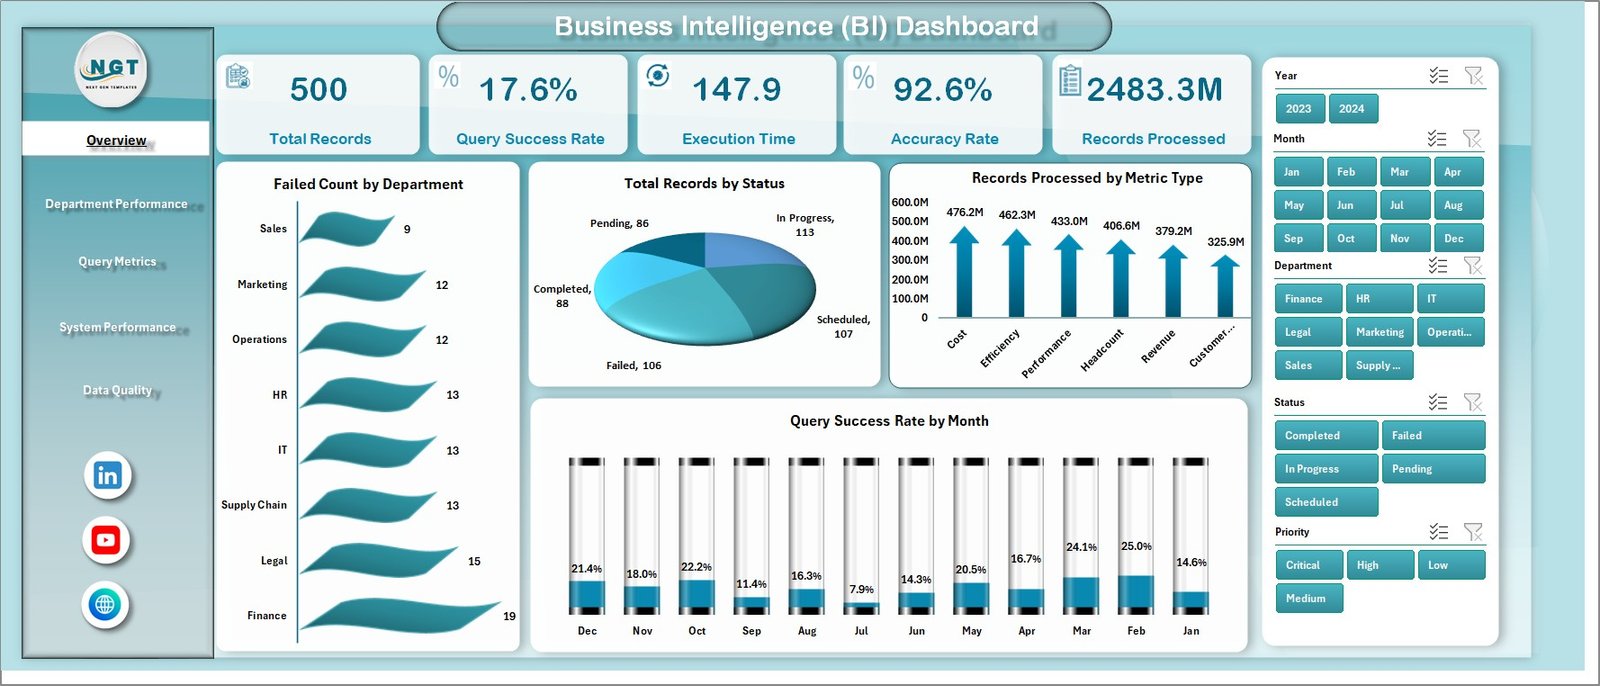
The Overview page provides a high-level summary of your business performance.
🔑 KPI Cards:
- Total Records
- Completed Status %
- In Progress %
- Accuracy Rate
📈 Charts Included:
- Status Completed % by Urgency Level
- Status In Progress % by Urgency Level
- Total Record by Location
- Superstructure Condition by Urgency Level
👉 As a result, you can instantly understand overall performance without diving into details.
Click to Purchases Business Intelligence (BI) Dashboard in Excel
🏢 2. Department Performance – Analyze Department Efficiency
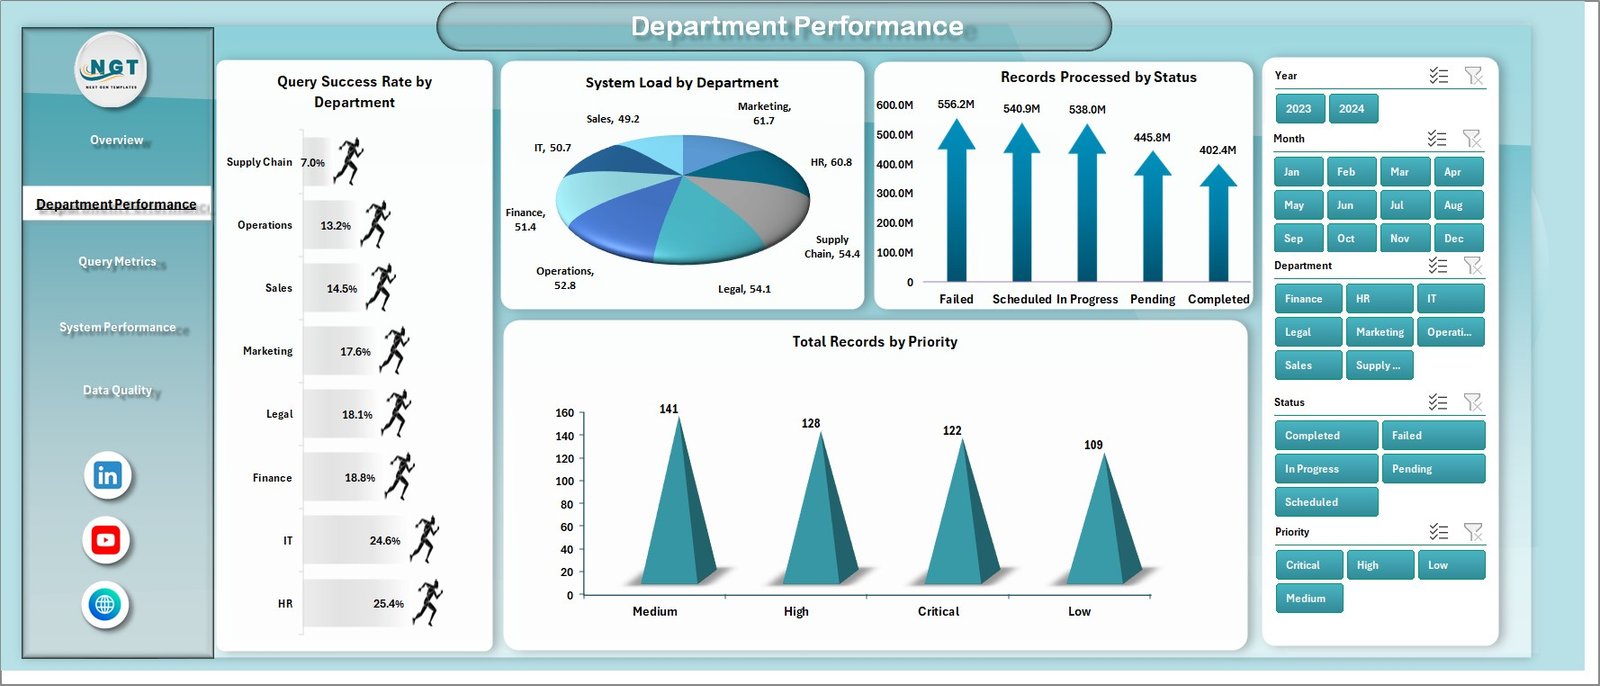
This page helps you compare how different departments perform.
📊 Charts Included:
- Query Success Rate by Department
- System Load by Department
- Records Processed by Status
- Total Records by Priority
👉 Therefore, managers can identify top-performing and underperforming departments easily.
🔍 3. Query Metrics – Understand Data Processing
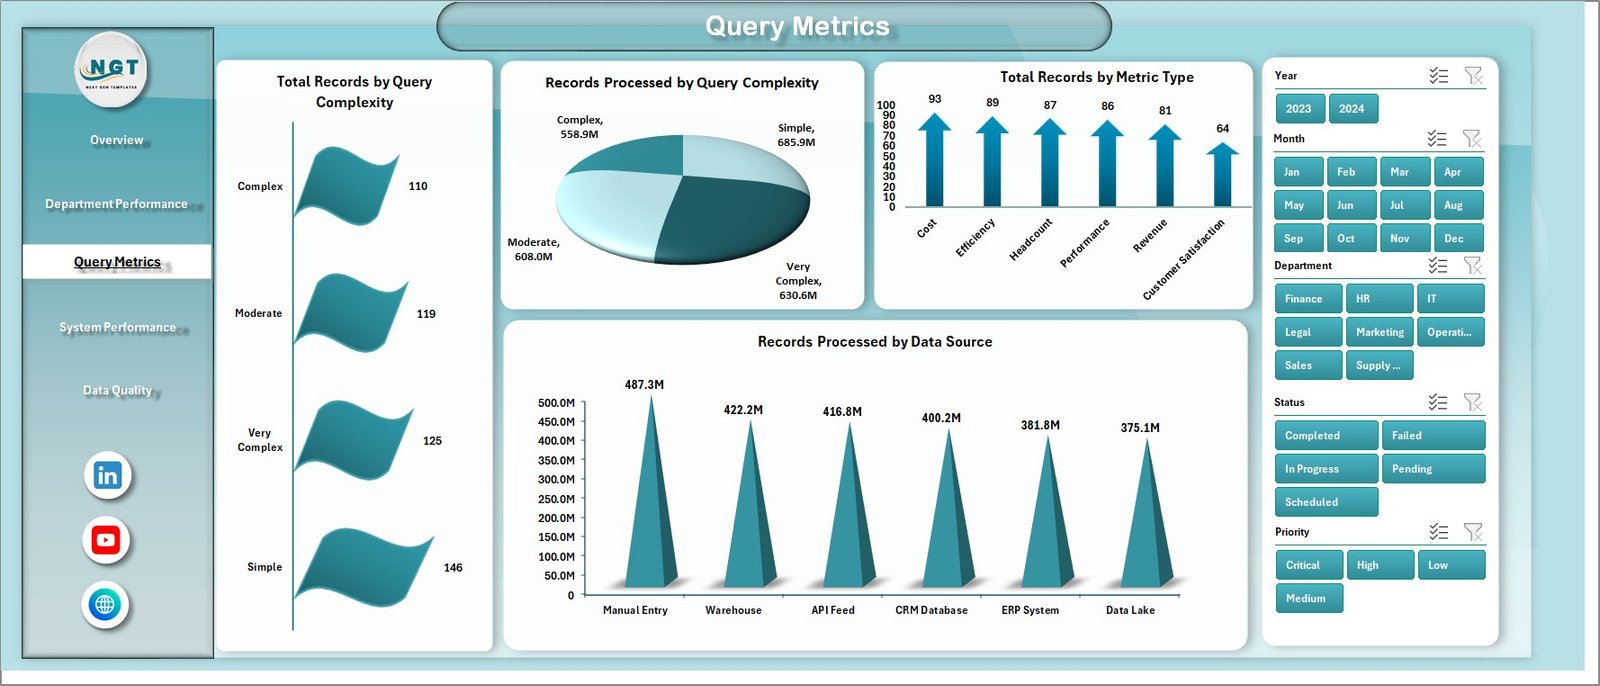
This page focuses on query-related performance.
📊 Charts Included:
- Total Records by Query Complexity
- Records by Query Complexity
- Total Records by Metric Type
- Records Processed by Data Source
👉 Consequently, you can evaluate how efficiently your system processes queries.
⚙️ 4. System Performance – Monitor System Efficiency
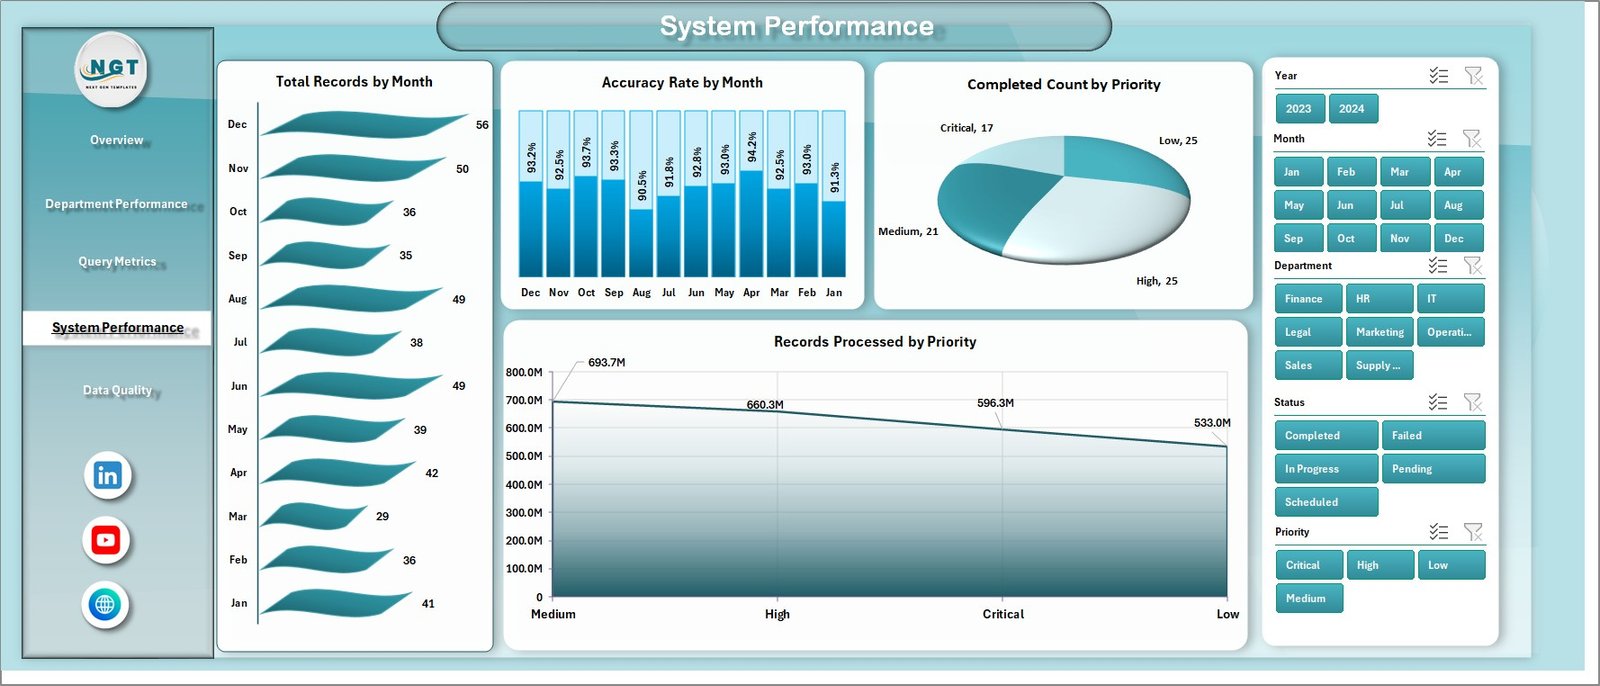
This page provides insights into system-level performance.
📊 Charts Included:
- Total Records by Month
- Accuracy Rate by Month
- Completed Count by Priority
- Records Processed by Priority
👉 In addition, this helps you identify performance trends over time.
Click to Purchases Business Intelligence (BI) Dashboard in Excel
🧪 5. Data Quality – Ensure Accuracy
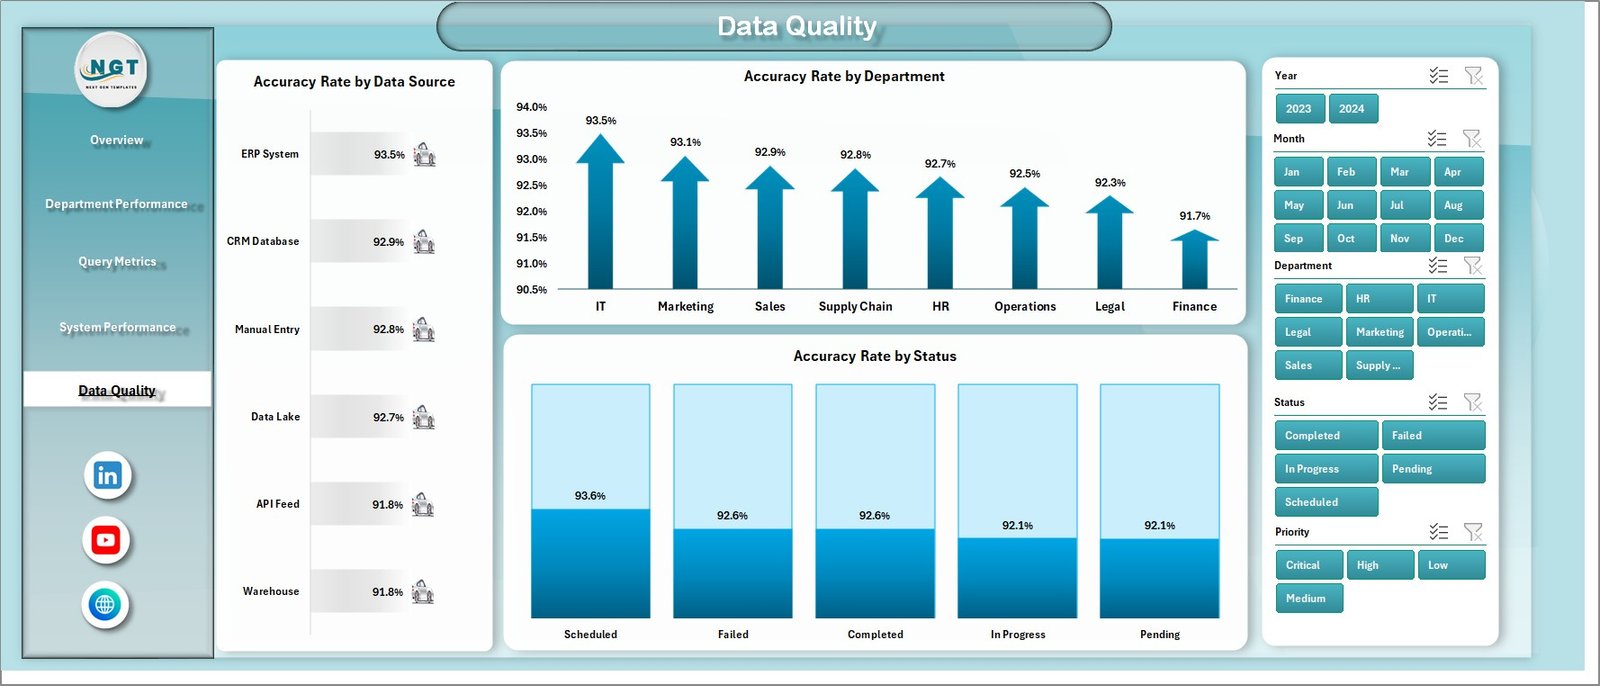
Data quality plays a critical role in business intelligence.
📊 Charts Included:
- Accuracy Rate by Data Source
- Accuracy Rate by Department
- Accuracy Rate by Status
👉 As a result, you can ensure your data remains reliable and actionable.
📂 Additional Sheets in the Dashboard
📄 Data Sheet
- Stores raw data
- Acts as the main data source
- Easy to update and manage
📊 Support Sheet
- Contains pivot tables
- Supports all charts and visuals
- Ensures smooth dashboard performance
🎯 How Does a BI Dashboard Improve Decision-Making?
A BI dashboard transforms how businesses operate. Instead of guessing, you rely on actual data.
Here’s how it helps:
- 📌 Provides real-time insights
- 📌 Highlights trends and patterns
- 📌 Identifies problems early
- 📌 Improves forecasting accuracy
- 📌 Enhances strategic planning
Therefore, businesses become more agile and competitive.
💡 Advantages of Business Intelligence (BI) Dashboard in Excel
Using a BI dashboard in Excel offers several benefits.
✅ 1. Easy to Use
Most professionals already know Excel. Therefore, no additional training is required.
✅ 2. Cost-Effective
Unlike expensive BI tools, Excel is affordable and widely available.
✅ 3. Highly Customizable
You can modify dashboards based on your business needs.
✅ 4. Real-Time Analysis
As soon as you update data, the dashboard updates automatically.
✅ 5. Better Visualization
Charts and graphs make data easy to understand.
✅ 6. Improved Productivity
You save time by avoiding manual reporting.
Click to Purchases Business Intelligence (BI) Dashboard in Excel
⚠️ Opportunities for Improvement in BI Dashboards
Although BI dashboards are powerful, you can still improve them.
- 🔧 Add automation using VBA or Power Query
- 📊 Integrate with external data sources
- ⚡ Improve refresh speed
- 🎯 Use advanced analytics features
- 📈 Add predictive insights
Therefore, continuous improvement ensures better performance.
🛠️ Best Practices for the Business Intelligence (BI) Dashboard in Excel
To get the most out of your dashboard, follow these best practices:
✔️ Keep It Simple
Avoid clutter. Use only necessary visuals.
✔️ Use Consistent Formatting
Maintain colors, fonts, and layouts.
✔️ Focus on Key Metrics
Do not overload the dashboard with unnecessary data.
✔️ Use Interactive Filters
Add slicers for better user experience.
✔️ Ensure Data Accuracy
Always validate your data before using it.
✔️ Optimize Performance
Reduce heavy formulas and unnecessary calculations.
✔️ Update Regularly
Keep your data fresh and relevant.
📈 How to Create a BI Dashboard in Excel?
If you want to build your own dashboard, follow these steps:
Step 1: Prepare Data
- Organize data in tables
- Remove duplicates
- Ensure consistency
Step 2: Create Pivot Tables
- Summarize data
- Use different dimensions
Step 3: Add Charts
- Use bar charts, line charts, and pie charts
Step 4: Insert KPI Cards
- Highlight key metrics
Step 5: Add Slicers
- Enable filtering
Step 6: Design Layout
- Keep it clean and professional
❓ What Makes This BI Dashboard Unique?
Click to Purchases Business Intelligence (BI) Dashboard in Excel
This dashboard stands out because:
- ✔️ It includes 5 powerful analysis pages
- ✔️ It uses interactive slicers
- ✔️ It provides real-time insights
- ✔️ It is fully customizable
- ✔️ It is beginner-friendly
🧠 Who Can Use This Dashboard?
This BI dashboard is ideal for:
- 👨💼 Business Managers
- 📊 Data Analysts
- 🏢 Operations Teams
- 💻 IT Professionals
- 📈 Consultants
🏁 Conclusion
The Business Intelligence (BI) Dashboard in Excel is a powerful tool that helps businesses turn raw data into meaningful insights. Moreover, it simplifies complex data analysis and improves decision-making.
Instead of relying on manual reports, you can use this dashboard to track performance, analyze trends, and optimize operations. As a result, your business becomes more efficient, data-driven, and competitive.
👉 Therefore, if you want to improve your business performance, this dashboard is a must-have tool.
❓ Frequently Asked Questions (FAQs)
1. What is a BI Dashboard in Excel?
A BI dashboard in Excel is an interactive tool used to analyze and visualize business data.
2. Is Excel good for business intelligence?
Yes, Excel is powerful, cost-effective, and widely used for BI purposes.
3. Can beginners use this dashboard?
Absolutely! It is designed to be user-friendly and easy to understand.
4. How often should I update the dashboard?
You should update it regularly, depending on your data frequency.
5. Can I customize the dashboard?
Yes, you can modify it according to your business needs.
6. What skills are required to use it?
Basic Excel knowledge is enough to get started.
Visit our YouTube channel to learn step-by-step video tutorials
Click to Purchases Business Intelligence (BI) Dashboard in Excel