Call centers deal with hundreds or even thousands of customer calls every day. When the workload increases, many callers hang up before they reach an agent. This impacts customer satisfaction, increases complaints, and affects business performance. To overcome this problem, companies track the Call Abandonment Rate, one of the most important metrics for customer experience.
A Call Abandonment Rate KPI Dashboard in Power BI gives you a clear and real-time view of how many calls your team misses, why they miss them, and how fast your team responds. With this dashboard, leaders improve service quality, reduce call drops, and make better staffing decisions.
In this detailed guide, you will learn everything about the Call Abandonment Rate KPI Dashboard in Power BI, including key features, working pages, advantages, best practices, and FAQs.
Click to Purchases Call Abandonment Rate KPI Dashboard in Power BI
What Is a Call Abandonment Rate KPI Dashboard in Power BI?
A Call Abandonment Rate KPI Dashboard in Power BI is a ready-to-use reporting solution that tracks the percentage of inbound calls that customers disconnect before speaking to an agent. The dashboard pulls data from an Excel file and converts it into interactive visuals, KPIs, target comparisons, and trend charts.
You can monitor MTD (Month-to-Date), YTD (Year-to-Date), targets, and previous year performance in one place. As a result, you understand whether your call center performs well or needs improvement.
Why Is Call Abandonment Rate So Important?
Call abandonment affects customer trust directly. When customers call support, they expect quick help. If they wait too long, they disconnect and leave dissatisfied. A high abandonment rate signals:
-
Long waiting times
-
Not enough staff
-
Poor call routing
-
High call volumes
-
Technical issues
A dashboard makes these issues clear and actionable.
How Does the Call Abandonment Rate KPI Dashboard in Power BI Work?
The dashboard uses three worksheets in the Excel file:
1. Input_Actual Sheet
You enter:
-
KPI Name
-
Month (first day of the month)
-
MTD Actual
-
YTD Actual
2. Input_Target Sheet
You enter:
-
KPI Name
-
Month
-
MTD Target
-
YTD Target
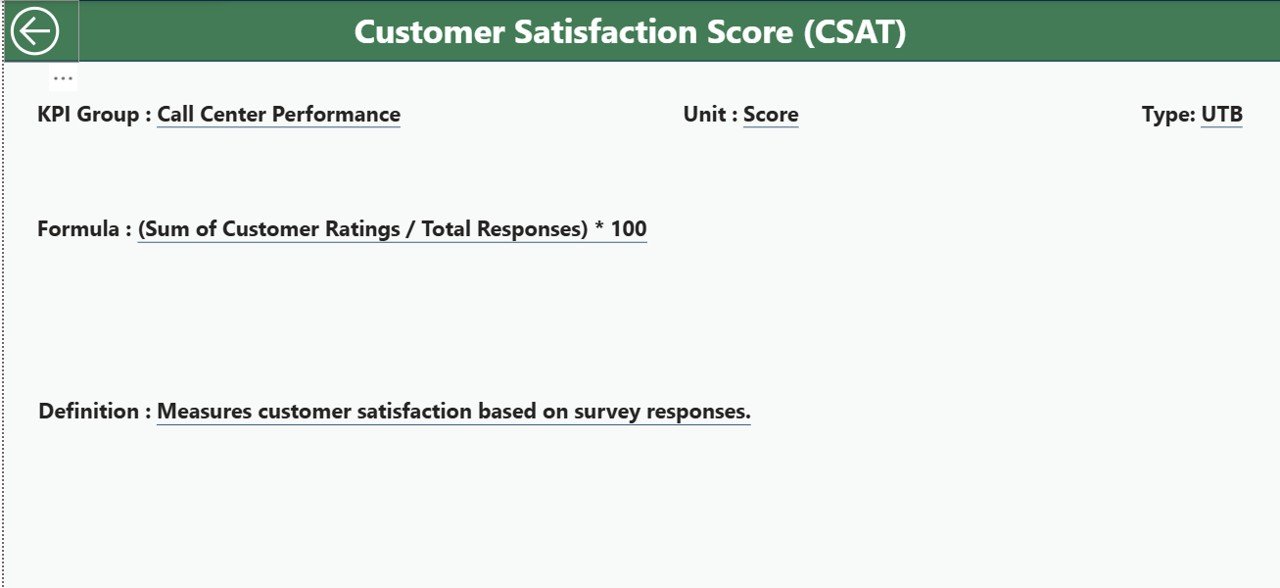
3. KPI Definition Sheet
You enter:
-
KPI Number
-
KPI Group
-
KPI Name
-
Unit
-
Formula
-
Definition
-
Type (UTB or LTB)
Power BI reads these sheets and presents the complete dashboard automatically.
What Are the Key Features of the Call Abandonment Rate Dashboard?
This dashboard contains 3 interactive pages in Power BI:
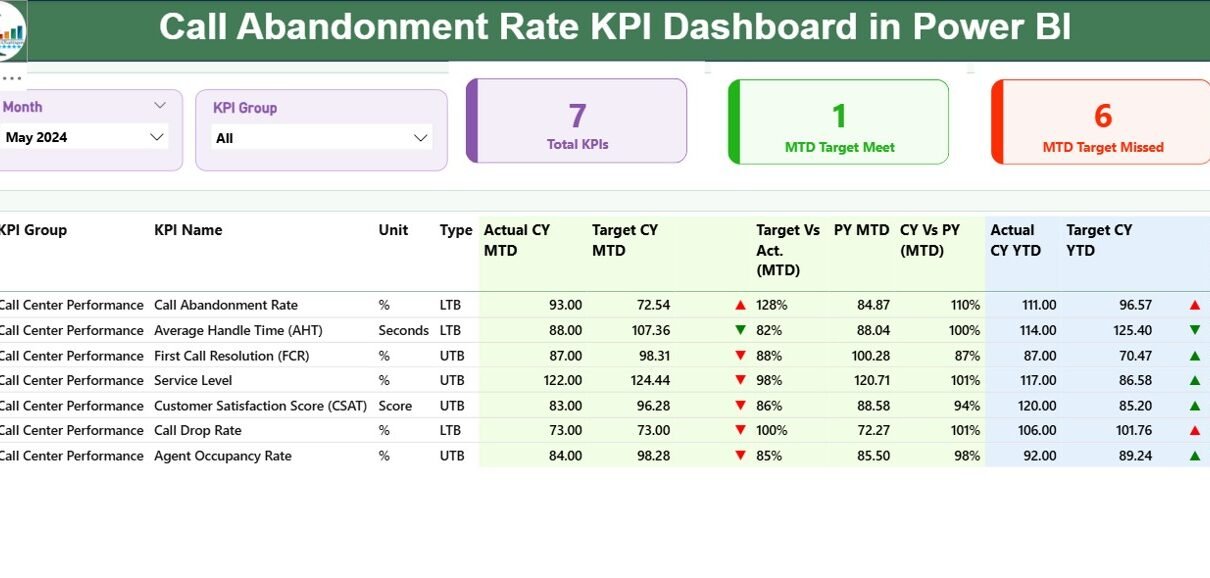
1. Summary Page (Main Dashboard Page)
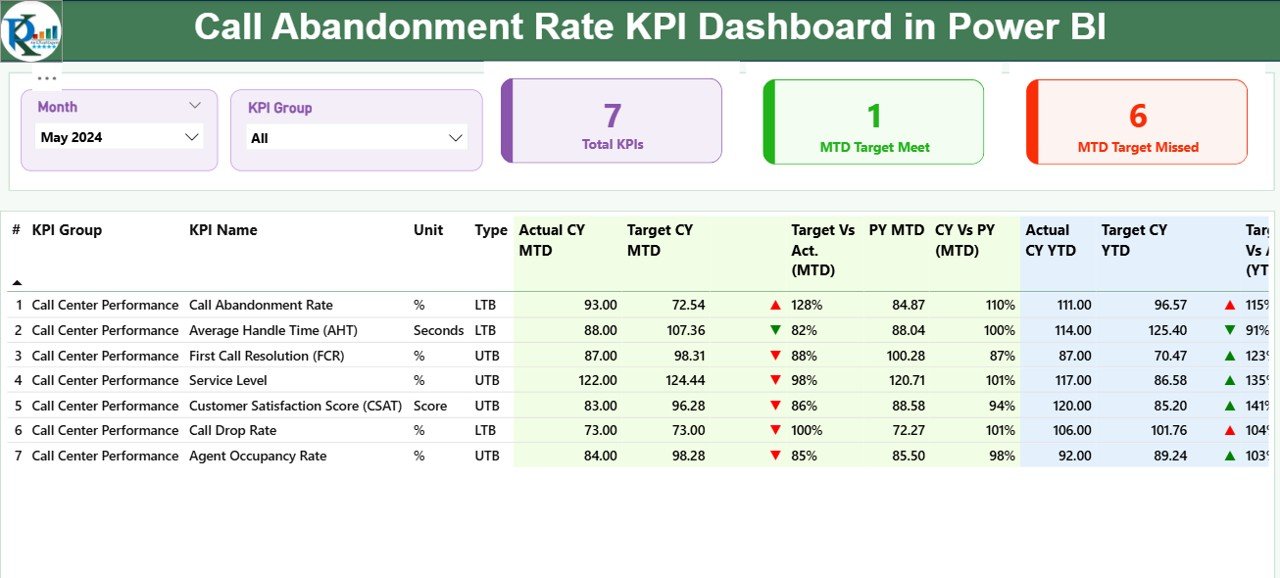
The summary page gives you a quick but complete view of all KPIs related to call abandonment.
Click to Purchases Call Abandonment Rate KPI Dashboard in Power BI
Top Slicers
-
Month Slicer
-
KPI Group Slicer
These slicers allow fast filtering and clean navigation.
KPI Performance Cards
The top section shows:
-
Total KPIs count
-
MTD Target Meet count
-
MTD Target Missed count
These help you understand performance at a glance.
Detailed KPI Table
The dashboard displays the following columns:
-
KPI Number – Sequence number
-
KPI Group – Call center category
-
KPI Name – KPI title
-
Unit – Unit of measurement
-
Type – LTB (Lower the Better) or UTB (Upper the Better)
MTD Section
-
Actual CY MTD
-
Target CY MTD
-
MTD Icon (▲ green = target achieved, ▼ red = below target)
-
Target Vs Actual (MTD)
-
PY MTD
-
CY vs PY (MTD)
YTD Section
-
Actual CY YTD
-
Target CY YTD
-
YTD Icon
-
Target Vs Actual (YTD)
-
PY YTD
-
CY vs PY (YTD)
This section helps you track month and year performance with full clarity.
2. KPI Trend Page
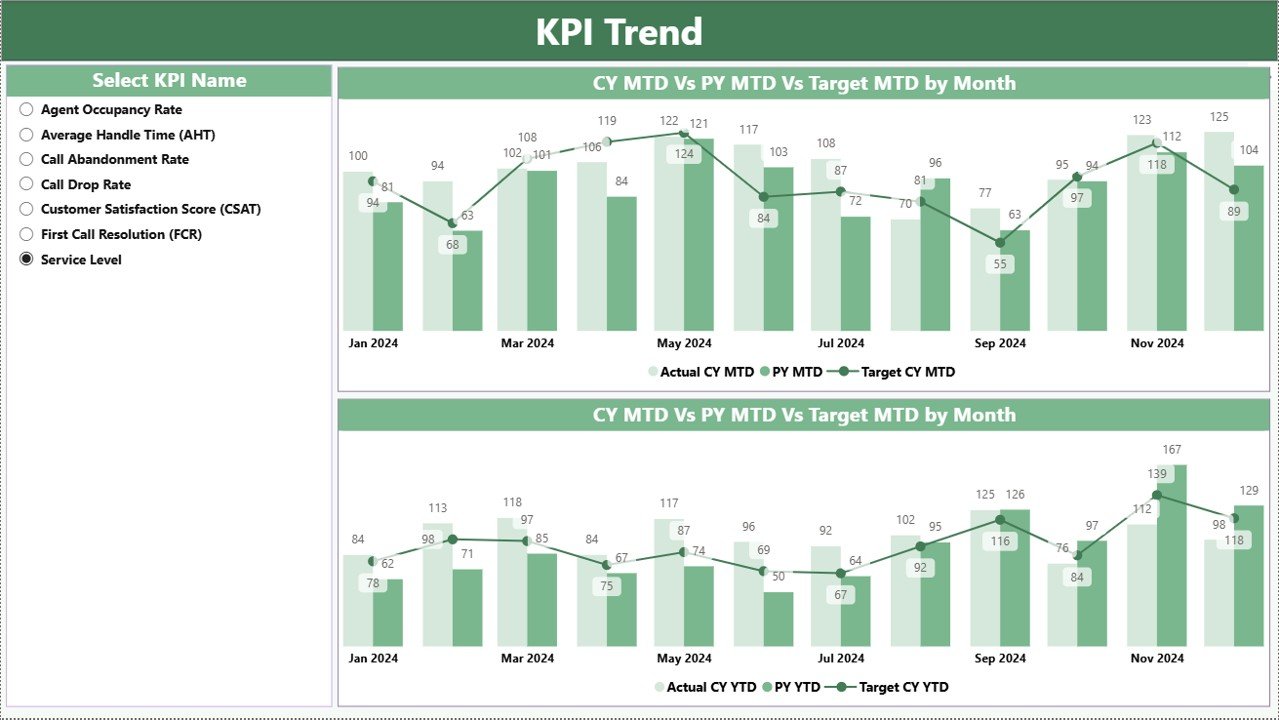
This page displays combo charts for:
-
Actual Current Year
-
Previous Year
-
Targets
It includes both MTD and YTD trends.
A KPI Name slicer on the left allows selection of any KPI for detailed analysis.
3. KPI Definition Page (Drill-Through Page)
This hidden page gives definitions and formulas for each KPI. You can:
-
Select any KPI from the summary page
-
Right-click
-
Choose “Drill Through”
-
View full KPI details
A back button helps you return to the main dashboard easily.
What Makes This Dashboard Important for Call Centers?
Click to Purchases Call Abandonment Rate KPI Dashboard in Power BI
Call centers must understand:
-
How many customer calls drop?
-
Why do customers disconnect?
-
Are agents overloaded?
-
Are staffing levels adequate?
-
How does current performance compare to last year?
This dashboard answers all these questions immediately.
What Problems Does the Dashboard Solve?
Businesses face many call-related challenges:
-
Long waiting time
-
High call volume
-
Inaccurate data tracking
-
No real-time insights
-
Lack of performance comparison
This dashboard solves these problems by giving a clear, automated, and interactive view of call abandonment.
How Does the Dashboard Improve Call Center Operations?
The dashboard improves operations by:
-
Showing real-time performance
-
Highlighting problem months
-
Revealing team workload
-
Comparing current vs previous year
-
Displaying actual vs target performance
-
Supporting staffing decisions
Advantages of Call Abandonment Rate KPI Dashboard in Power BI
1. Clear Visibility of Performance
The dashboard shows all KPIs with MTD and YTD numbers so you see performance instantly.
2. Reduces Customer Dissatisfaction
You detect high abandonment early and take corrective steps.
3. Improves Staffing Decisions
The trend page identifies when call volumes increase so you can assign more agents.
4. Data-Driven Insights
Icons and percentages show whether KPIs meet targets.
5. Better Comparison with Previous Year
You see how this year performs compared to last year.
6. Ready-to-Use Structure
The Excel sheets make it easy to enter data and update the dashboard instantly.
How to Interpret the Dashboard Correctly?
Here is how you read the dashboard:
MTD Values
Shows performance within the current month.
YTD Values
Shows performance from January to the selected month.
Target vs Actual
A percentage value shows whether:
-
Actual < Target → Problem
-
Actual > Target → Good
CY vs PY
Shows improvement or decline.
Color Indicators
-
Green ▲ = Performance meets or exceeds target
-
Red ▼ = Performance below target
Best Practices for Using the Call Abandonment Rate KPI Dashboard
1. Update Data Regularly
Fill Actual and Target sheets every month.
2. Review Trends Weekly
Trends reveal patterns that help you act early.
3. Focus on High-Risk KPIs
Identify KPIs that repeatedly miss targets.
4. Improve Agent Availability
High abandonment often links to low staffing.
5. Use Drill-Through for Clarity
Open KPI definitions to understand formulas.
6. Compare with Industry Benchmarks
Always check how your numbers compare with standard call center KPIs.
7. Keep Target Values Realistic
Avoid unrealistic goals that create unnecessary pressure.
How Do Call Centers Reduce Call Abandonment with This Dashboard?
Call centers use the dashboard to:
-
Shorten wait time
-
Route calls to free agents
-
Increase the number of agents during peak hours
-
Track call spikes
-
Analyze historical trends
-
Adjust call handling strategies
Who Should Use This Dashboard?
This dashboard is ideal for:
-
Call center managers
-
Quality managers
-
Customer experience teams
-
Workforce planning teams
-
Business analysts
-
Operations heads
Conclusion
A Call Abandonment Rate KPI Dashboard in Power BI is a powerful tool for any call center that wants to improve customer satisfaction and reduce missed calls. It tracks actual performance, targets, trends, and year-on-year comparison in a clean and interactive way. When you use this dashboard, you understand your call center better, make faster decisions, and help your team deliver a smooth customer experience.
Frequently Asked Questions (FAQs)
1. What is Call Abandonment Rate?
It is the percentage of callers who disconnect before speaking to an agent.
2. Why should call centers track this KPI?
It helps measure customer satisfaction and service quality.
3. What is a good call abandonment rate?
Most industries target less than 5%.
4. Can Power BI handle large call center data?
Yes, Power BI can manage thousands of rows with ease.
5. What causes high call abandonment?
Long wait time, low staffing, technical issues, and high call volume.
6. How often should I update the dashboard?
Update it monthly for accurate reporting.
7. Can I customize the KPIs?
Yes, you can modify KPI names, formulas, and targets in the Excel file.
8. Does the dashboard support drill-through?
Yes, the KPI Definition page offers full drill-through support.
9. Can beginners use this dashboard easily?
Yes, the design is simple and user-friendly.
10. What makes this dashboard better than spreadsheets?
It automates comparisons, tracks trends, and offers visual insights instantly.
Visit our YouTube channel to learn step-by-step video tutorials
Click to Purchases Call Abandonment Rate KPI Dashboard in Power BI