Running a call center means managing hundreds or even thousands of calls every day. Agents handle different customer issues, managers track costs, and leadership teams expect clear performance reports. However, raw call data stored in Excel sheets often creates confusion instead of clarity. Therefore, businesses increasingly rely on a Call Center Operations Dashboard in Excel to convert daily call data into meaningful insights.
In this detailed guide, you will learn what a Call Center Operations Dashboard in Excel is, how it works, its page-wise structure, advantages, best practices, and frequently asked questions. Moreover, this article explains how a ready-to-use Excel dashboard simplifies call center performance tracking, cost control, and service quality improvement.
Click to Purchases Call Center Operations Dashboard in Excel
What Is a Call Center Operations Dashboard in Excel?
A Call Center Operations Dashboard in Excel is a centralized reporting tool that visually presents key call center metrics using charts, KPIs, and interactive slicers. Instead of checking multiple spreadsheets, managers can monitor performance from a single dashboard.
Because Excel supports pivot tables, slicers, and charts, this dashboard remains flexible, affordable, and easy to update. Moreover, decision-makers can filter data by agent, team, call type, region, and month in seconds.
As a result, call center leaders quickly identify performance gaps, cost issues, and customer satisfaction trends.
Why Do Call Centers Need an Operations Dashboard in Excel?
Call centers operate in a fast-paced environment. Therefore, managers need instant visibility into operations. A dashboard helps because:
-
It reduces manual reporting work
-
It improves decision-making speed
-
It highlights underperforming areas
-
It supports data-driven staffing decisions
-
It improves customer experience
Without a dashboard, teams spend hours preparing reports. However, with a Call Center Operations Dashboard in Excel, reports update automatically when data changes.
Key Features of the Call Center Operations Dashboard in Excel
This ready-to-use dashboard comes with several powerful features designed specifically for call center operations.
1. Page Navigator for Easy Navigation
The Page Navigator, located on the left side, allows users to move smoothly between dashboard pages. As a result, managers avoid scrolling through sheets and save valuable time.
2. Interactive Slicers
Each page includes right-side slicers that allow filtering by:
-
Agent
-
Team
-
Call Type
-
Region
-
Month
Because slicers update all visuals instantly, analysis becomes faster and more accurate.
3. Five Dedicated Analysis Pages
The dashboard includes five structured pages, each designed for a specific type of analysis. Let us explore each page in detail.
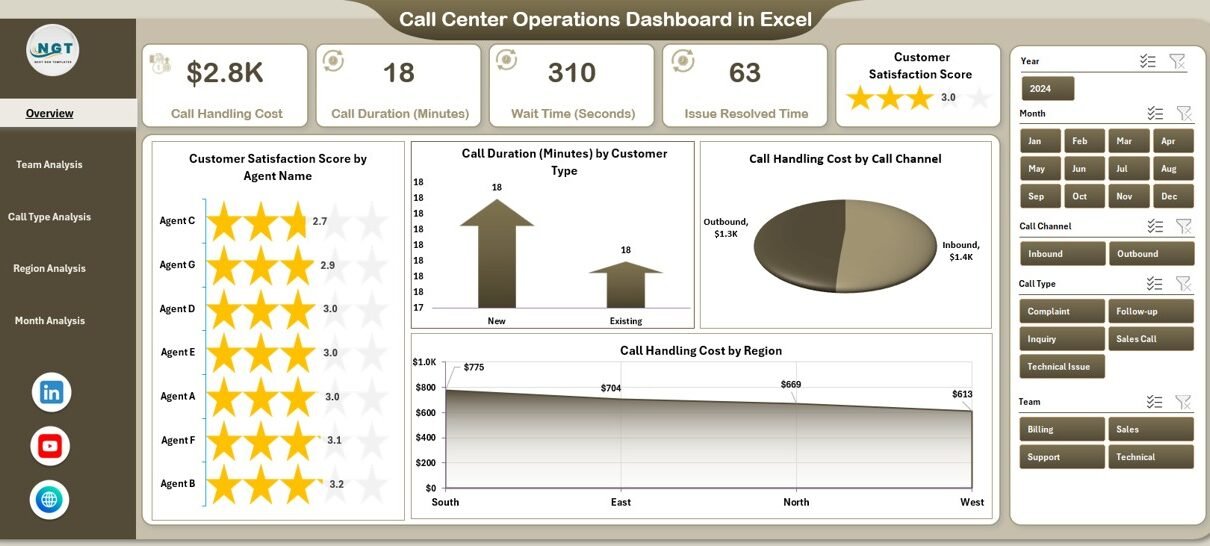
Overview Page: How Does the Call Center Perform Overall?
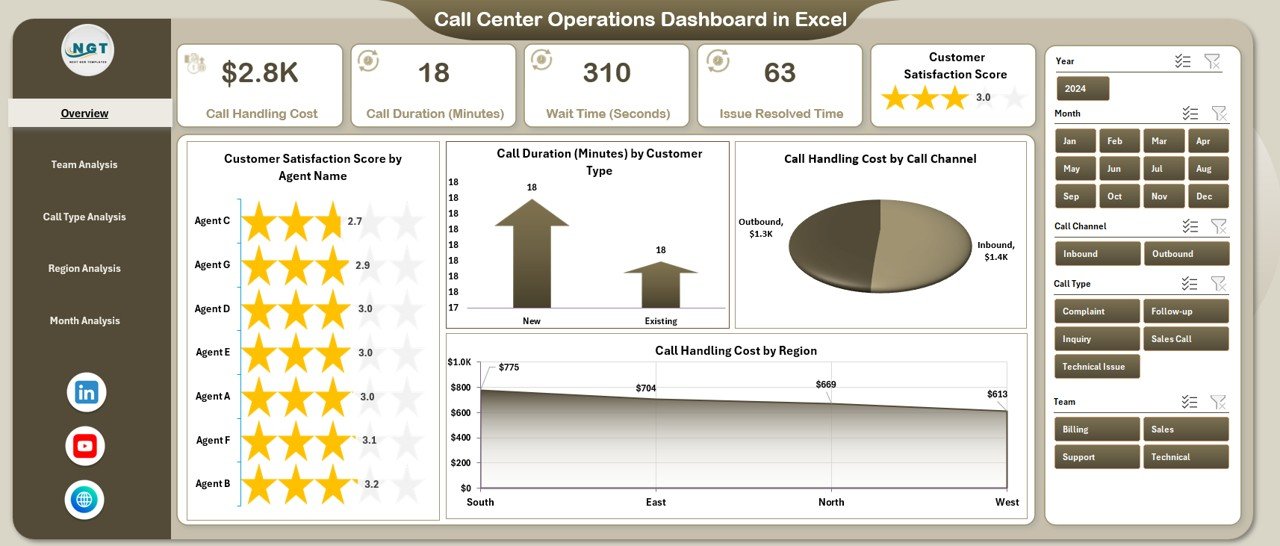
The Overview Page acts as the control center of the dashboard. It provides a high-level summary of call center performance.
Key Elements of the Overview Page
-
Right-side slicers for quick filtering
-
4 KPI cards for instant insights
-
4 analytical charts for performance comparison
Charts on the Overview Page
-
Customer Satisfaction Score by Agent Name
-
Helps identify top-performing and low-performing agents
-
Supports coaching and training decisions
-
-
Call Duration by Customer Type
-
Shows which customer segments require longer handling time
-
Helps optimize call scripts and workflows
-
-
Call Handling Cost by Call Channel
-
Compares cost efficiency across phone, email, or chat channels
-
Supports channel optimization strategies
-
-
Call Handling Cost by Region
-
Highlights high-cost regions
-
Helps allocate resources efficiently
-
Because this page summarizes operations quickly, managers can take immediate action without deep analysis.
Team Analysis Page: Which Teams Perform Better?
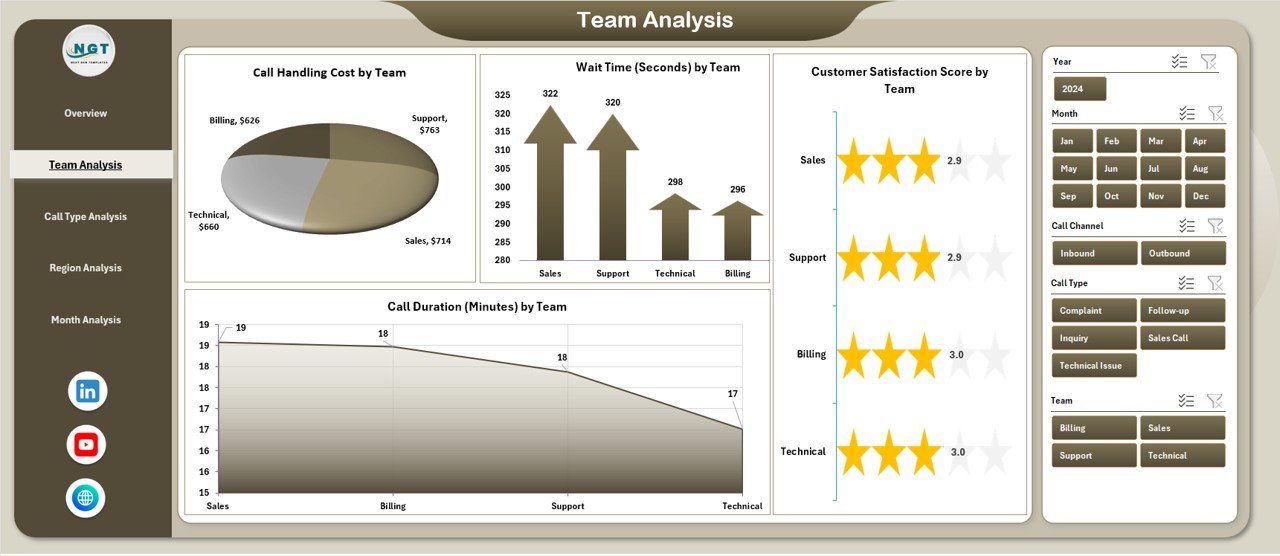
The Team Analysis Page focuses on performance at the team level. Therefore, supervisors can evaluate productivity and service quality across different teams.
Key Features of the Team Analysis Page
Click to Purchases Call Center Operations Dashboard in Excel
-
Right-side slicers for dynamic filtering
-
Clear team-level performance charts
Charts on the Team Analysis Page
-
Customer Satisfaction Score by Team
-
-
Identifies teams delivering better service
-
Encourages healthy competition
-
-
Call Duration by Team
-
Highlights teams handling calls efficiently
-
Helps identify process bottlenecks
-
-
Call Handling Cost by Team
-
Tracks cost efficiency across teams
-
Supports budget control
-
-
Additional Team Performance Metrics
-
Enables deeper operational insights
-
As a result, managers can reward high-performing teams and support underperforming ones.
Call Type Analysis Page: Which Call Types Create Challenges?
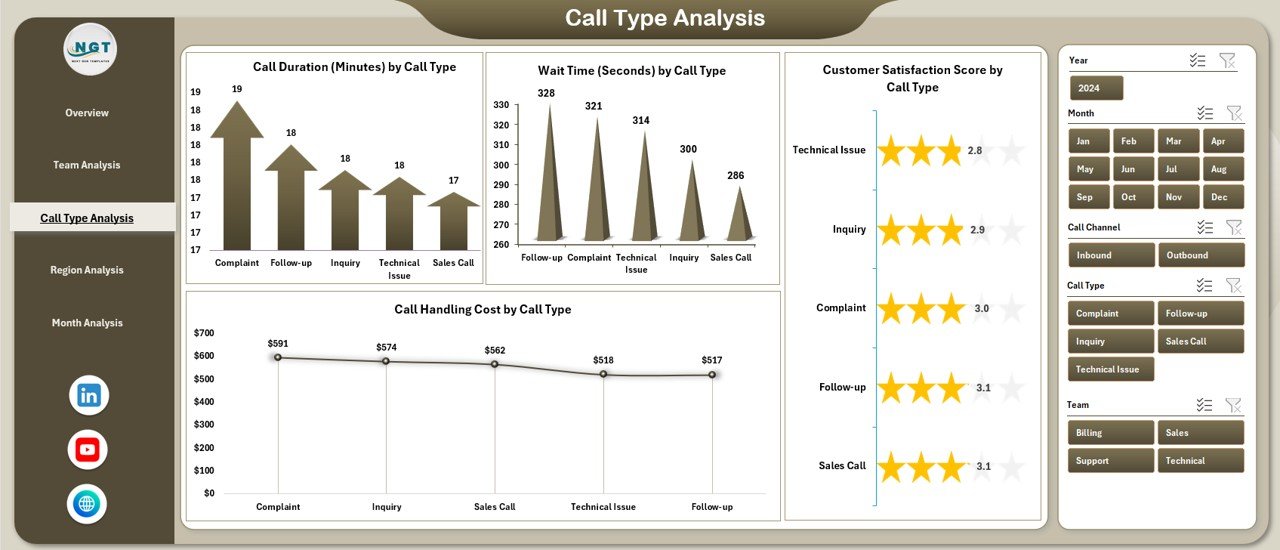
Different call types require different handling approaches. Therefore, the Call Type Analysis Page helps understand how each call category impacts performance.
Charts on the Call Type Analysis Page
-
Customer Satisfaction Score by Call Type
-
Shows which call types frustrate customers
-
Helps improve scripts and training
-
-
Call Duration by Call Type
-
Identifies complex call categories
-
Supports process improvement initiatives
-
-
Call Handling Cost by Call Type
-
Highlights expensive call categories
-
Helps optimize cost structure
-
-
Wait Time by Call Type
-
Shows where customers wait the longest
-
Supports queue management improvements
-
Because this analysis highlights problem areas, managers can prioritize improvements effectively.
Region Analysis Page: How Do Regions Compare?
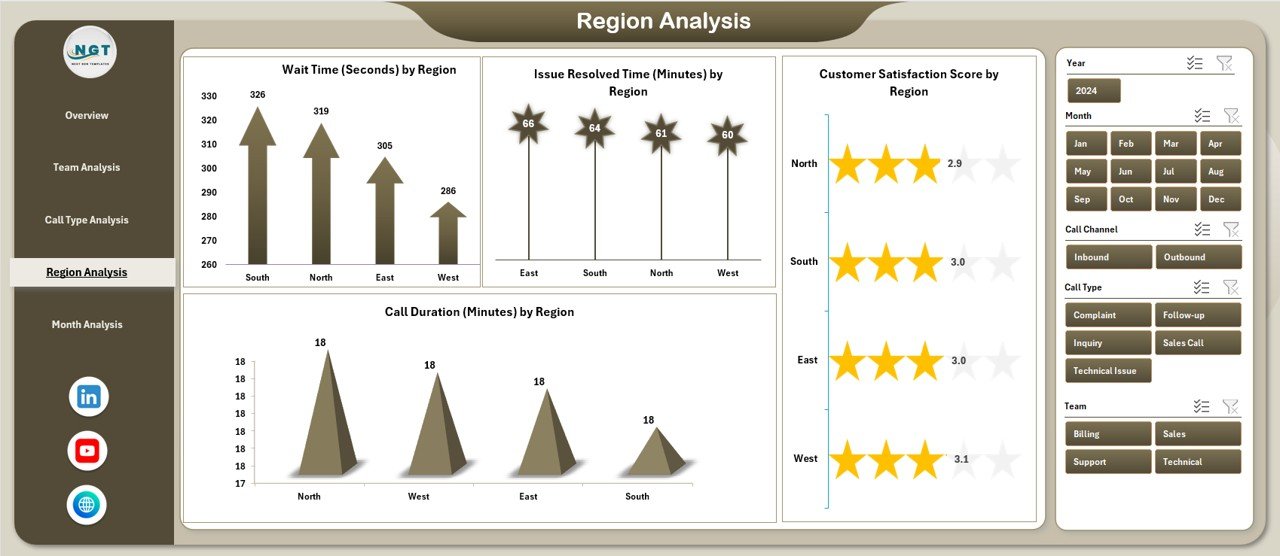
The Region Analysis Page provides a geographical view of call center performance. Therefore, regional managers can compare service levels and costs.
Charts on the Region Analysis Page
-
Customer Satisfaction Score by Region
-
Identifies regions delivering excellent service
-
-
Call Duration by Region
-
Shows efficiency differences across regions
-
-
Call Handling Cost by Region
-
Helps control regional operating expenses
-
-
Issue Resolved Time by Region
-
Measures resolution efficiency
-
As a result, leadership teams can make region-specific decisions instead of using a one-size-fits-all approach.
Month Analysis Page: How Does Performance Change Over Time?
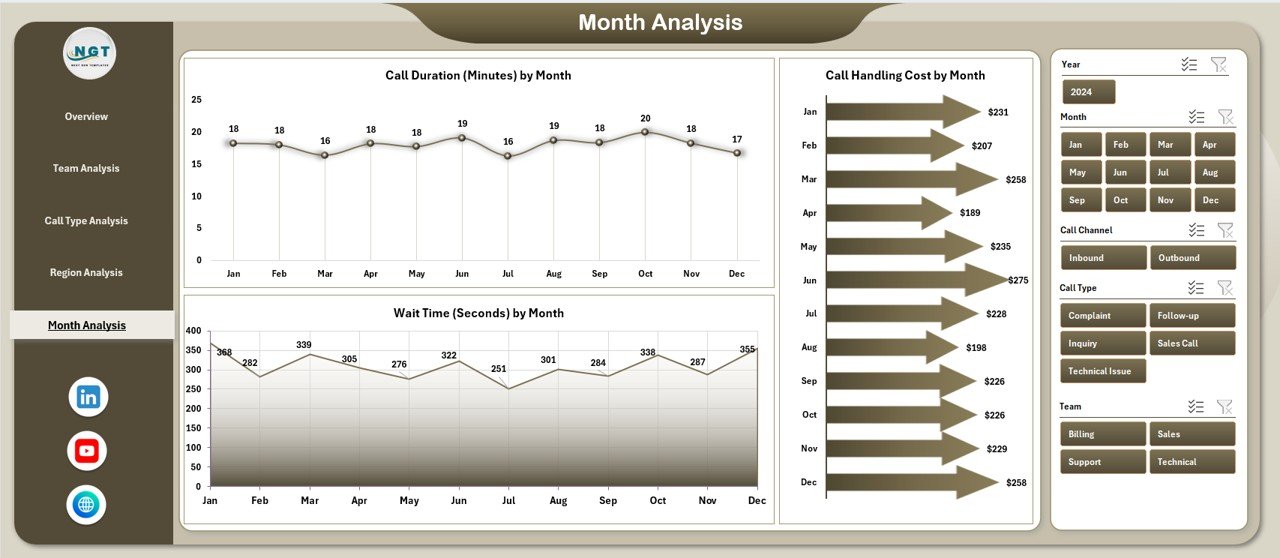
The Month Analysis Page focuses on trends and seasonality. Therefore, managers can track performance changes over time.
Charts on the Month Analysis Page
-
Call Duration by Month
-
Identifies workload trends
-
Helps with staffing plans
-
-
Call Handling Cost by Month
-
Tracks monthly cost fluctuations
-
-
Wait Time by Month
-
Shows service level changes over time
-
Because trends reveal patterns, managers can prepare for peak seasons proactively.
Support Sheet and Data Sheet: Why Are They Important?
Support Sheet
The Support Sheet stores helper tables, lookup values, and calculations. As a result, the dashboard remains clean and easy to manage.
Data Sheet
The Data Sheet acts as the raw data source. It contains call-level records such as:
Click to Purchases Call Center Operations Dashboard in Excel
-
Agent Name
-
Team
-
Call Type
-
Region
-
Call Duration
-
Call Handling Cost
-
Wait Time
-
Customer Satisfaction Score
-
Month
Because all charts use pivot tables, updating data automatically refreshes the dashboard.
bbbbbbbbbbbbbbbbbbbbbbbbbAdvantages of a Call Center Operations Dashboard in Excel
Using this dashboard provides several strategic benefits.
1. Faster Decision-Making
Managers view real-time performance metrics. Therefore, decisions become quicker and more accurate.
2. Improved Customer Satisfaction
By tracking satisfaction scores and wait times, teams improve service quality consistently.
3. Better Cost Control
Cost-related charts highlight inefficiencies. As a result, managers control budgets effectively.
4. Higher Agent Productivity
Agent-level insights support targeted coaching and training.
5. Easy Customization
Because the dashboard uses Excel, users customize it without technical expertise.
Best Practices for the Call Center Operations Dashboard in Excel
To get the most value, follow these best practices.
1. Maintain Clean and Consistent Data
Always standardize agent names, regions, and call types. Clean data ensures accurate insights.
2. Update Data Regularly
Refresh the Data Sheet daily or weekly to keep insights relevant.
3. Use Pivot Tables Correctly
Aggregate metrics logically:
-
Call Duration → Average
-
Call Handling Cost → Sum
-
Customer Satisfaction Score → Average
4. Avoid Overloading Charts
Limit each page to meaningful visuals. Clear dashboards improve readability.
5. Train Users Properly
Teach managers how to use slicers and interpret charts. Better understanding leads to better decisions.
Who Can Use a Call Center Operations Dashboard in Excel?
This dashboard suits many roles, including:
-
Call Center Managers
-
Operations Heads
-
Team Leaders
-
Quality Assurance Teams
-
Business Analysts
-
Customer Experience Managers
Because Excel is widely used, adoption becomes easy across departments.
Conclusion: Why Should You Use a Call Center Operations Dashboard in Excel?
A Call Center Operations Dashboard in Excel transforms raw call data into actionable insights. Instead of relying on manual reports, managers gain instant visibility into performance, costs, and customer satisfaction. Moreover, its structured pages, interactive slicers, and pivot-based charts make analysis simple and effective.
As call centers grow more complex, this dashboard becomes an essential tool for improving efficiency, reducing costs, and enhancing customer experience.
Frequently Asked Questions (FAQs)
1. What is the main purpose of a Call Center Operations Dashboard in Excel?
The main purpose is to monitor call center performance, costs, and customer satisfaction from a single, interactive Excel file.
2. Can beginners use this dashboard in Excel?
Yes, beginners can use it easily because it relies on standard Excel features like pivot tables and slicers.
3. How often should the dashboard data be updated?
Ideally, update the data daily or weekly to keep insights accurate and useful.
4. Can I customize the dashboard for my call center?
Yes, you can customize charts, KPIs, and slicers based on your operational needs.
5. Is this dashboard suitable for small call centers?
Absolutely. Small and large call centers both benefit from structured performance visibility.
Visit our YouTube channel to learn step-by-step video tutorials