Introduction
The Cardiology Institutes Dashboard in Power BI is a ready-to-use analytical tool designed to provide comprehensive, real-time insights into cardiology operations. By updating your data file and refreshing the connected Power BI file, the dashboard dynamically reflects your latest information, making decision-making efficient and data-driven.
Click to Purchases Cardiology Institutes Dashboard in Power BI
Key Features of Cardiology Institutes Dashboard in Power BI
- Multiple interactive pages tailored to analyze diverse cardiology metrics.
- High-level summary cards presenting key performance indicators such as Total Records, Equipment Cost, Operating Cost, Revenue, and Wait Time Days.
- Multiple slicers to apply quick filters and view customized data views.
- Dynamic visualizations including region-wise, city-wise, and department-wise breakdowns.
- Simple data updating process: connect, update, and refresh to get the newest insights.
Dashboard Pages Explanation
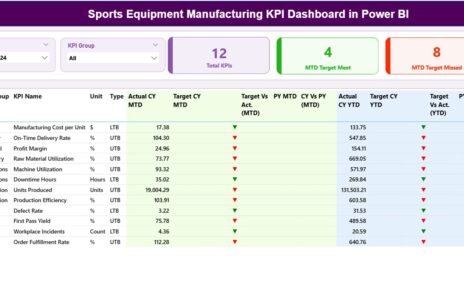
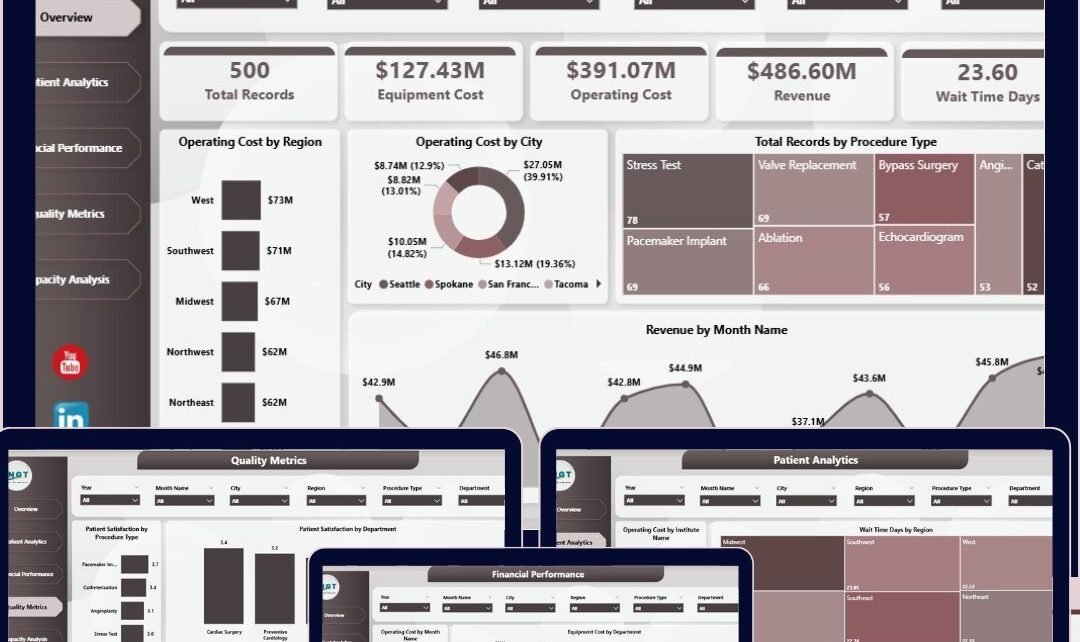
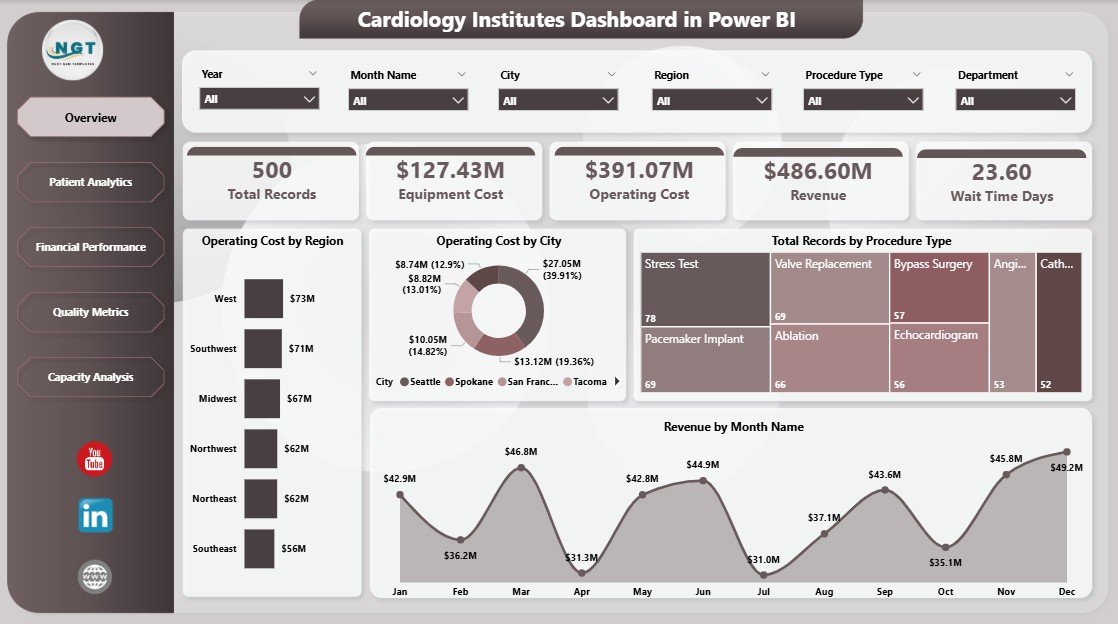
1. Overview Page
This page provides a snapshot of high-level cardiology institute data through the following cards:
- Total Records: Displays the total number of cardiology case records.
- Equipment Cost: Shows the aggregate cost related to medical equipment.
- Operating Cost: Highlights the overall expenditure on operations.
- Revenue: Displays total revenue generated.
- Wait Time Days: Average number of days patients wait for procedures.
The Key Charts include:
- Operating Cost by Region: Visualizes how operating costs are distributed across different regions to pinpoint cost-intensive areas.
- Operating Cost by City: Zooms in further to track city-level cost patterns for better resource allocation.
- Total Records by Procedure Type: Categorizes completed procedures, helping to understand procedural volume.
- Revenue by Month Name: Tracks monthly revenue trends, aiding in financial forecasting.
Cardiology Institutes Dashboard in Power BI
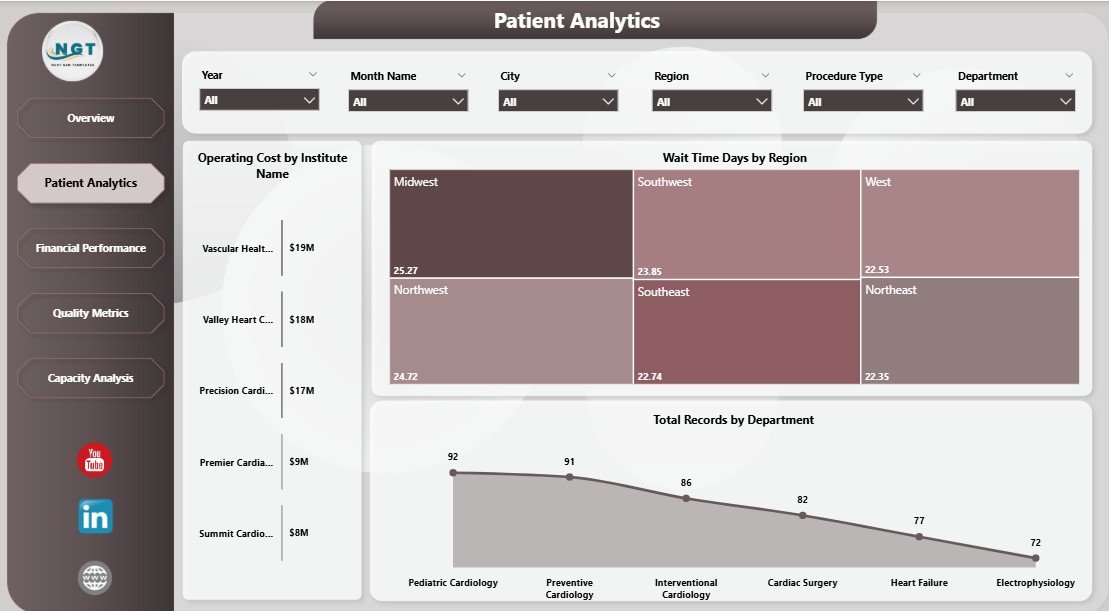
2. Patient Analytics
This page dives into patient-related metrics to enhance care delivery and optimize operational performance:
Click to Purchases Cardiology Institutes Dashboard in Power BI
- Operating Cost by Institute Name: Compares costs among institutes to identify efficiency and potential overspending.
- Wait Time Days by Region: Analyzes patient wait times geographically, helping to address bottlenecks.
- Total Records by Department: Measures departmental workload and case volumes.
Patient Analytics in Cardiology Institutes Dashboard
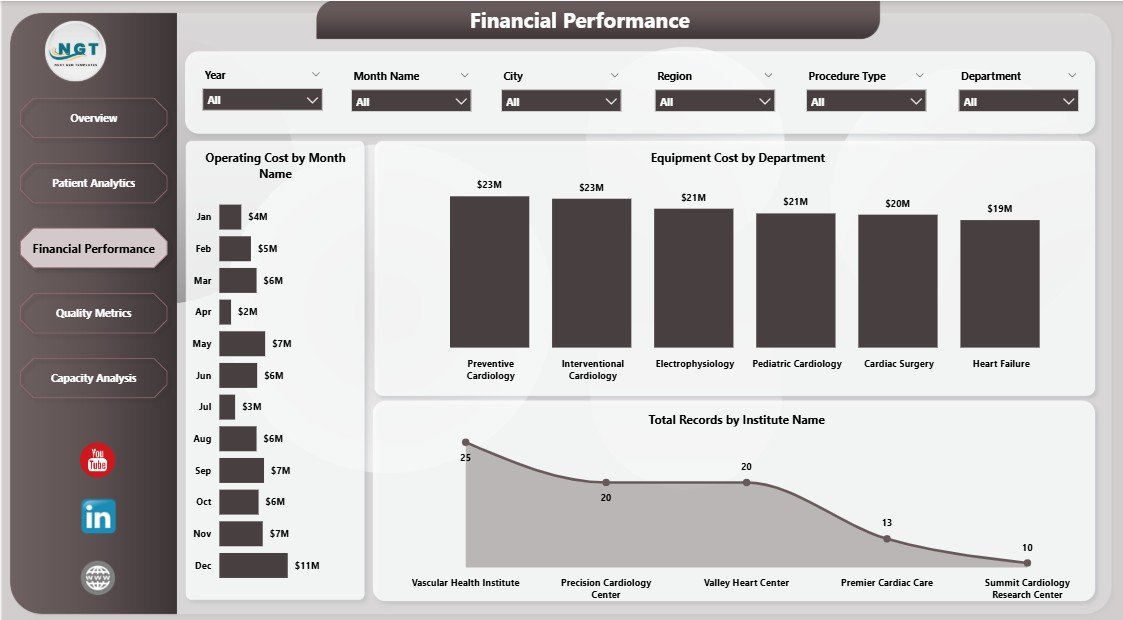
3. Financial Performance
This section focuses on financial insights critical for budgeting and profitability:
- Operating Cost by Month Name: Monthly operating expenditure trends to monitor and control costs.
- Equipment Cost by Department: Breakdown of equipment-related expenses by department for targeted cost management.
- Total Records by Institute Name: Case counts per institute correlate workload with costs and revenue.
Financial Performance of Cardiology Institutes Dashboard
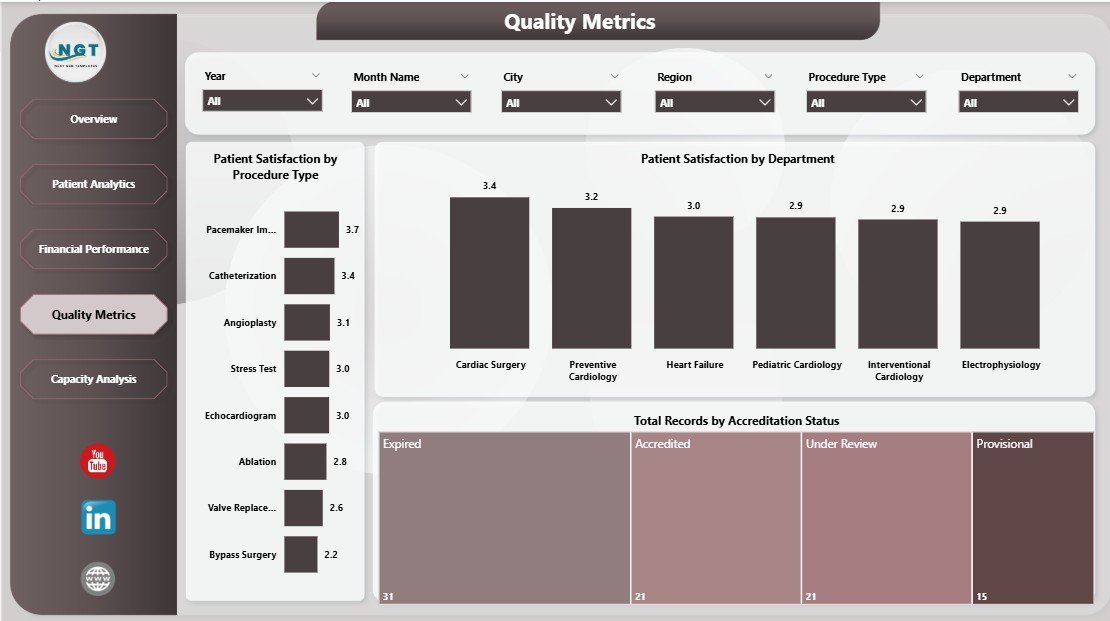
4. Quality Metrics
Measuring quality is essential to improving patient outcomes and institutional reputation:
- Patient Satisfaction by Procedure Type: Insights into patient satisfaction scores categorized by types of procedures performed.
- Patient Satisfaction by Department: Compares satisfaction levels across departments for quality enhancements.
- Total Records by Accreditation Status: Demonstrates records distribution related to accreditation levels, highlighting compliance and quality standards.
Quality Metrics in Cardiology Institutes Dashboard
5. Capacity Analysis
This page aids in operational planning by analyzing capacity and performance metrics:
- Revenue by Region: Indicates revenue distribution, identifying high-earning areas for focus.
- Wait Time Days by Department: Highlights departmental delays to optimize scheduling and resource management.
- Wait Time Days by Institute Name: Measures overall patient wait times per institute, enabling comparison and best practice sharing.
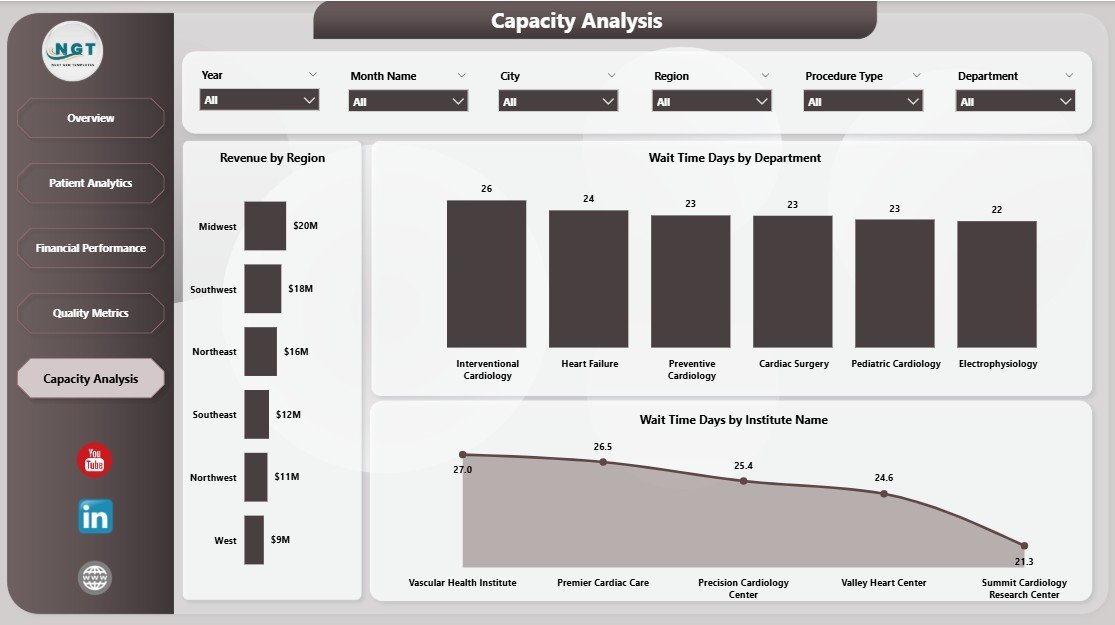
Capacity Analysis in Cardiology Institutes Dashboard
Advantages of Cardiology Institutes Dashboard in Power BI
- Real-time data refresh provides timely insights for swift decision-making.
- User-friendly interface with multiple slicers to customize views effortlessly.
- Interactive visual representation makes complex data easy to understand.
- Helps identify trends and areas requiring improvement without manual data crunching.
- Consolidates multiple data points in one platform, reducing reporting time.
Opportunities for Improvement
- Incorporate predictive analytics to forecast future trends and patient volumes.
- Add mobile-responsive views for dashboard accessibility on smartphones and tablets.
- Integrate patient demographic data for deeper clinical insights.
- Enable automated alert notifications for threshold breaches in key metrics.
Best Practices
- Regularly update the data source to ensure dashboard accuracy.
- Use slicers thoughtfully to avoid over-filtering and losing meaningful insights.
- Create user-specific views for stakeholders with varying data needs.
- Combine dashboard usage with team reviews to foster data-driven culture.
-
Click to Purchases Cardiology Institutes Dashboard in Power BI
FAQs
- How do I update the data in the dashboard? Simply update the data file and connect it with the Power BI file, then click ‘Refresh’ on the Home tab.
- Can I customize the dashboard visuals? Yes, Power BI allows customization of visuals, but starting with this ready-to-use dashboard is recommended.
- Is this dashboard suitable for multiple institutes? Yes, it includes institute-wise analysis perfect for multi-location cardiology centers.
- What versions of Power BI are compatible? This dashboard is compatible with Power BI Desktop and Power BI Service.
Conclusion
The Cardiology Institutes Dashboard in Power BI is an invaluable asset for healthcare administrators and cardiology specialists seeking insightful, up-to-date, and interactive data views. Its intuitive design, combined with powerful analytics features, ensures that cardiology institutes can optimize operations, improve patient outcomes, and achieve financial goals smoothly.
For more detailed guidance and visual walkthroughs, visit Microsoft’s official Power BI site to explore further capabilities of Power BI.
Visit our YouTube channel to watch the demo.
Click to Purchases Cardiology Institutes Dashboard in Power BI