The Career Mentorship Platforms Dashboard in Power BI is a ready-to-use .pbix report that tracks 5 top-level KPIs and 12+ analytical visuals across 5 interactive pages. Whether you operate a career coaching marketplace, manage an internal corporate mentoring program, or consult for EdTech clients, this template gives you a structured Power BI reporting layer without a recurring SaaS subscription. Replace the sample data using Power Query Editor and every visual refreshes automatically through Power BI’s native data engine.
According to Microsoft’s Power BI documentation, Power BI Desktop is a free tool that enables analysts to build interactive reports and share insights across their organizations. This template is fully compatible with Power BI Desktop and requires no paid license to open or use.
Key Features of the Career Mentorship Platforms Dashboard in Power BI
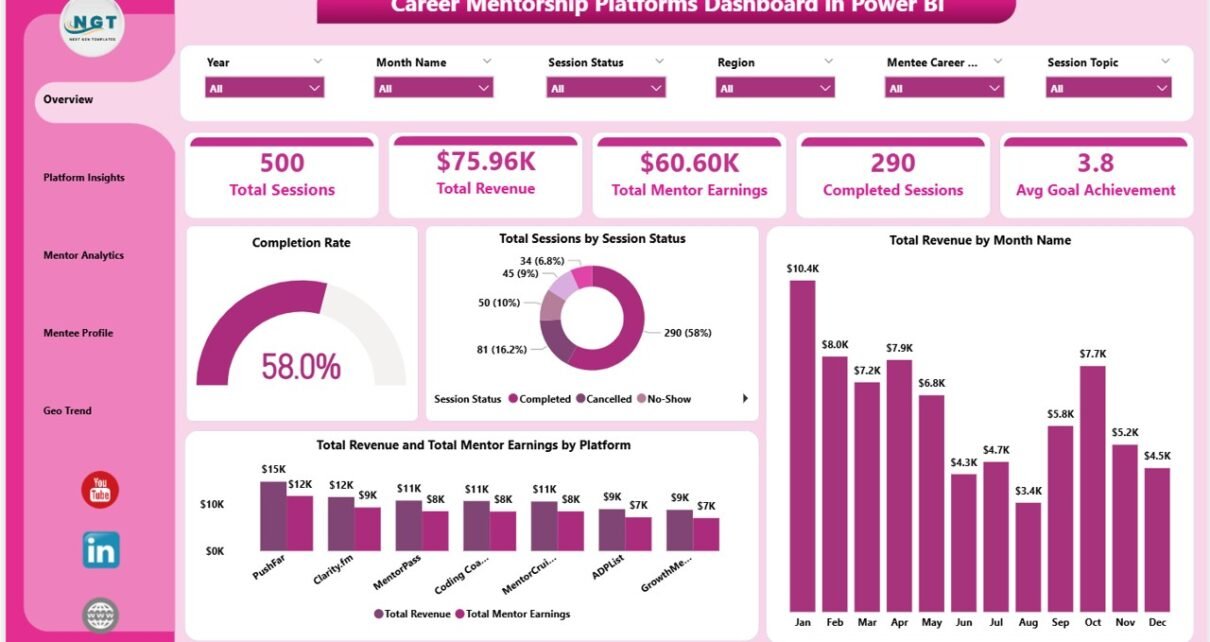
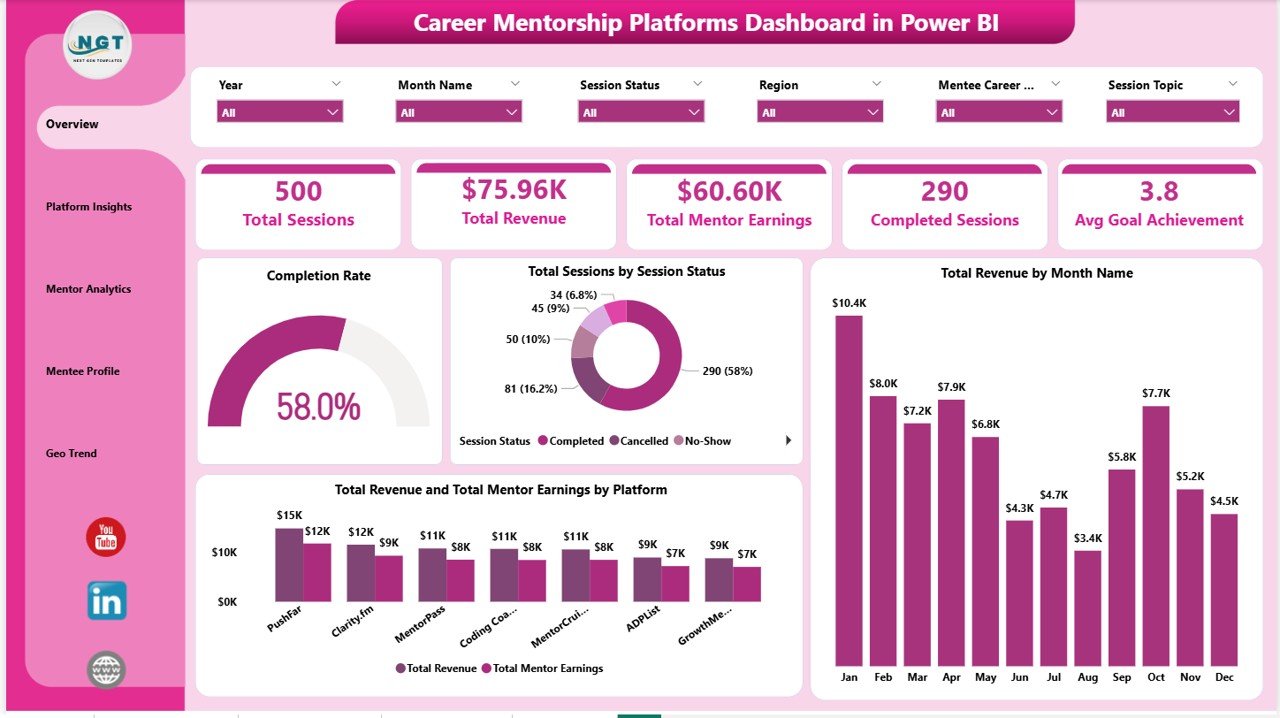
5 KPI Cards on the Overview page display Total Sessions, Total Revenue, Total Mentor Earnings, Completed Sessions, and Avg Goal Achievement in one high-level snapshot that refreshes automatically when you update the underlying data.
5 Analytical Report Pages cover Overview, Platform Insights, Mentor Analytics, Mentee Profile, and Geo Trend. Each page is designed to answer a specific operational question — from subscription plan profitability to geographic session distribution.
12+ Pre-Built Visuals include Completion Rate, Sessions by Session Status, Revenue by Month Name, Revenue and Mentor Earnings by Platform, Revenue by Subscription Plan, Cancellation Rate by Platform, Sessions by Platform, Avg Revenue Per Session by Mentor Level, Total Mentor Earnings by Mentor Level, Revenue by Session Type, Avg Goal Achievement by Mentee Career Stage, Sessions by Mentee Career Stage, Completion Rate by Industry, Revenue by Year, Revenue by Region, and Sessions by Month Name.
Interactive Slicers on every page let you filter by Platform, Session Type, Mentor Level, Subscription Plan, Region, Industry, and Career Stage without writing a single DAX expression.
Power BI Desktop compatible — The .pbix file works with the free Power BI Desktop application. No Pro or Premium license is needed to open and use the template locally.
Dashboard Pages — Detailed Walkthrough
1. Overview Page
The Overview page displays 5 KPI cards alongside 4 chart visuals that give platform operators an instant read on session and revenue health. The Completion Rate gauge shows what percentage of booked sessions reached completion. Total Sessions by Session Status breaks down volume across Completed, Cancelled, and In Progress states. Total Revenue by Month Name reveals seasonal revenue patterns over time. Total Revenue and Total Mentor Earnings by Platform compares platform-level revenue and payout side by side so operators can quickly assess margin at the platform level.
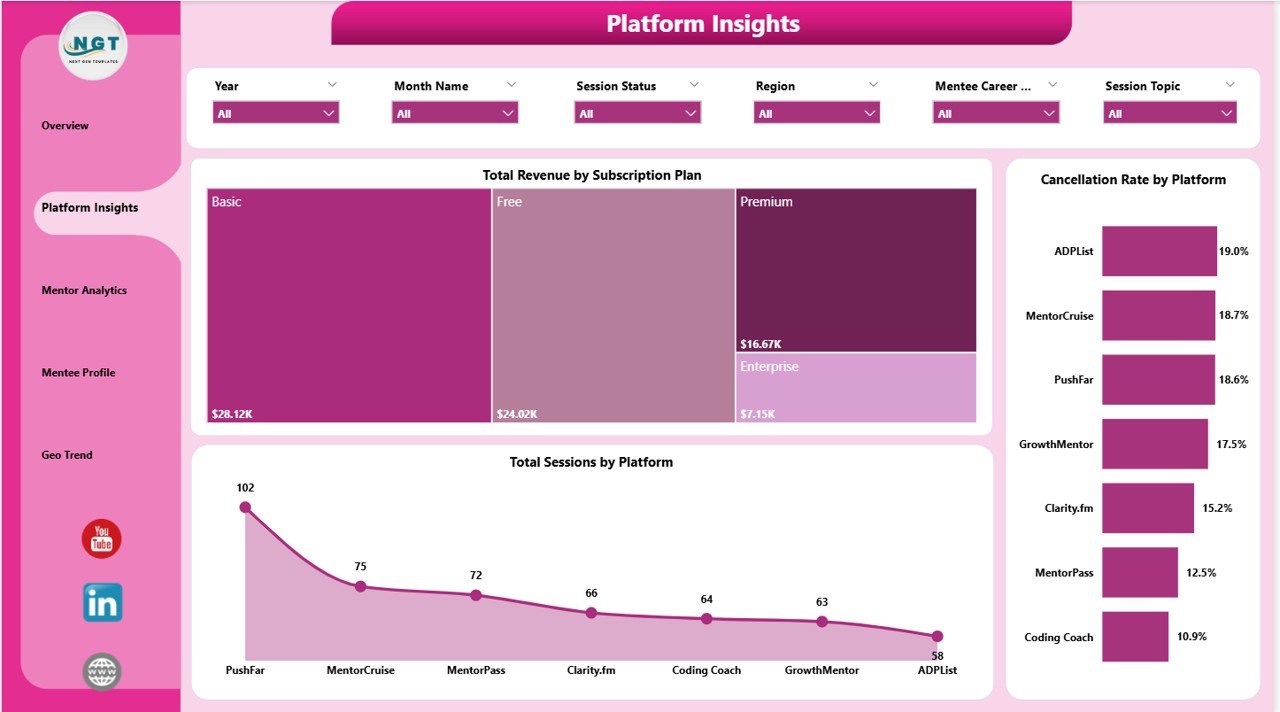
2. Platform Insights
The Platform Insights page drills into platform-level performance across subscription and service dimensions. Total Revenue by Subscription Plan reveals which pricing tiers generate the most income. Cancellation Rate by Platform identifies which platforms have the highest churn risk in booked sessions. Total Sessions by Platform shows absolute session volume by platform, allowing direct comparison of activity levels across different marketplace channels or service lines.
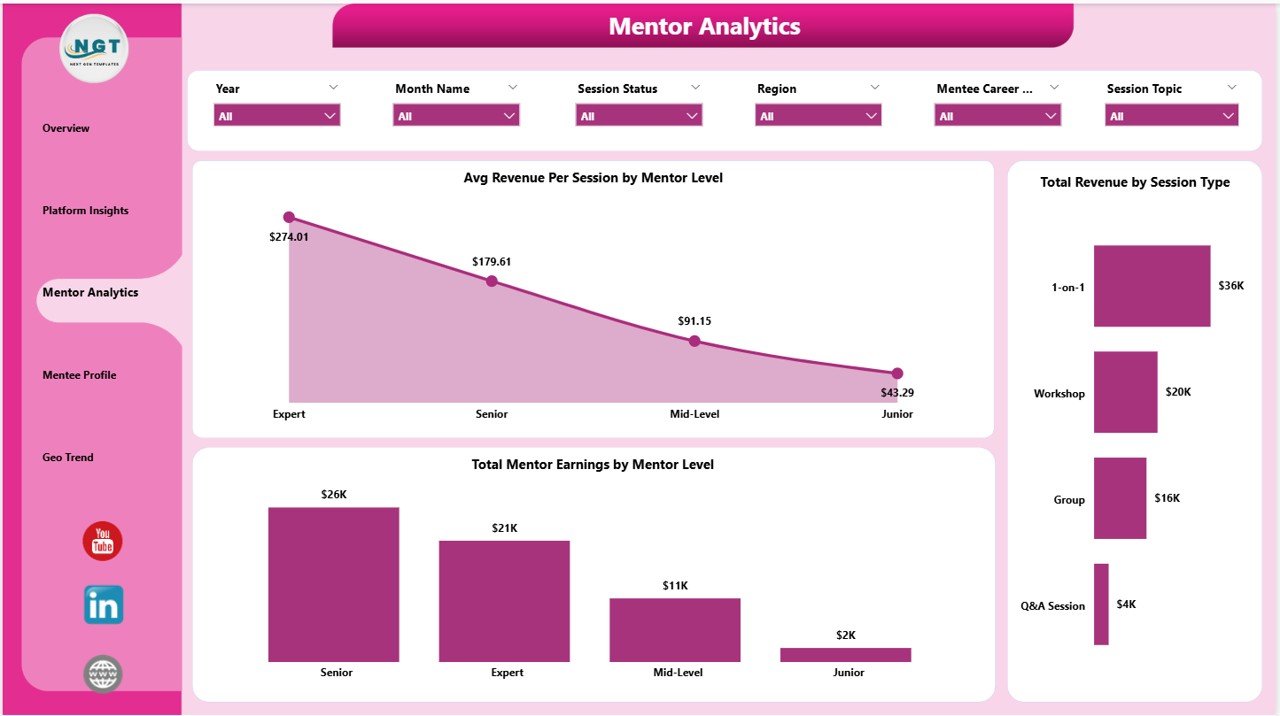
3. Mentor Analytics
The Mentor Analytics page evaluates mentor performance and earnings stratified by experience level and session type. Avg Revenue Per Session by Mentor Level shows how per-session yield differs between junior, mid-level, and senior mentors — a critical input for pricing and mentor incentive decisions. Total Mentor Earnings by Mentor Level compares total payout obligations by tier. Total Revenue by Session Type breaks revenue across session formats such as one-on-one coaching, group sessions, and workshop formats.
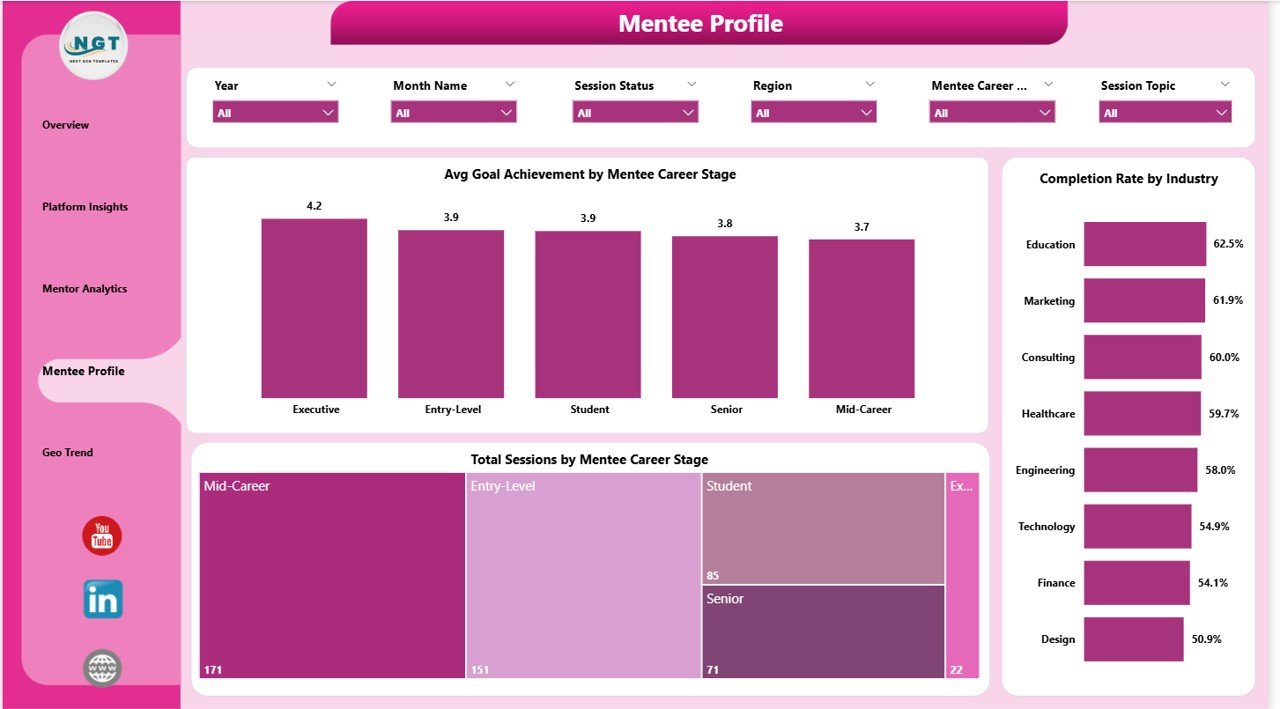
4. Mentee Profile
The Mentee Profile page focuses on the demand side of the platform — who is booking sessions and how well their goals are being met. Avg Goal Achievement by Mentee Career Stage shows whether early-career, mid-career, or senior-level mentees are reaching their stated development goals. Total Sessions by Mentee Career Stage reveals where session volume concentrates across career stages. Completion Rate by Industry shows which sectors have the highest and lowest session completion rates, helping operators prioritize engagement support by industry.
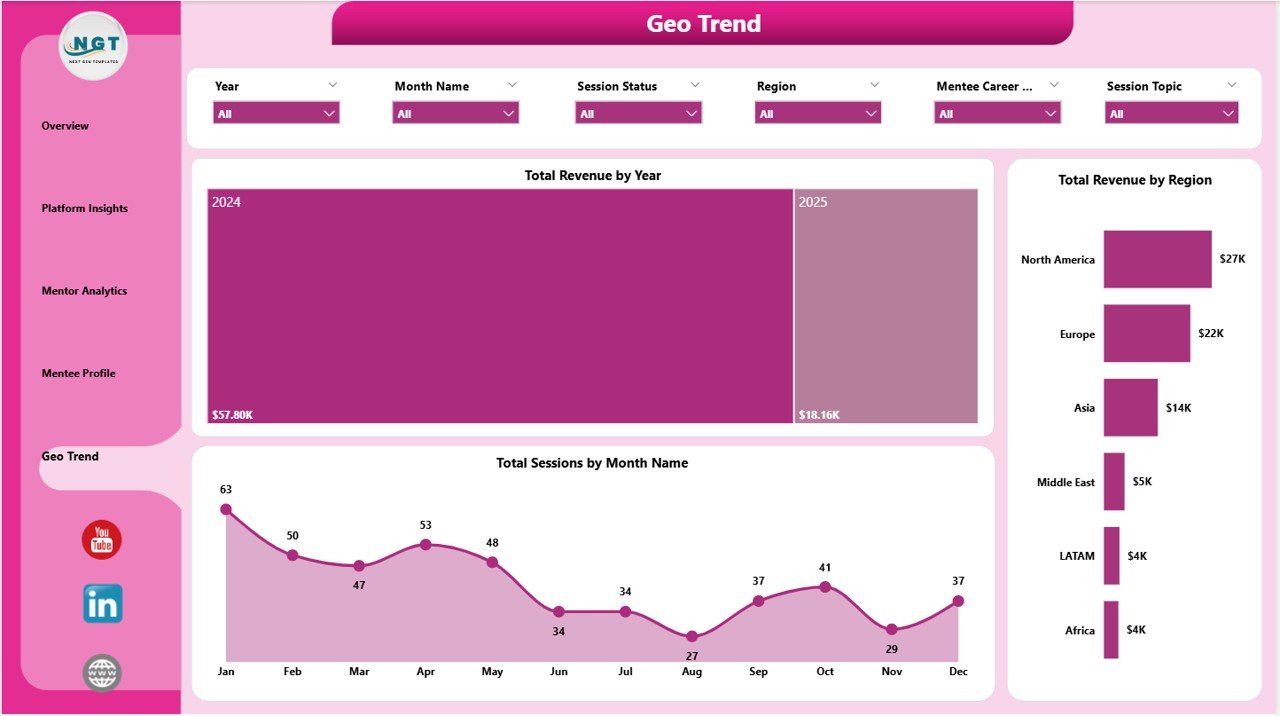
5. Geo Trend
The Geo Trend page maps revenue and session activity across time and geography. Total Revenue by Year shows multi-year revenue growth curves for investor and leadership reporting. Total Revenue by Region identifies the geographic markets where the platform generates the most income. Total Sessions by Month Name surfaces seasonality patterns that can inform staffing, mentor availability, and marketing calendar decisions throughout the year.
Career Mentorship Platforms Dashboard in Power BI vs. Excel vs. SaaS Tools — Where This Fits
| Feature | Power BI Dashboard (This) | Excel Dashboard | MentorcliQ / Together |
|---|---|---|---|
| Cost | $17.99 one-time | $17.99 one-time | $10–25 / user / month |
| Platform | Power BI Desktop (free) | Microsoft Excel | SaaS web app |
| Visual interactivity | Cross-filter, drill-through | Slicer-based filtering | Fixed SaaS dashboards |
| Works offline | Yes (Desktop) | Yes | No |
| Customizable KPIs | Fully editable DAX | Pivot-driven, editable | Fixed vendor metrics |
| Year-1 cost (5 users) | $17.99 total | $17.99 total | $600–1,500+ |
How to Use the Career Mentorship Platforms Dashboard in Power BI
- Download and open — Unzip the file and open the .pbix file in Power BI Desktop (free download from Microsoft at powerbi.microsoft.com).
- Review the data model — The dashboard includes a structured sample dataset with session records, mentor profiles, platform metadata, and geographic fields.
- Replace the sample data — In Power Query Editor (Home > Transform Data), connect your own data source such as Excel, CSV, SQL Server, or SharePoint, or paste records directly into the provided tables.
- Apply slicers — Use the interactive filters on each page to drill into specific platforms, mentor levels, career stages, regions, or time periods.
- Share or export — Export pages as PDF for offline sharing, publish to Power BI Service for team access (Pro license required), or embed into PowerPoint for presentations.
Who Should Use This Template
This Power BI dashboard is built for career coaching platform operators tracking session performance across multiple platforms, HR and L&D teams running internal mentorship programs with 50 to 5,000 participants, EdTech startups and coaching businesses reporting across subscription tiers, Power BI analysts and consultants who need a starting point for client projects, and operations managers who need to present mentorship ROI to leadership using Power BI visuals.
It is not designed for teams that need real-time live API connectors to mentorship CRM platforms, organizations requiring SOC 2-compliant SaaS with SSO and role-based access, or users who do not have access to Power BI Desktop (available as a free download from Microsoft).
Real-World Use Cases
Priya runs operations for a career coaching startup across 3 platforms. She uses the Platform Insights page to compare cancellation rates and subscription plan revenue across platforms, then presents the Geo Trend page to investors to demonstrate regional growth momentum without exporting raw data to Excel first.
Marcus leads L&D at a 500-person technology company. He uses the Mentee Profile page to identify which career stages have the lowest goal achievement scores and brings the data to leadership to justify expanding senior mentor availability for early-career employees.
Ananya is a Power BI consultant who builds reporting dashboards for coaching clients. She uses this template as a starting point, customizes DAX measures and color themes, and delivers branded dashboards in under a day instead of building from scratch each time.
Frequently Asked Questions
What KPIs does the Career Mentorship Platforms Dashboard in Power BI track?
The dashboard tracks Total Sessions, Total Revenue, Total Mentor Earnings, Completed Sessions, and Avg Goal Achievement at the card level. It also includes 12+ chart-level metrics across platform, mentor, mentee, and geographic dimensions.
Do I need a paid Power BI license to use this template?
No. Power BI Desktop is free to download from Microsoft and is sufficient to open, edit, and use this .pbix file. A paid Pro or Premium license is only needed if you want to publish and share reports via Power BI Service.
How do I update the data in the dashboard?
Open Power Query Editor using Home > Transform Data, update your data source connection or paste new records, then click Close & Apply. All visuals refresh automatically without any manual formula editing.
Can I customize the charts and DAX measures?
Yes. All visuals, calculated measures, and calculated columns are fully editable in Power BI Desktop. You can add new report pages, modify existing measures, or connect additional data tables through the data model view.
How does this compare to the Excel version?
Both the Power BI and Excel versions cover the same 5 analytical pages. The Power BI version offers cross-filtering between visuals and native DAX measures, while the Career Mentorship Platforms Dashboard in Excel uses pivot tables and slicers and works entirely offline without any additional software installation.
Is this template compatible with Power BI Service?
Yes. After opening the .pbix file in Power BI Desktop, you can publish it to Power BI Service. A Power BI Pro license or Premium capacity is required for sharing published reports with colleagues.
Download the Career Mentorship Platforms Dashboard in Power BI
Ready to turn mentorship session data into clear Power BI reports? Get instant access to the Career Mentorship Platforms Dashboard in Power BI — 5 pages, 12+ visuals, and interactive slicers included.
➡ Download Career Mentorship Platforms Dashboard in Power BI — $17.99 (Regular $24.99)
Also available: Career Mentorship Platforms Dashboard in Excel | Alumni Engagement KPI Dashboard in Excel | Browse all Power BI Dashboard Templates
Visit our YouTube channel for step-by-step video tutorials
👉 Youtube.com/@PK-AnExcelExpert
Last updated: May 2026