Celebrity merchandising is a fast-moving business. Trends change quickly, fan demand shifts overnight, and product performance can vary from one celebrity category to another. Because of this, businesses need a smart way to track revenue, quantity sold, production cost, and marketing spend in one place.
That is exactly where the Celebrity Merchandising Dashboard in Power BI becomes useful.
Table of Contents
ToggleClick to Purchases Celebrity Merchandising Dashboard in Power BI
Instead of checking multiple reports and scattered spreadsheets, you can view all your key data in a single interactive dashboard. As a result, you can understand what sells well, which region performs best, where your marketing budget goes, and how your production costs affect profit.
In this article, you will learn everything about the Celebrity Merchandising Dashboard in Power BI, including its pages, benefits, features, and best practices. So, if you want to make better decisions and improve merchandising performance, this dashboard can help you do that faster and more accurately.
What Is a Celebrity Merchandising Dashboard in Power BI?
A Celebrity Merchandising Dashboard in Power BI is an interactive reporting tool that helps businesses analyze sales, cost, and marketing data related to celebrity merchandise.
It gives a complete view of merchandising operations through visual reports, KPI cards, and slicers. Because of that, decision-makers can track business performance without wasting time on manual reporting.
This dashboard usually helps you monitor:
- Total Records
- Revenue
- Quantity Sold
- Production Cost
- Marketing Spend
Moreover, it lets you drill down into detailed insights by celebrity category, celebrity name, product category, sales channel, region, month, and order status.
So, whether you sell clothing, accessories, collectibles, or branded fan items, this dashboard can simplify the way you review your business performance.
Why Should You Use a Celebrity Merchandising Dashboard in Power BI?
Managing celebrity merchandise without a proper dashboard can create many problems. For example, you may struggle to compare regional revenue, track which celebrity drives the most sales, or understand how much you spend on marketing versus production.
However, with Power BI, you can solve these challenges more easily.
Here is why businesses use this type of dashboard:
- It combines multiple business metrics into one view.
- It makes data easier to read with charts and visuals.
- It helps teams filter information quickly with slicers.
- It improves decision-making with real-time style insights.
- It shows patterns across regions, products, celebrities, and sales channels.
In other words, the dashboard turns raw merchandising data into clear business intelligence.
What Makes Power BI a Great Choice for Celebrity Merchandising Reporting?
Power BI is one of the best tools for dashboard reporting because it offers flexibility, speed, and strong visual capabilities.
Here are a few reasons why Power BI works so well for merchandising analysis:
1. It Creates Interactive Reports
Power BI allows users to click, filter, and drill into details. Therefore, you do not need to create separate reports for every question.
2. It Handles Large Data Smoothly
Celebrity merchandise businesses often work with a lot of order data. Thankfully, Power BI can handle large datasets and still keep reports fast and useful.
3. It Improves Data Visualization
Instead of reading long tables, users can understand performance through charts, KPI cards, trend visuals, and comparison graphs.
4. It Supports Smart Business Decisions
When you can see revenue, cost, and marketing performance together, you can make smarter pricing, inventory, and campaign decisions.
Click to Purchases Celebrity Merchandising Dashboard in Power BI
What Does the Overview Page Show in the Celebrity Merchandising Dashboard in Power BI?

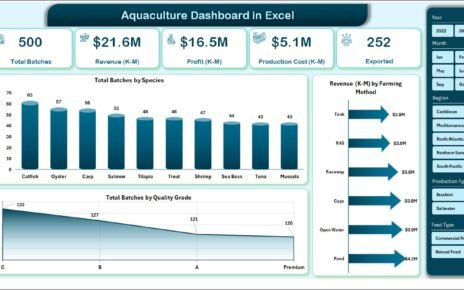
The Overview Page acts as the main summary page of the dashboard. It gives users a high-level snapshot of the overall merchandising business.
At the top of the page, you can see important KPI cards such as:
- Total Records
- Revenue
- Quantity Sold
- Production Cost
- Marketing Spend
These cards help users understand the overall scale and performance of the business in seconds. Because they sit at the top, they give immediate clarity before users move into detailed analysis.
The page also includes multiple slicers. These slicers allow users to apply filters quickly and view the dashboard based on selected conditions. As a result, users can focus only on the data they need.
Which Charts Appear on the Overview Page?
The Overview Page includes the following charts:
1. Revenue by Region
This chart shows how much revenue each region generates. It helps users identify strong and weak markets quickly.
It also makes regional comparison easier. Therefore, businesses can focus more on high-performing regions and improve strategies in low-performing areas.
2. Production Cost by Sales Channel
This chart explains how much production cost connects with each sales channel. It helps users compare which channel requires more operational investment.
It also supports cost control decisions. So, businesses can review whether a specific channel justifies the production cost linked to it.
3. Total Records by Celebrity Category
This visual displays the number of records across different celebrity categories. It helps users understand where transaction volume is highest.
It also reveals which celebrity segments generate the most activity. Because of that, teams can plan product strategy more effectively.
4. Marketing Spend and Revenue by Region
This chart compares marketing spend and revenue side by side for each region. It helps users see whether marketing investment leads to strong revenue returns.
It also supports budget optimization. As a result, businesses can allocate marketing funds more wisely across regions.
How Does the Celebrity Analysis Page Help You?

The Celebrity Analysis page focuses on performance by celebrity category and celebrity name. This section is especially useful when you want to know which celebrities drive the most business value.
Since celebrity merchandising often depends heavily on popularity, fan engagement, and brand image, this page helps businesses study those patterns closely.
Which Charts Appear on the Celebrity Analysis Page?
1. Revenue by Celebrity Category
This chart shows how much revenue each celebrity category generates. It helps businesses find the most profitable segment quickly.
It also supports product planning and promotional strategy. Therefore, teams can invest more in categories that perform well.
2. Production Cost by Celebrity
This visual compares production cost by celebrity. It helps users understand how much it costs to create merchandise for different celebrity names.
It also highlights high-cost celebrity lines. As a result, businesses can review pricing, sourcing, or inventory planning more effectively.
3. Marketing Spend and Revenue by Celebrity Name
This chart compares marketing spend with revenue for each celebrity name. It helps users judge the effectiveness of celebrity-focused campaigns.
It also shows whether heavy marketing produces strong returns. So, businesses can improve campaign decisions and avoid unnecessary spending.
What Can You Learn from the Product Performance Page?

The Product Performance page focuses on how different product categories perform in terms of revenue, production cost, and marketing spend.
This page helps businesses answer a very important question: Which products actually drive the best business results?
That question matters because not every product category performs equally. Some products may sell more but bring lower margins, while others may need more marketing support.
Which Charts Appear on the Product Performance Page?
1. Revenue by Product Category
This chart shows how much revenue each product category generates. It helps users find the top-performing product groups.
It also supports revenue planning. Therefore, businesses can focus on product categories that contribute the most sales value.
2. Production Cost by Product Category
This visual compares production cost across product categories. It helps users identify which products cost more to produce.
It also supports margin improvement decisions. As a result, businesses can review whether high-cost products deserve continued investment.
3. Marketing Spend and Revenue by Product Category
This chart compares marketing spend with revenue for each product category. It helps users understand which categories respond well to promotional efforts.
It also improves marketing planning. So, businesses can shift spending toward product categories that give better returns.
Why Is the Sales Channel Page Important?

The Sales Channel page helps users understand performance across different selling platforms or sales routes. This page matters because celebrity merchandise may sell through websites, retail partners, online marketplaces, or direct campaigns.
When you compare sales channels properly, you can identify which one brings strong results and which one needs improvement.
Which Charts Appear on the Sales Channel Page?
1. Quantity Sold by Region
This chart shows how many units are sold across regions. It helps users understand geographic sales demand clearly.
It also supports supply planning and regional targeting. Therefore, teams can respond better to demand in top-selling locations.
2. Production Cost by Sales Channel
This visual compares production cost for each sales channel. It helps users see which channel connects to higher product costs.
It also improves cost analysis. As a result, businesses can make better decisions about channel strategy and profitability.
3. Marketing Spend and Revenue by Sales Channel
This chart compares marketing spend and revenue for each sales channel. It helps users measure the return on promotional investment by channel.
It also supports smarter budget planning. So, businesses can invest more in channels that deliver stronger revenue performance.
What Insights Does the Revenue Insights Page Provide?

The Revenue Insights page focuses on cost and revenue trends over time and by order status. This page helps users look beyond static totals and understand how performance changes month by month.
That makes it useful for identifying patterns, seasonality, and performance issues.
Which Charts Appear on the Revenue Insights Page?
1. Production Cost by Order Status
This chart shows production cost across different order statuses. It helps users understand how cost connects with completed, pending, or other order stages.
It also supports process review. Therefore, businesses can study whether certain order statuses create unnecessary cost pressure.
2. Revenue by Month Name
This visual displays monthly revenue trends. It helps users see which months bring stronger or weaker sales.
It also supports forecasting and planning. As a result, businesses can prepare better for high-demand and low-demand periods.
3. Production Cost by Month Name
This chart shows how production cost changes month by month. It helps users track cost trends over time.
It also supports cost control strategy. So, businesses can identify unusual increases and take timely action.
What Are the Main Advantages of Celebrity Merchandising Dashboard in Power BI?
Using a Celebrity Merchandising Dashboard in Power BI offers many advantages. Since merchandising businesses deal with many moving parts, a structured dashboard saves time and improves accuracy.
Advantages of Celebrity Merchandising Dashboard in Power BI
- Quick performance tracking
You can monitor key business metrics in seconds without opening multiple reports. - Better decision-making
The dashboard helps you compare revenue, cost, and marketing results clearly. - Improved regional analysis
You can easily identify which regions perform well and where you need stronger action. - Stronger celebrity-based insights
You can measure which celebrity categories and names create the highest value. - Smarter marketing planning
Since the dashboard compares marketing spend with revenue, you can improve budget allocation. - Clear product performance review
You can find the most successful product categories and remove weak performers. - Simple trend analysis
Monthly revenue and production cost charts help you spot patterns faster. - Easy filtering with slicers
Users can apply filters quickly and view only the information they need.
Who Can Benefit from This Dashboard?
This dashboard suits many users across the merchandising and retail business.
It is useful for:
- Merchandising managers
- Sales teams
- Marketing teams
- Brand managers
- E-commerce business owners
- Retail analysts
- Business intelligence teams
- Decision-makers handling celebrity merchandise operations
Because the dashboard is visual and interactive, both technical and non-technical users can understand it easily.
How Can This Dashboard Improve Business Strategy?
A strong dashboard does more than display numbers. It guides better strategy.
For example:
- If one region brings high revenue with low marketing spend, you may increase focus there.
- If a celebrity line costs too much to produce, you may adjust pricing or sourcing.
- If one product category performs weakly, you may reduce inventory and shift attention to better items.
- If a sales channel delivers poor returns, you may optimize or replace it.
Therefore, the dashboard supports faster and better action across the business.
Best Practices for the Celebrity Merchandising Dashboard in Power BI
Click to Purchases Celebrity Merchandising Dashboard in Power BI
To get the best results from this dashboard, you should follow a few smart practices.
1. Keep Your Data Clean
Always use clean and accurate data. If the data has mistakes, the dashboard will also show misleading insights.
2. Update Data Regularly
Frequent updates help users make decisions based on current performance. Therefore, regular refresh schedules matter.
3. Use Filters Wisely
Slicers can make analysis easier, but too many unnecessary filters may confuse users. So, use only the most important ones.
4. Focus on Actionable KPIs
Track metrics that help decision-making, such as revenue, cost, quantity sold, and marketing spend.
5. Compare Cost and Revenue Together
Looking at revenue alone does not tell the full story. Always compare revenue with production cost and marketing spend.
6. Review Monthly Trends
Monthly analysis helps you catch changes early. As a result, you can respond before small issues become large problems.
7. Study Top and Low Performers
Do not focus only on the best results. Also review weak regions, products, and celebrity categories to improve performance.
8. Share the Dashboard with Key Teams
When sales, marketing, and management teams use the same dashboard, everyone works with the same data and same goals.
Why Is This Dashboard a Smart Choice for Growing Merchandise Businesses?
As a merchandising business grows, data also grows. More celebrities, more products, more regions, and more channels create more complexity. Because of that, manual reporting becomes slow and difficult.
A Celebrity Merchandising Dashboard in Power BI solves this problem by giving businesses one structured and interactive reporting system.
It helps users:
- track important KPIs,
- study detailed performance,
- find trends,
- compare business segments,
- and improve overall profitability.
So, if your business wants better visibility and smarter control, this dashboard can become a valuable reporting solution.
Conclusion
The Celebrity Merchandising Dashboard in Power BI is a powerful tool for tracking sales, revenue, production cost, marketing spend, and overall business performance. It transforms raw merchandising data into simple visuals that users can understand quickly.
With pages like Overview, Celebrity Analysis, Product Performance, Sales Channel, and Revenue Insights, this dashboard gives a complete view of merchandising operations. In addition, its slicers and charts make analysis faster, clearer, and more practical.
If you want to understand which celebrity categories perform best, which product groups bring strong revenue, and how your marketing spend impacts results, this dashboard gives you those answers in one place.
In short, it is a smart and practical solution for businesses that want to improve merchandising strategy, control costs, and grow revenue with confidence.
Click to Purchases Celebrity Merchandising Dashboard in Power BI
Frequently Asked Questions with Answers
1. What is a Celebrity Merchandising Dashboard in Power BI?
It is an interactive dashboard that helps users track revenue, quantity sold, production cost, marketing spend, and other merchandising metrics in one report.
2. Why should I use Power BI for celebrity merchandising analysis?
Power BI offers interactive visuals, smart filtering, and easy performance tracking. Therefore, it helps users make better business decisions faster.
3. What KPIs are included in this dashboard?
The main KPIs include Total Records, Revenue, Quantity Sold, Production Cost, and Marketing Spend.
4. What can I analyze in this dashboard?
You can analyze performance by region, celebrity category, celebrity name, product category, sales channel, month, and order status.
5. How does this dashboard help with marketing decisions?
It compares marketing spend with revenue across regions, celebrities, product categories, and sales channels. As a result, users can improve budget planning.
6. Can this dashboard help identify top-performing celebrities?
Yes, the Celebrity Analysis page helps users compare revenue, production cost, and marketing spend by celebrity and celebrity category.
7. Is this dashboard useful for product analysis?
Yes, the Product Performance page helps users evaluate revenue, production cost, and marketing efficiency by product category.
8. Who should use this dashboard?
Business owners, merchandising managers, marketing teams, analysts, and retail decision-makers can all benefit from it.
9. How often should I update the dashboard?
You should update it regularly so that users can make decisions based on current and accurate data.
10. What is the biggest benefit of this dashboard?
The biggest benefit is that it brings all important merchandising insights into one clear, visual, and interactive report.
Visit our YouTube channel to learn step-by-step video tutorials