If your organization is in the middle of a transformation program, you already know how difficult it is to stay on top of everything at once. Change initiatives move at different speeds. Budget overruns go unnoticed. Adoption rates stall without clear tracking. And leadership demands clear, real-time reporting on outcomes.
The Change Agents Office Dashboard in Excel is designed to solve exactly that problem. It is a fully dynamic, pivot-powered, and visually rich Excel workbook that gives change management teams, HR leaders, finance teams, and operations managers one centralized place to monitor every aspect of organizational change.
In this blog post, you will learn what this dashboard includes, how each page works, who benefits from it, and how to use it effectively in your organization.
Click here to Purchase the Change Agents Office Dashboard in Excel
Key Features of Change Agents Office Dashboard in Excel
Before we walk through the individual pages, here is a quick overview of what makes this dashboard stand out from a typical change management spreadsheet.
- Dynamic KPI Cards on the Overview page tracking Total Budget, Total Actual Cost, Total Records, Total Stakeholders, and Total Training Sessions
- Five dedicated analysis pages covering Overview, Department Analysis, Initiative Insights, Adoption Tracking, and Budget Analysis
- Interactive slicers and filters allowing users to slice data by department, initiative type, status, change agent, resistance level, and more
- Structured Data Sheet where all records are maintained in one clean, organized input table
- Support Sheet with pivot tables that power the entire dashboard dynamically behind the scenes
- No coding or advanced Excel skills required — update your data, hit Refresh All, and your dashboard is current
- Professional, presentation-ready design with color-coded indicators and clean visual layouts
Whether you manage five initiatives or fifty, this dashboard scales to match your complexity. It is equally useful for a small internal change program and a large enterprise transformation rollout.
Dashboard Pages Explanation
1. Overview Page
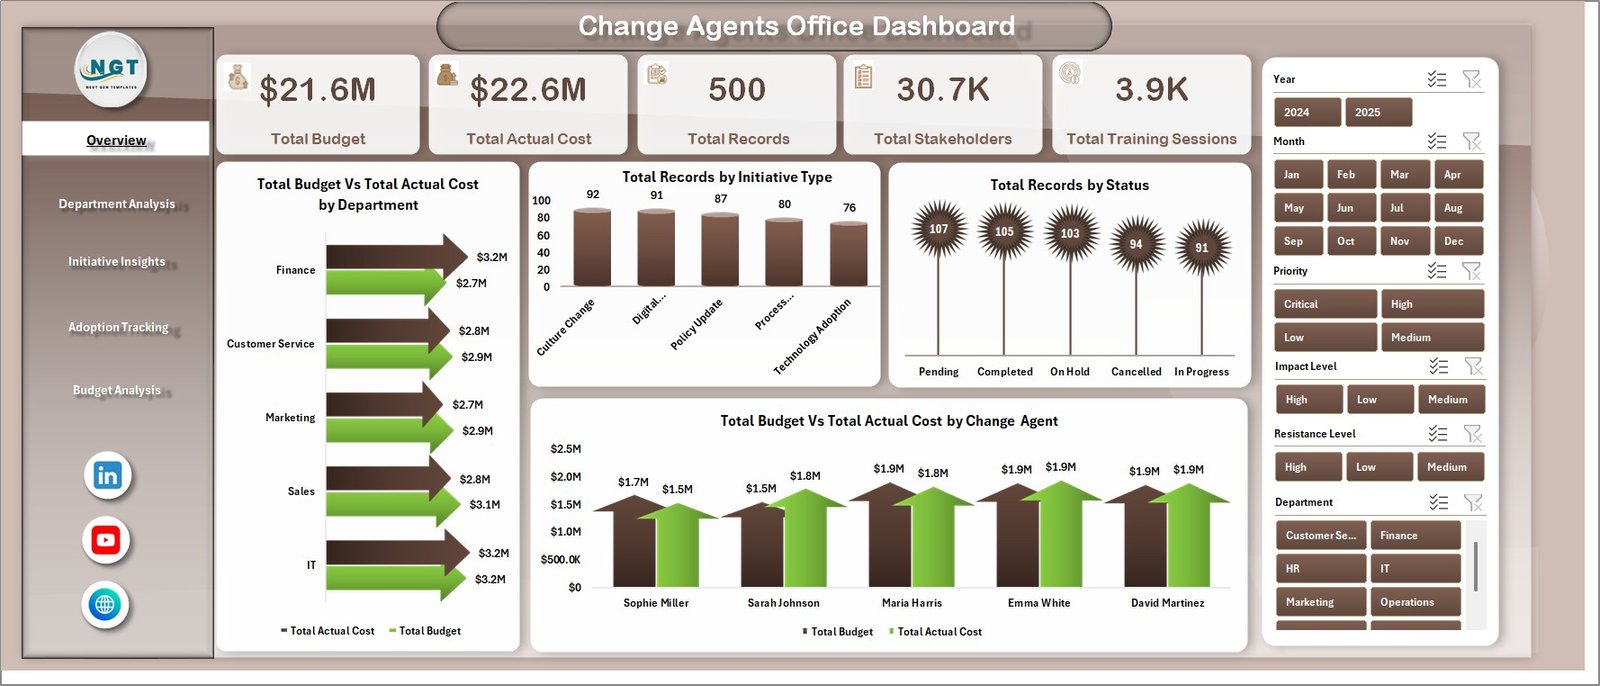
The Overview Page is the command center of the Change Agents Office Dashboard in Excel. It gives leadership and program managers a real-time snapshot of the entire change management landscape without needing to dig through individual reports or spreadsheets.
At the top of this page, you will find high-level KPI cards showing:
- Total Budget
- Total Actual Cost
- Total Records
- Total Stakeholders
- Total Training Sessions
These cards refresh automatically every time you update the data sheet and click Refresh All, ensuring that leadership always sees the most current numbers.
Below the KPI cards, a set of interactive charts provides deeper visual context:
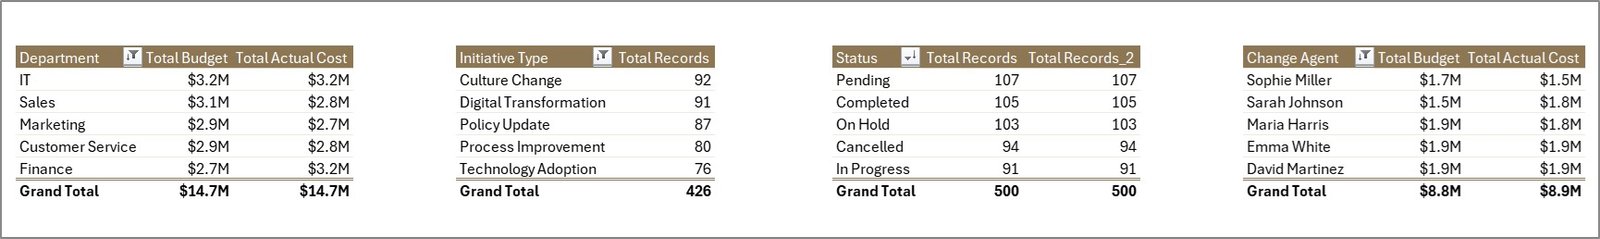
- Total Budget vs Total Actual Cost by Department — Compares planned budget against actual spending for each department, making it easy to spot which teams are over or under budget at a glance.
- Total Records by Initiative Type — Shows the distribution of change records across different initiative types, helping leaders understand where the organization is investing most of its change activity.
- Total Records by Status — Breaks down all initiatives by current status, giving a clear picture of how many are active, completed, on hold, or pending across the program.
- Total Budget vs Total Actual Cost by Change Agent — Reveals individual change agent spending versus their allocated budgets, supporting performance accountability and resource planning.
Multiple slicers allow users to filter the entire page instantly by department, initiative type, or status. This makes the Overview Page highly flexible and suitable for both daily team check-ins and executive-level steering committee reviews.
Change Agents Office Dashboard
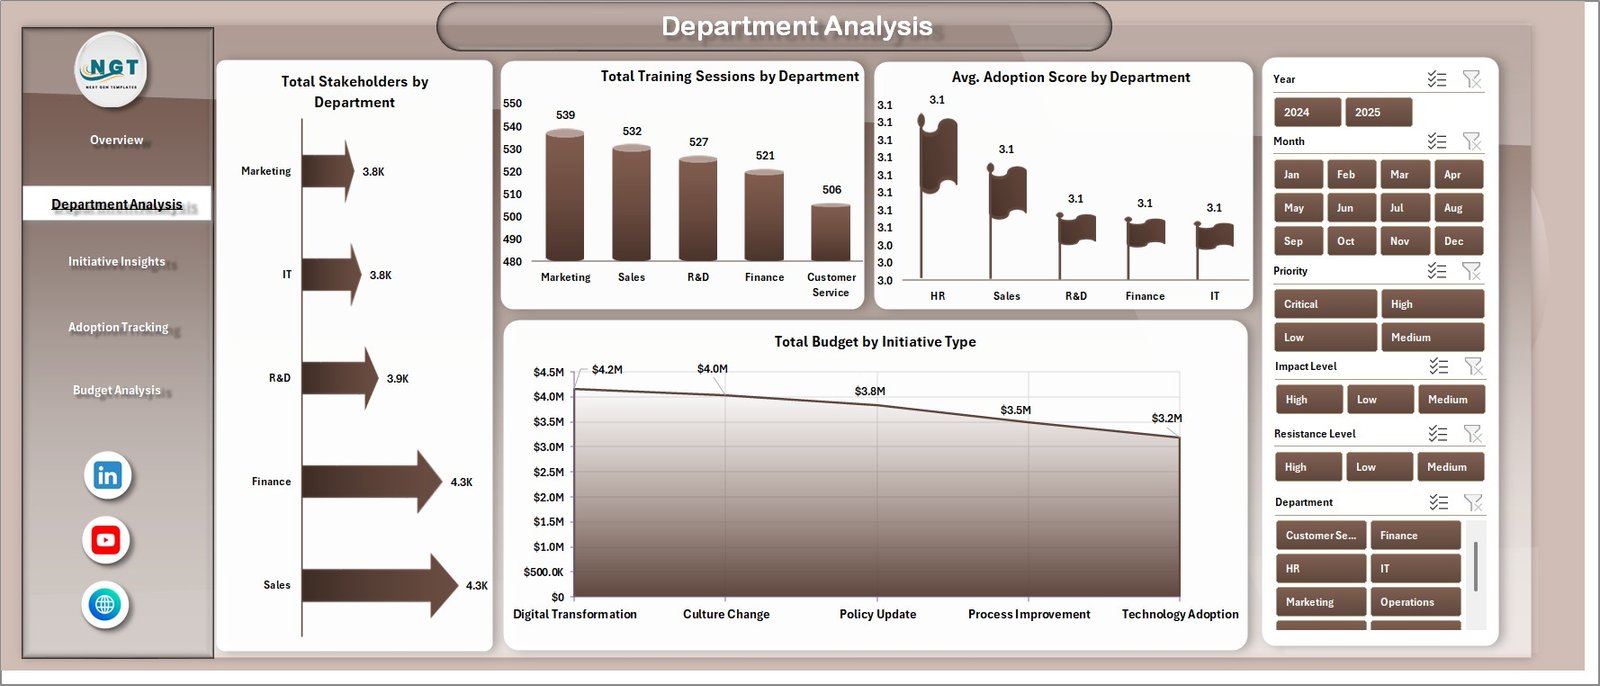
2 — Department Analysis:
In this sheet tab, we have created the various analysis to help you understand how each department is performing across all key dimensions of the change program. This page is especially valuable for HR managers, department heads, and transformation directors who need to track training penetration, stakeholder reach, and adoption progress by business unit.
The charts on this page include:
- Total Stakeholders by Department — Displays how many stakeholders are associated with change initiatives in each department, helping identify which business units have the highest change exposure and communication requirements.
- Total Training Sessions by Department — Tracks the number of training sessions delivered across departments, making it easy to see which teams are being equipped for change and which may need more support.
- Avg. Adoption Score by Department — Shows the average adoption score for each department, providing a quick benchmark for comparing how well different business units are embracing the change program.
- Total Budget by Initiative Type — Breaks down the total allocated budget by initiative type within a department view, helping managers understand how change investment is distributed across program categories.
Department Analysis
3 — Initiative Insights:
In this sheet tab, we have created the various analysis focused on the health, priority, and adoption performance of every individual change initiative. This page is critical for program managers who need to monitor initiative momentum, understand stakeholder distribution, and track monthly adoption trends.
The charts on this page include:
- Total Records by Priority — Shows how change records are distributed across priority levels such as high, medium, and low, helping leaders focus attention on the most critical initiatives first.
- Avg. Adoption Score by Initiative Type — Compares the average adoption score across different initiative types, revealing which types of change efforts are being embraced most effectively by the organization.
- Total Records by Stakeholder Group — Breaks down change records by stakeholder group, making it easy to understand which groups are most impacted and whether engagement efforts are proportionally allocated.
- Adoption Rate % by Month — Tracks the monthly trend in adoption rates over time, helping program teams identify acceleration periods, adoption plateaus, or months that need targeted intervention.
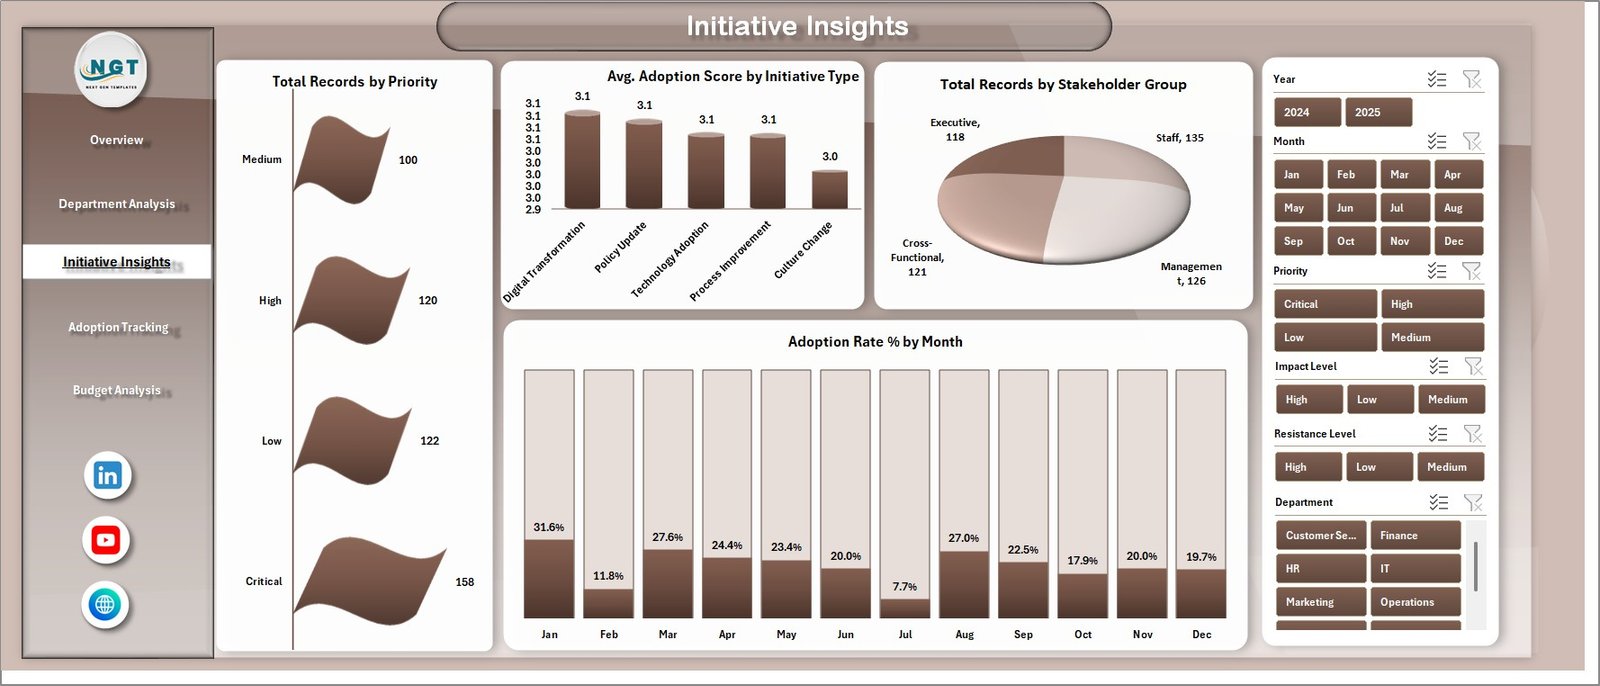
Initiative Insights
4 — Adoption Tracking:
In this sheet tab, we have created the various analysis to measure resistance, communication effectiveness, and adoption quality across the organization. This is often the most overlooked dimension of change management, yet it has the greatest impact on whether transformation initiatives actually succeed.
The charts on this page include:
- Total Records by Resistance Level — Shows how many change records fall into each resistance category, allowing teams to quantify the scale of opposition and tailor engagement strategies accordingly.
- Total Records by Communication Channels — Breaks down records by the communication channels used during change delivery, helping identify which channels are most widely utilized and whether the right mix is being applied.
- Avg. Adoption Score by Impact Level — Compares average adoption scores across different impact levels, revealing whether high-impact initiatives are achieving proportionally stronger adoption or lagging behind lower-impact ones.
- Total Budget vs Total Actual Cost by Month — Tracks planned versus actual spending on a month-by-month basis, making it easy to identify cost escalation trends and take corrective action before overruns accumulate.
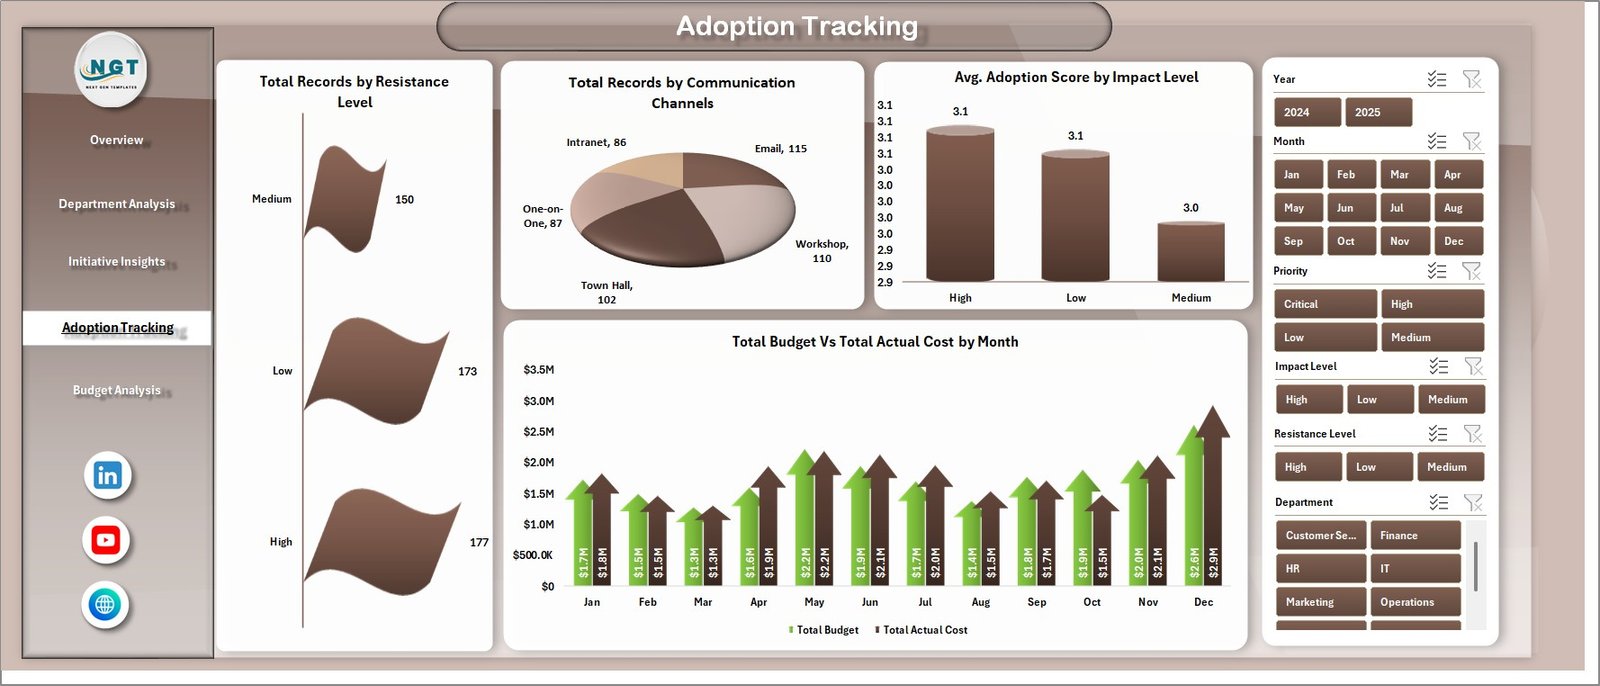
Adoption Tracking
5 — Budget Analysis:
In this sheet tab, we have created the various analysis to keep full control over change program spending. Budget management is one of the most common failure points in change programs, and this page gives finance teams and program directors the visibility they need to stay on track.
The charts on this page include:
- Budget Utilization % by Department — Shows the percentage of allocated budget that each department has consumed, helping identify departments that are significantly over or under-utilizing their change resources.
- Budget Utilization % by Initiative Type — Compares budget utilization rates across different types of change initiatives, enabling program teams to assess whether certain initiative categories consistently overspend or underspend.
- Total Actual Cost by Change Agent — Displays the total real spend associated with each change agent, supporting accountability reviews and helping program managers identify agents who may need better resource planning support.
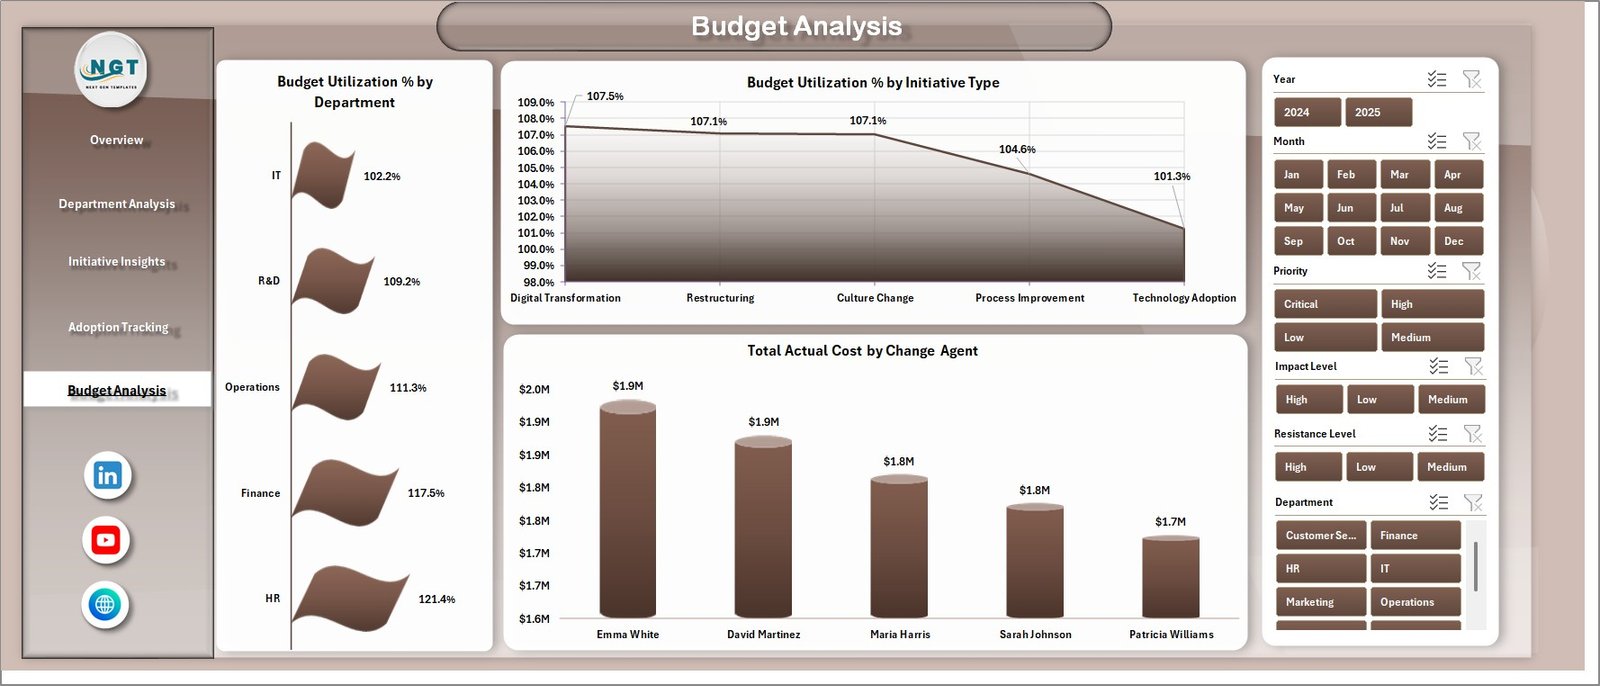
Budget Analysis
6 — Data Sheet Tab
This is the Data sheet. Here you need to add the data in the same format. Each row represents one change record — an initiative, training session, stakeholder interaction, or budget entry — depending on how your organization structures its tracking data.
Simply update the data in this sheet, then go to the Data tab in the Excel ribbon and click Refresh All. All pivot tables, charts, and KPI cards will update automatically across every dashboard page.
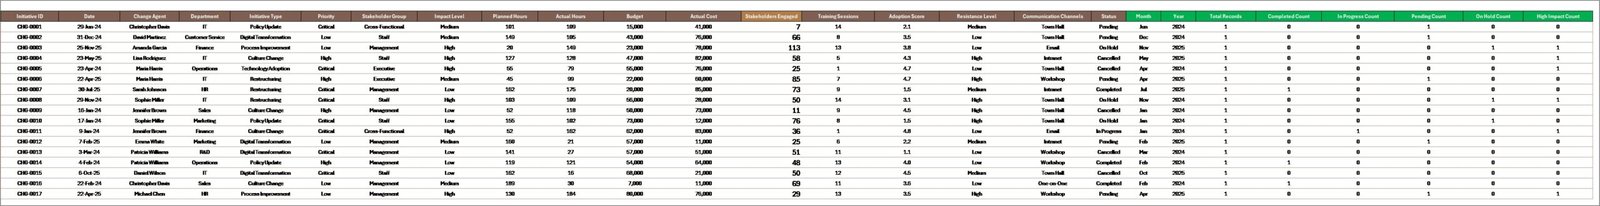
Data Sheet tab
7 — Support Sheet
In this sheet we have created multiple pivot tables to create the entire dashboard dynamically. You can go to the Data tab in the Excel Ribbon and click on Refresh All after updating the data in the data sheet. All the pivots will be refreshed and all the charts will be refreshed. You can keep this sheet hidden when presenting to leadership or stakeholders.
Support sheet tab
Advantages of Change Agents Office Dashboard in Excel
- Centralized Visibility — All change management data lives in one workbook, eliminating the need to chase updates across multiple spreadsheets and email threads
- Real-Time Budget Control — Budget vs Actual Cost comparisons by department, agent, and month keep financial performance visible at all times
- Adoption Rate Tracking — Monthly adoption trends and score comparisons by department and initiative type ensure teams can act on adoption gaps before they become program failures
- Resistance Management — Resistance level analytics allow teams to quantify and address pushback proactively rather than reactively
- Stakeholder Reach Analysis — Training session and stakeholder counts by department confirm whether change communications and enablement are reaching the right people
- Board-Ready Reporting — The professional design makes it easy to share dashboard pages directly with executives and steering committees
- No Software License Required — The entire dashboard runs in Microsoft Excel, a tool most organizations already have and their teams already know
Opportunities for Improvement
- Connect the dashboard to a shared network drive or SharePoint so multiple team members can update data simultaneously
- Add conditional formatting rules to automatically flag departments with budget utilization above 100% or adoption scores below target thresholds
- Integrate a risk register column in the data sheet to track change risks alongside initiative and adoption metrics
- Create a print-optimized summary view for PDF export to simplify distribution to stakeholders who prefer printed reports
- Add a change readiness score column to the data sheet so readiness can be tracked alongside adoption rate trends over time
Best Practices
- Update data weekly — Change programs move fast. Weekly data updates keep your budget, adoption, and initiative status metrics current and meaningful
- Use slicers during reviews — When presenting to department heads or steering committees, use slicers to isolate one department or initiative type at a time for more focused discussions
- Monitor resistance early — Begin capturing resistance level data from the first week of rollout to establish a baseline you can track improvements against over time
- Review budget utilization monthly — The Budget Analysis page is most powerful when reviewed at a fixed monthly cadence, allowing finance teams to spot trends before they become overruns
- Keep the Support Sheet hidden — Hiding the pivot table sheet during presentations creates a cleaner, more professional experience for your audience
- Standardize data entry formats — Enforce consistent naming conventions for departments, change agents, initiative types, and stakeholder groups to prevent mismatched filters and inaccurate chart results
Explore Relevant Templates
If you are looking for more templates to support your organizational management and analytics needs, here are some additional resources available on NextGenTemplates.com:
- Excel Dashboard Templates — Browse the full collection of Excel dashboards for every business function
- Excel KPI Dashboard Templates — Specialized KPI tracking dashboards for HR, finance, operations, and more
- City Gas Distribution Dashboard in Excel — A detailed operational dashboard for tracking gas distribution performance
- City Gas Distribution Dashboard in Power BI — The Power BI version for organizations using Microsoft’s BI platform
FAQs
What is the Change Agents Office Dashboard in Excel?
It is a pre-built, dynamic Excel workbook that helps organizations track change initiatives, monitor budget versus actual costs, measure stakeholder engagement, and analyze adoption rates — all in one place across five dedicated dashboard pages.
What KPI cards are on the Overview page?
The Overview page displays five KPI cards: Total Budget, Total Actual Cost, Total Records, Total Stakeholders, and Total Training Sessions. These update automatically whenever you refresh the pivot tables after updating your data.
Do I need advanced Excel skills to use this dashboard?
No. The dashboard is designed for everyday users. You enter your data in the Data Sheet, click Refresh All on the Data tab, and all charts and KPI cards update automatically. No formulas or coding are required.
Which version of Excel does this dashboard support?
The dashboard is compatible with Microsoft Excel 2016 and later, including Office 365 and Excel for Microsoft 365. It is optimized for desktop use and may have limited functionality on mobile or browser-based versions of Excel.
Can I customize the dashboard for my organization?
Yes. The workbook is fully editable. You can add new columns to the Data Sheet, modify chart titles, adjust slicer options, and update color schemes to match your organization’s branding.
Is this dashboard suitable for small teams as well as large enterprises?
Yes. The dashboard works equally well for small internal change programs with a handful of initiatives and large enterprise transformation programs involving hundreds of records, agents, and stakeholders. The slicer and filter system adapts to whatever volume of data you feed it.
Conclusion
Change management is one of the most complex challenges any organization faces. Tracking budget against actual costs, measuring adoption rates month over month, understanding resistance levels, and reporting on initiative priorities — all at the same time — is a significant operational burden without the right tools.
The Change Agents Office Dashboard in Excel gives you a practical, accessible, and professionally designed solution. With five focused analysis pages, dynamic KPI cards for budget, cost, records, stakeholders, and training sessions, interactive slicers, and a clean data entry structure, it provides the visibility and control your program needs to succeed.
Whether you are a change management consultant, an HR transformation leader, an operations manager, or a project director, this dashboard will save you hours of manual reporting every week and give your leadership team the clarity they need to make confident decisions.
Click here to Purchase the Change Agents Office Dashboard in Excel
Visit our YouTube channel to learn step-by-step video tutorials
For additional learning resources on Excel dashboards and change management best practices, visit Microsoft Excel Support.