The chemical manufacturing industry operates in a highly competitive, cost-sensitive, and compliance-driven environment. Every decision depends on accurate data related to production, energy usage, quality, safety, and profitability. However, when data remains scattered across spreadsheets and systems, teams struggle to gain clarity.
That is exactly where a Chemical Manufacturing Dashboard in Power BI becomes essential.
This powerful, interactive dashboard transforms raw manufacturing data into meaningful insights. It helps decision-makers track performance, reduce cost, improve quality, and maintain regulatory compliance. In this detailed guide, you will learn what a Chemical Manufacturing Dashboard in Power BI is, why it matters, how it works, its key features, advantages, best practices, and frequently asked questions.
Click to buy Chemical Manufacturing Dashboard in Power BI
What Is a Chemical Manufacturing Dashboard in Power BI?
A Chemical Manufacturing Dashboard in Power BI is a centralized analytical solution designed to monitor key performance indicators (KPIs) across chemical production operations. It converts complex operational data into visual reports that are easy to understand and act upon.
Instead of relying on manual reports, chemical manufacturers can use Power BI to:
- Monitor revenue and gross margin
- Track energy consumption and utility costs
- Analyze batch cost and defect impact
- Measure quality, yield, and compliance metrics
- Identify production inefficiencies
- Monitor safety incidents
Because Power BI offers interactive visuals, slicers, and drill-down capabilities, teams gain instant access to insights at plant, product, and process levels.
Why Do Chemical Manufacturers Need a Power BI Dashboard?
Chemical manufacturing involves high raw material costs, strict safety regulations, and energy-intensive processes. Therefore, even small inefficiencies can lead to major losses.
A Chemical Manufacturing Dashboard in Power BI helps organizations:
- Improve profitability through margin analysis
- Reduce waste and defects
- Optimize energy and utility usage
- Ensure compliance with quality standards
- Enhance operational transparency
- Support data-driven decision-making
Moreover, leadership teams gain real-time visibility into performance instead of waiting for static reports.
How Does a Chemical Manufacturing Dashboard in Power BI Work?
The dashboard pulls data from structured sources such as Excel, ERP systems, MES systems, or databases. Once the data flows into Power BI, it undergoes transformation and modeling.
After that, the dashboard presents KPIs using:
- Cards for high-level metrics
- Bar and column charts for comparisons
- Line charts for trends
- Tables for detailed analysis
Users can filter data by product, plant, process type, month, or category. As a result, teams explore insights dynamically without technical expertise.
Key Pages of the Chemical Manufacturing Dashboard in Power BI
This dashboard contains five professionally designed pages, each focused on a critical operational area.
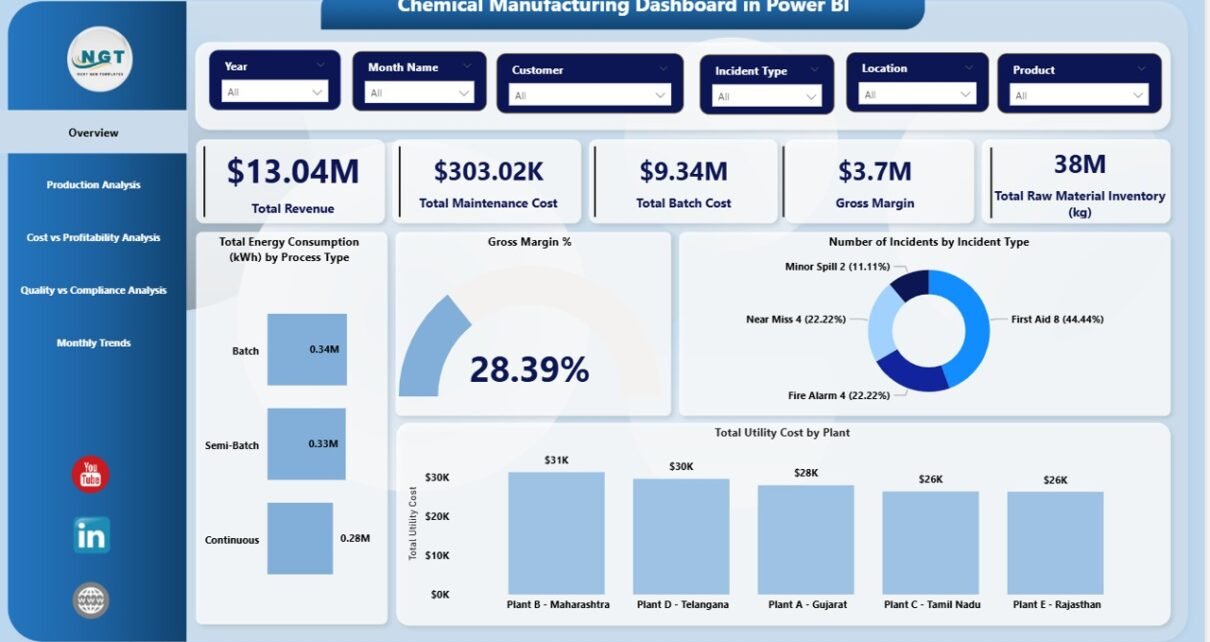
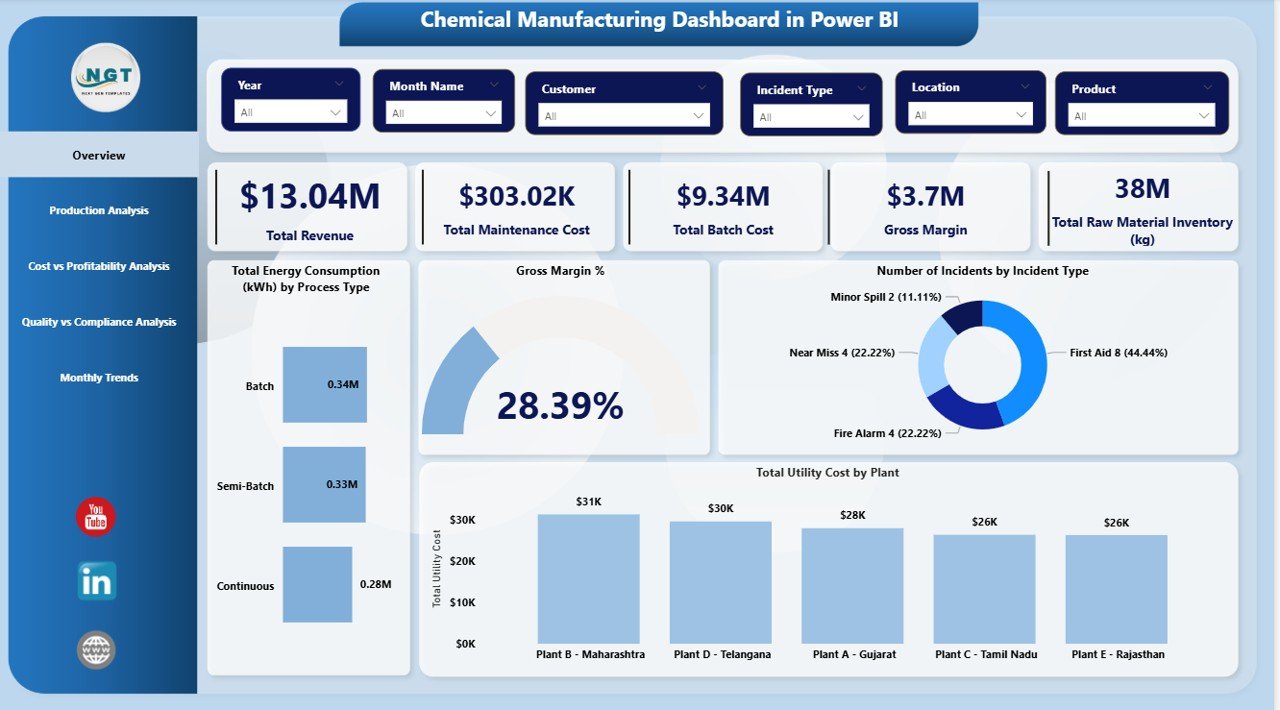
Overview Page: How Is the Overall Performance?
The Overview page provides a snapshot of the entire chemical manufacturing operation. It allows leadership teams to understand performance at a glance.
Key Metrics on the Overview Page
- Revenue
Displays total revenue generated from chemical products. - Maintenance Cost
Shows spending on equipment and plant maintenance. - Total Batch Cost
Represents the total cost incurred for production batches. - Gross Margin
Highlights profitability after deducting production costs. - Inventory – Raw Materials (kg)
Tracks available raw material stock levels. - Gross Margin %
Displays profit efficiency as a percentage.
Operational & Safety Insights
- Energy Consumption (kWh) by Process Type
Helps identify energy-intensive processes. - Utility Cost by Plant
Compares utility spending across plants. - Number of Incidents by Incident Type
Supports safety monitoring and risk management.
Because this page consolidates high-level KPIs, decision-makers can act quickly.
Click to buy Chemical Manufacturing Dashboard in Power BI
Production Analysis Page: How Efficient Is Production?
The Production Analysis page focuses on operational efficiency and sustainability.
Key Visuals in Production Analysis
- Gross Margin % by Production Line
Identifies the most profitable production lines. - Revenue by Product Family
Shows revenue contribution from different product families. - Average Yield % by Product
Helps detect yield loss and improvement areas. - CO₂e Emissions (kg) by Product Category
Supports environmental impact analysis.
This page enables production managers to balance profitability, yield, and sustainability goals.

Click to buy Chemical Manufacturing Dashboard in Power BI
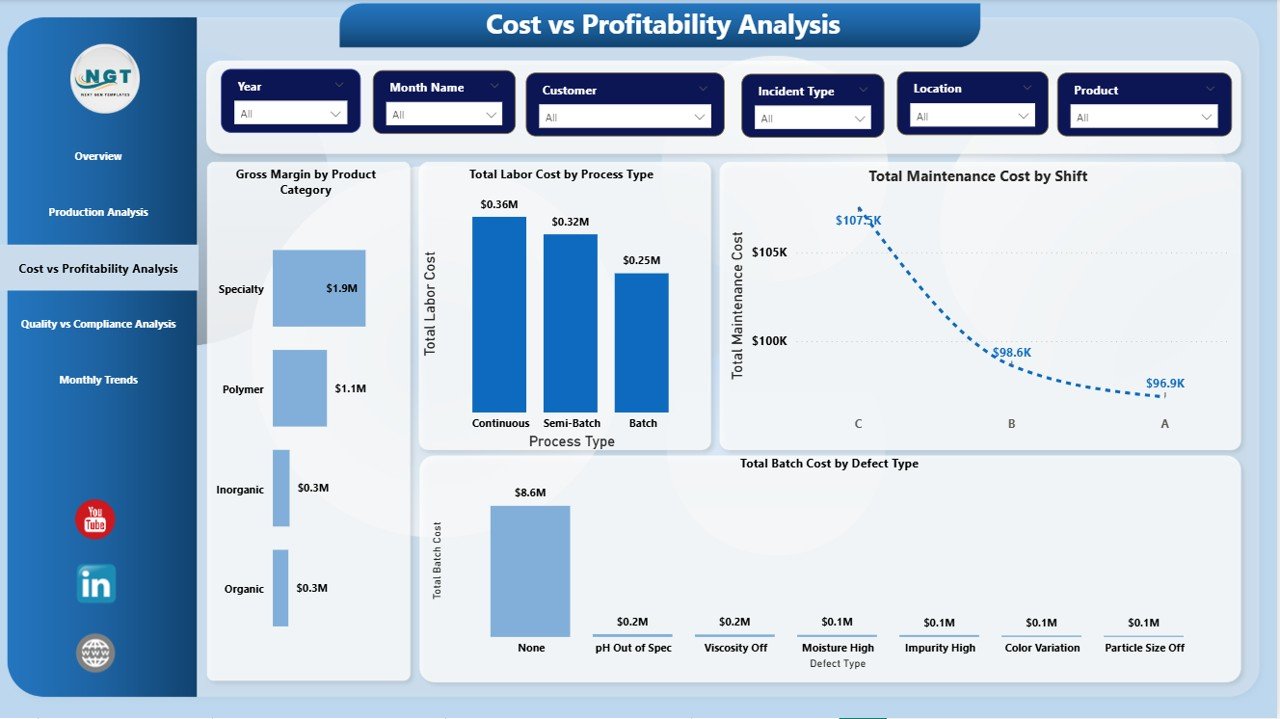
Cost vs Profitability Analysis Page: Where Does the Money Go?
Cost control plays a critical role in chemical manufacturing. Therefore, the Cost vs Profitability Analysis page delivers deep insights into cost drivers.
Key Cost & Profitability Metrics
- Gross Margin by Product Category
Highlights profitable and low-margin products. - Total Batch Cost by Defect Type
Identifies cost impact of defects and rework. - Labor Cost vs Utility Cost by Process Type
Compares human and energy cost components.
Because this page connects cost with profitability, finance and operations teams can collaborate more effectively.
Click to buy Chemical Manufacturing Dashboard in Power BI
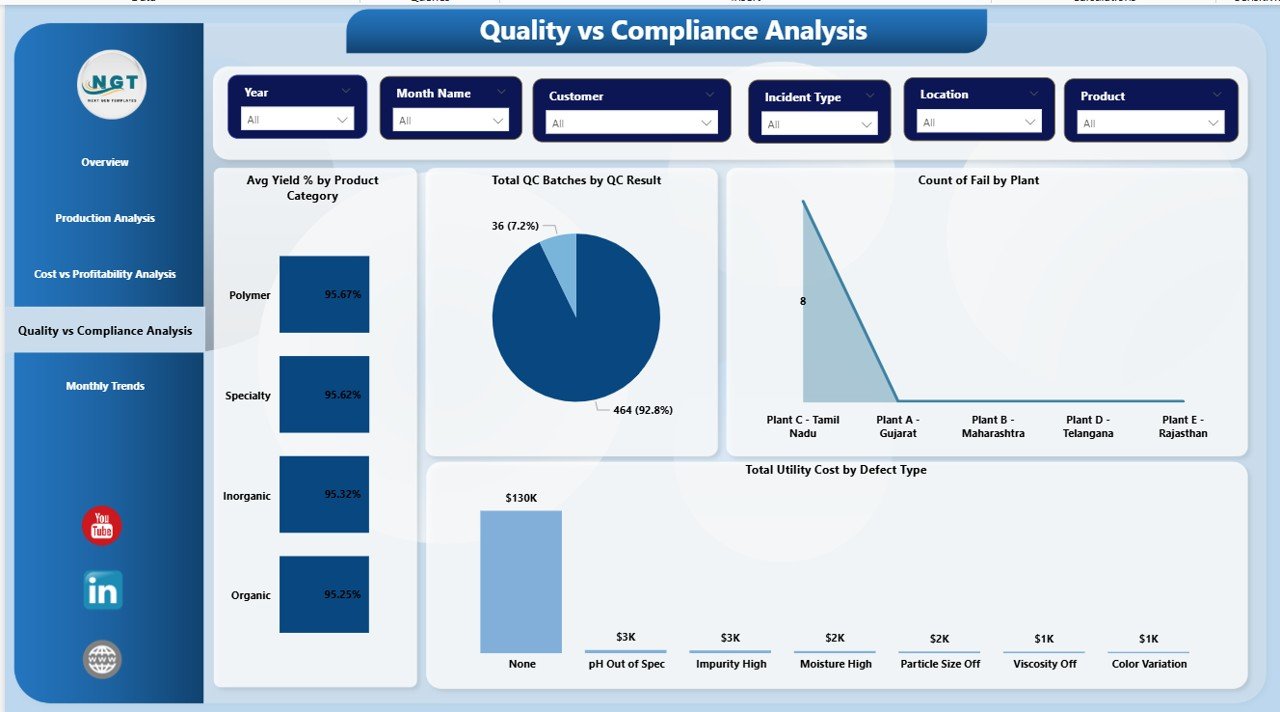
Quality vs Compliance Analysis Page: Are Standards Being Met?
Quality and compliance remain non-negotiable in chemical manufacturing. The Quality vs Compliance Analysis page focuses on maintaining high standards.
Quality & Compliance KPIs
- Yield % by Product Category
Measures output quality and efficiency. - Quality Check Analysis
Evaluates pass and fail trends. - Count of Fail in QC by Plant
Highlights plants with quality issues. - Count of Defects by Defect Type
Identifies recurring quality problems.
With these insights, quality teams can prevent compliance risks and improve process stability.
Click to buy Chemical Manufacturing Dashboard in Power BI
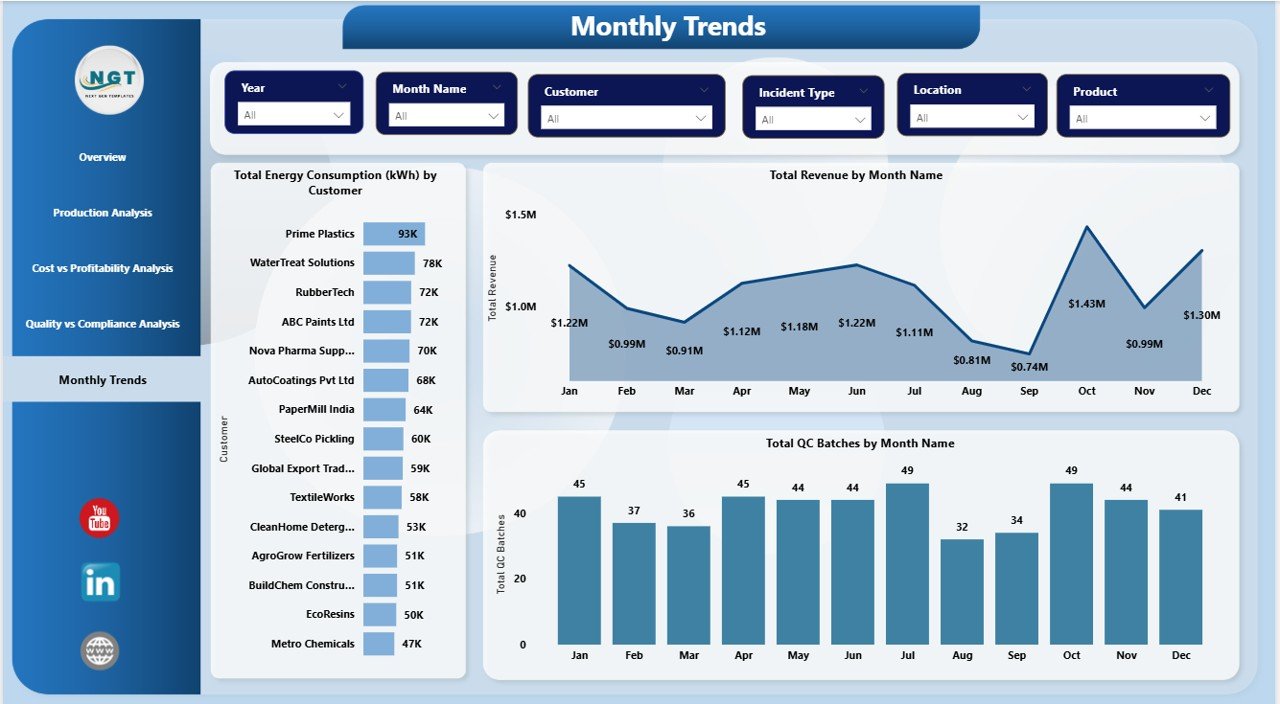
Monthly Trends Page: How Is Performance Changing Over Time?
Trend analysis plays a crucial role in strategic planning. Therefore, the Monthly Trends page tracks performance across time.
Monthly Trend Visuals
- Energy Consumption (kWh) by Month Name
Identifies seasonal energy patterns. - Revenue vs Gross Margin by Month Name
Highlights profitability trends. - Total QC Batch by Month Name
Shows quality workload trends.
This page helps leadership forecast demand, plan resources, and improve budgeting accuracy.
Click to buy Chemical Manufacturing Dashboard in Power BI
Advantages of Chemical Manufacturing Dashboard in Power BI
A Chemical Manufacturing Dashboard in Power BI delivers measurable benefits across departments.
Operational Advantages
- Improves visibility across production, quality, and cost
- Identifies inefficiencies quickly
- Reduces manual reporting effort
Financial Advantages
- Enhances gross margin tracking
- Supports cost optimization
- Improves profitability analysis
Quality & Compliance Advantages
- Reduces defect rates
- Improves audit readiness
- Enhances quality monitoring
Strategic Advantages
- Enables data-driven decision-making
- Supports sustainability goals
- Improves cross-functional collaboration
Opportunities for Improvement Using the Dashboard
Even mature chemical operations can unlock further value using this dashboard.
Key Improvement Opportunities
- Optimize energy-intensive processes
- Reduce defect-driven batch cost
- Improve yield consistency
- Strengthen safety incident monitoring
- Enhance sustainability tracking
Because Power BI supports scalability, organizations can continuously add new KPIs and visuals.
Best Practices for the Chemical Manufacturing Dashboard in Power BI
To maximize dashboard value, teams should follow proven best practices.
Use Clean and Structured Data
Always maintain consistent data formats and naming conventions.
Focus on Actionable KPIs
Select KPIs that directly influence cost, quality, safety, and profitability.
Keep Visuals Simple
Avoid clutter. Use clear charts and meaningful color coding.
Enable Drill-Down Capabilities
Allow users to explore data from summary to detail.
Review KPIs Regularly
Update KPIs as business goals evolve.
Who Can Use a Chemical Manufacturing Dashboard in Power BI?
This dashboard supports multiple roles within an organization:
- Plant Managers
- Production Managers
- Quality Assurance Teams
- Safety Officers
- Finance & Cost Controllers
- Sustainability Teams
- Executive Leadership
Because Power BI offers role-based access, each user sees relevant insights.
How Does This Dashboard Support Sustainability Goals?
Sustainability remains a top priority in chemical manufacturing. This dashboard supports sustainability by:
- Tracking CO₂e emissions
- Monitoring energy consumption
- Identifying waste-heavy processes
- Supporting regulatory reporting
As a result, organizations align profitability with environmental responsibility.
Conclusion: Why Should You Use a Chemical Manufacturing Dashboard in Power BI?
A Chemical Manufacturing Dashboard in Power BI empowers organizations to move from reactive reporting to proactive decision-making. It delivers real-time insights into revenue, cost, quality, energy, and compliance.
Because the dashboard integrates data across operations, finance, and quality, teams gain a single source of truth. As a result, organizations improve efficiency, reduce cost, enhance quality, and achieve sustainable growth.
If you want complete visibility and control over chemical manufacturing performance, this dashboard becomes a must-have solution.
Frequently Asked Questions (FAQs)
- What is the main purpose of a Chemical Manufacturing Dashboard in Power BI?
The main purpose is to provide real-time insights into production, cost, quality, safety, and profitability using interactive visuals.
- Can this dashboard handle large manufacturing datasets?
Yes. Power BI handles large datasets efficiently when data modeling follows best practices.
- Does this dashboard support multiple plants?
Yes. Users can filter and compare data across multiple plants and production lines.
- Can organizations customize KPIs in this dashboard?
Absolutely. Power BI allows easy customization of KPIs and visuals based on business needs.
- How often should data be refreshed?
Most organizations refresh data daily or weekly, depending on operational needs.
- Is Power BI suitable for compliance reporting?
Yes. Power BI supports audit-ready reporting with traceable data sources.
- Does this dashboard help reduce manufacturing cost?
Yes. By highlighting cost drivers and inefficiencies, it supports proactive cost reduction.
Visit our YouTube channel to learn step-by-step video tutorials
Watch the step-by-step video tutorial:
Click to buy Chemical Manufacturing Dashboard in Power BI