Circular Economy Startups Dashboard in Excel is a comprehensive analytics solution designed specifically for sustainability-focused startups and organizations embracing the circular economy model. If you are managing a green startup, advising eco-innovation companies, or tracking sustainability KPIs for impact investing purposes, this ready-to-use Excel dashboard transforms complex environmental and operational data into clear visual insights that drive smarter business decisions.
Click here to Purchase the Circular Economy Startups Dashboard in Excel
In a world where environmental responsibility is becoming a core business differentiator, startups operating in the circular economy need reliable tools to measure their progress. This dashboard provides exactly that — a centralized performance monitoring hub where every key sustainability metric is just a click away.
Key Features of Circular Economy Startups Dashboard in Excel
The Circular Economy Startups Dashboard in Excel comes packed with powerful features that make sustainability tracking effortless and insightful for teams of any size.
- Interactive Multi-Page Dashboard — Five dedicated analysis pages cover every angle of circular economy performance, from high-level overviews to deep-dive regional breakdowns.
- Dynamic Slicer Filters — Instantly filter your entire dashboard by startup name, material category, geographic region, time period, or business model type.
- Automated Pivot Table Engine — Every chart and KPI card is driven by Excel pivot tables that refresh automatically with a single click after updating your raw data.
- Professional KPI Cards — High-level metrics including Total Revenue, Waste Diverted, Recycling Rate, Carbon Savings, Active Startups, and Resource Recovery Rate are displayed in visually appealing card layouts.
- No Macros or VBA Required — The dashboard runs entirely on native Excel formulas, pivot tables, and conditional formatting, making it compatible with Excel 2016 and later.
- Fully Customizable — Modify KPIs, chart types, color themes, and the data model to align with your organization’s specific circular economy goals.
- Click here to Purchase the Circular Economy Startups Dashboard in Excel
Dashboard Pages Explanation
The Circular Economy Startups Dashboard in Excel is organized into seven worksheets, each serving a specific purpose in the sustainability tracking workflow.
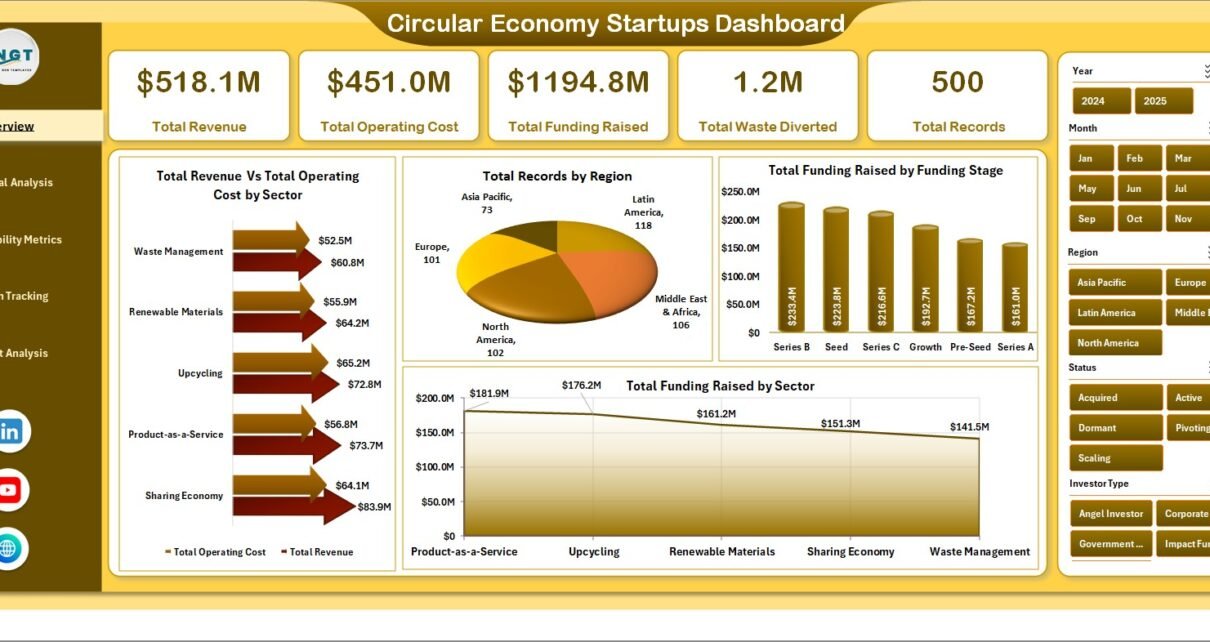
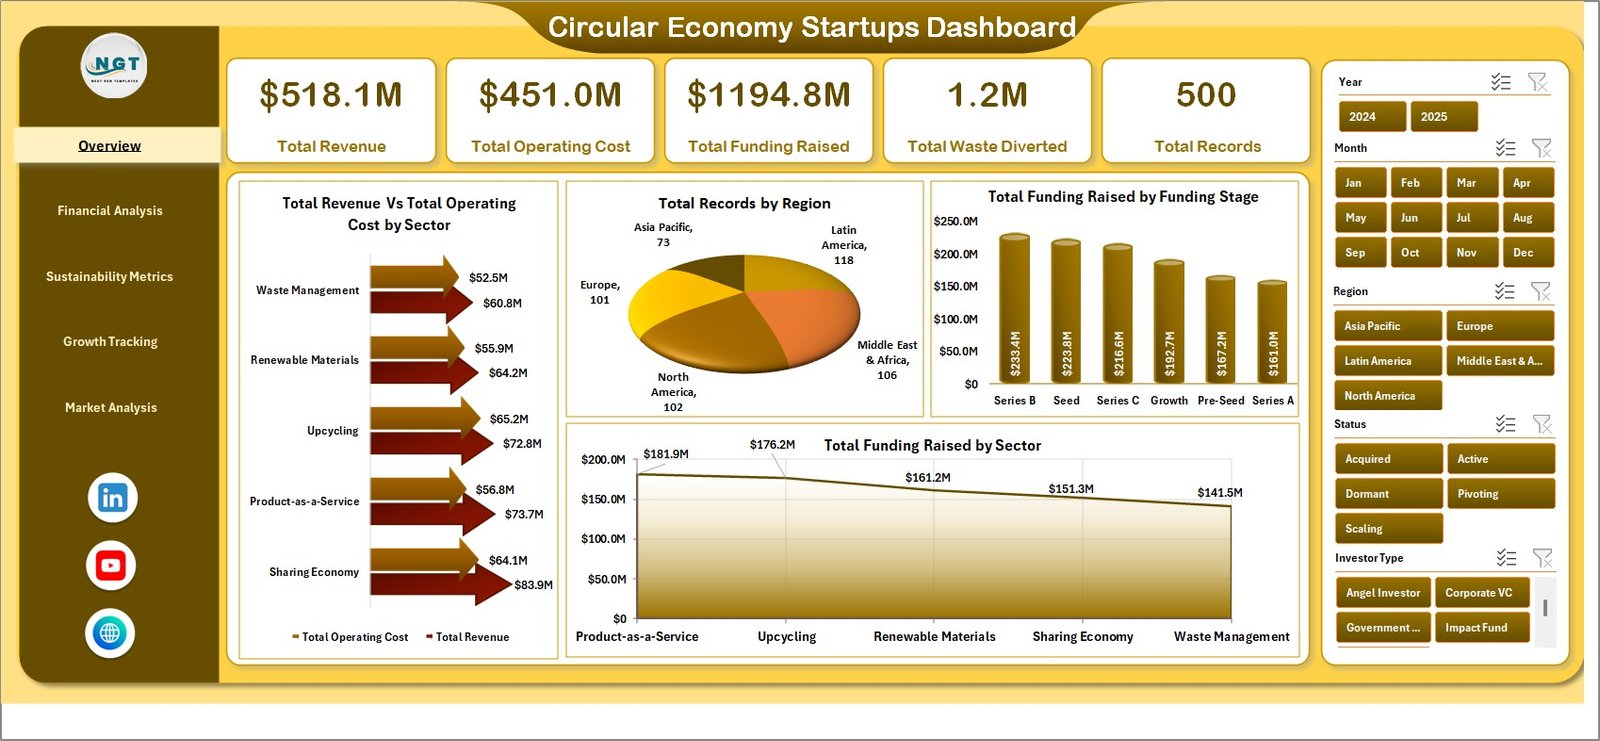
1 — Overview Page

The Overview page serves as your main command center. At the top, you will find KPI cards displaying critical metrics such as Total Revenue, Total Waste Diverted, Overall Recycling Rate, Carbon Savings Achieved, Number of Active Startups, and Resource Recovery Rate. Below the cards, interactive charts visualize performance dimensions including Waste Diverted by Startup, Recycling Rate by Material Category, Revenue by Region, Carbon Savings by Quarter, and Resource Recovery by Business Model. Slicers allow you to filter the entire page instantly by any dimension.
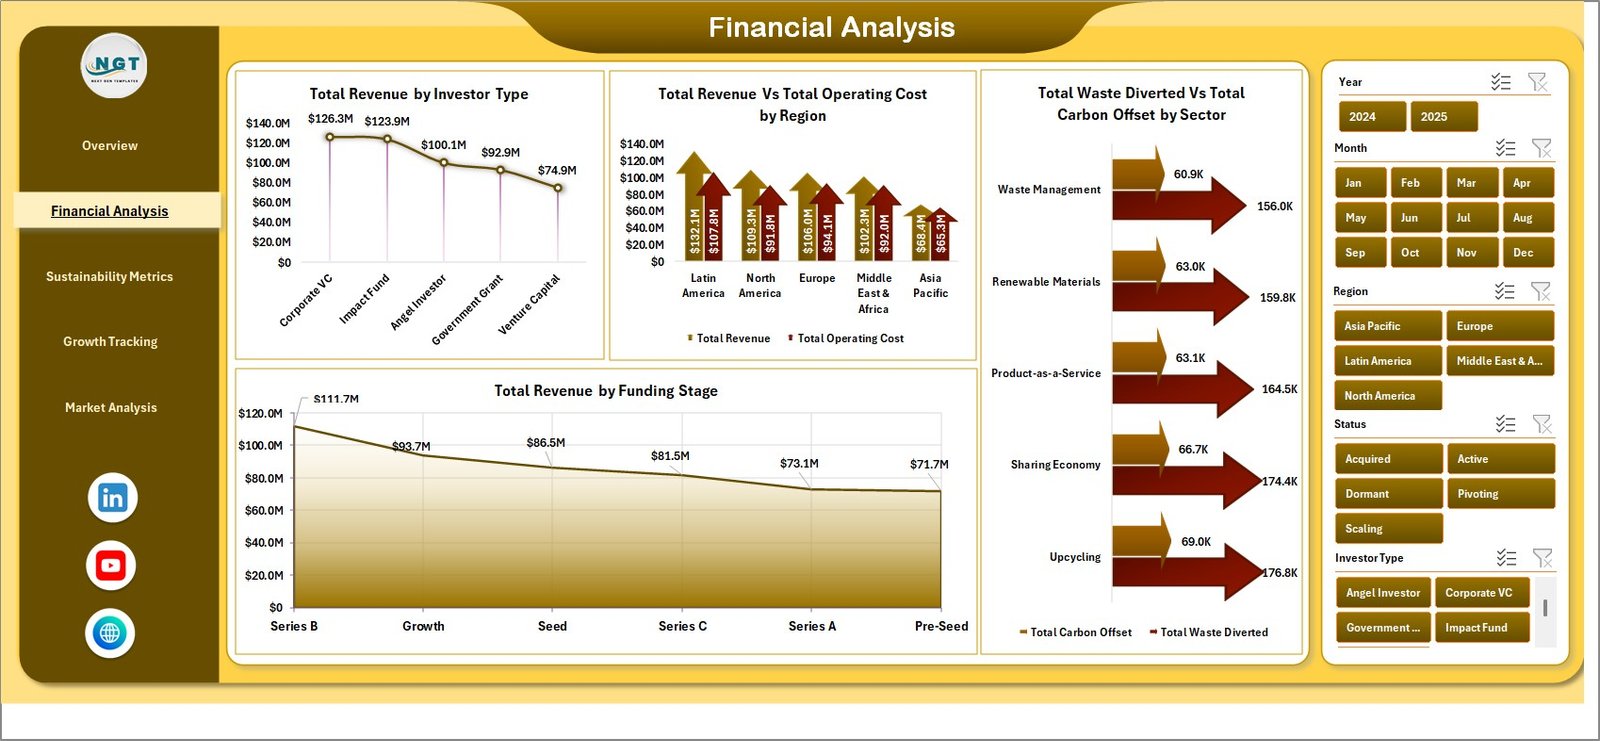
2 — Financial Analysis
This page Financial Analysisa deep dive into how materials move through startup operations. You will find charts and analysis covering Material Recovery by Category, Waste Composition by Material Type, Recycling Efficiency by Material, Resource Utilization Trends over time, and Input-Output Material Balance. This helps startups identify which material streams offer the highest recovery potential and where waste reduction efforts should be focused.
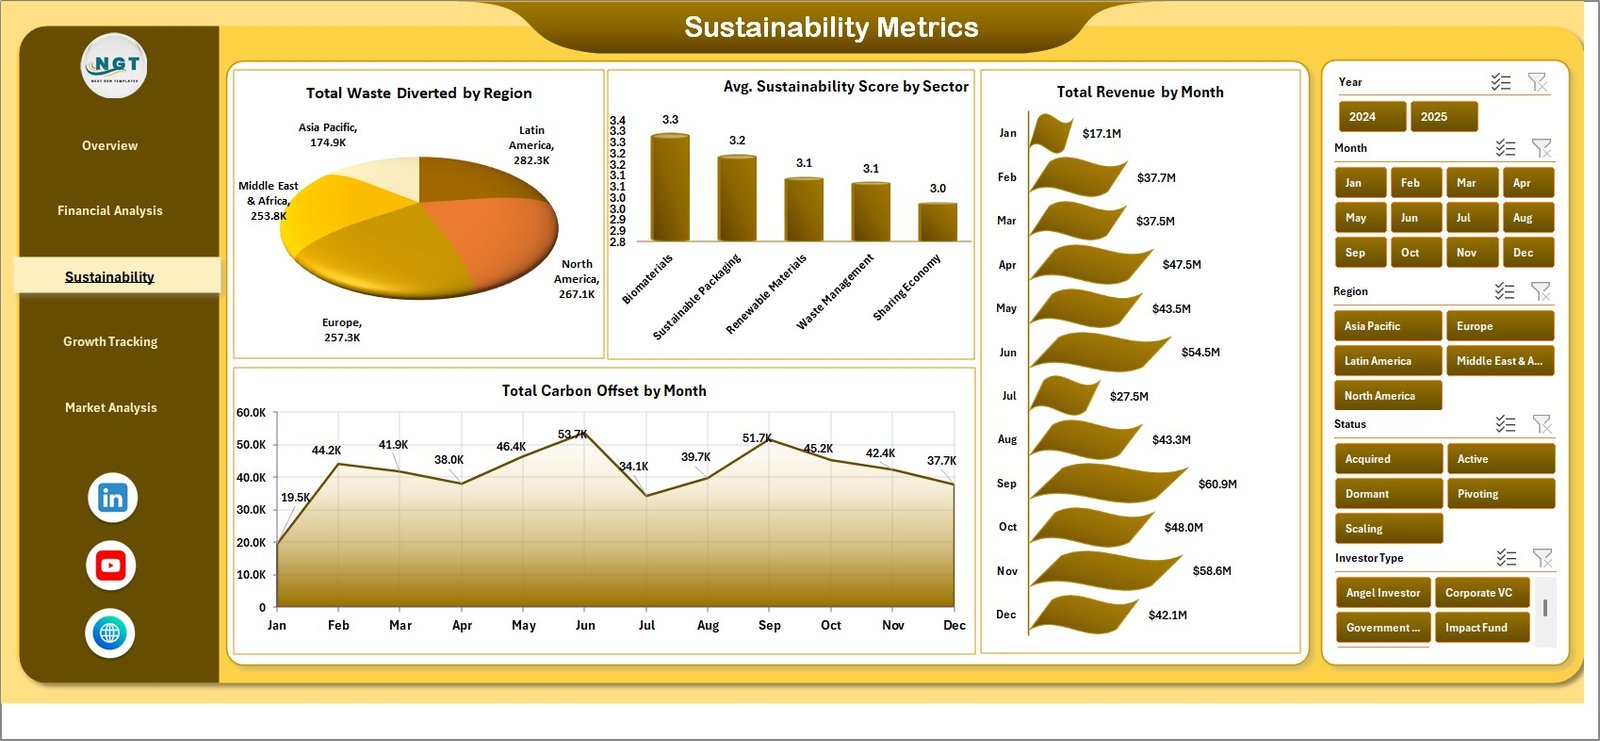
3 — Sustainability Impact Analysis
The Sustainability Impact page tracks the environmental footprint of startup activities. Key analyses include Carbon Emission Reductions by Startup, Water Conservation Metrics by Region, Energy Savings by Operation Type, Environmental Impact Score by Quarter, and Sustainability Goal Achievement Rate. Comparative trend charts help you benchmark progress against previous periods and set realistic improvement targets.
 Sustainability Impact Analysis
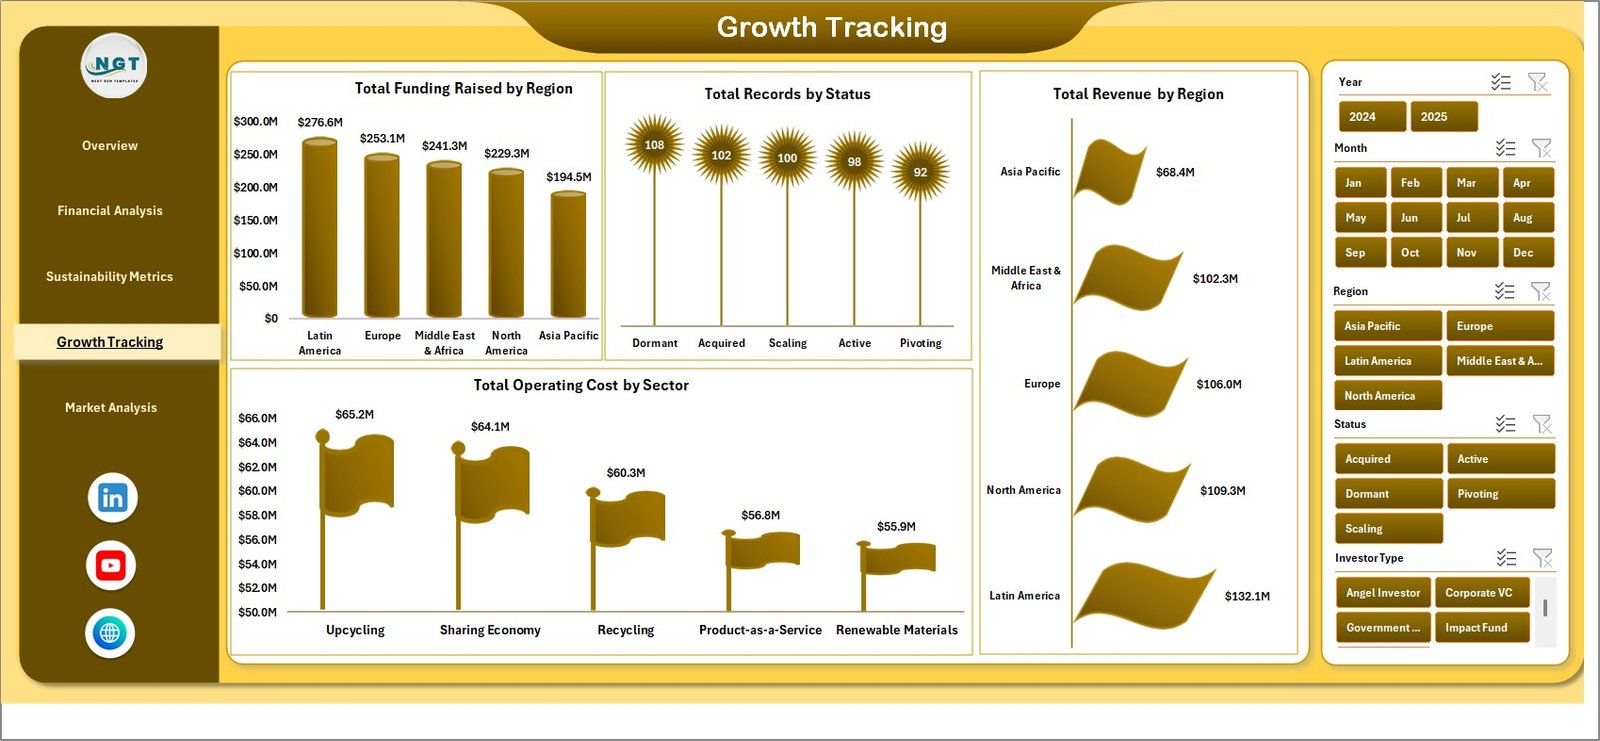
4 — Growth Tracking
This page Growth Tracking side of circular economy practices. Charts cover Production Waste Rate by Product Line, Supply Chain Circularity Index, Product Lifecycle Extension Metrics, Cost Savings from Circular Practices, and Closed-Loop System Adoption Rate. Operations managers can use these insights to identify inefficiencies and optimize processes for better sustainability outcomes.
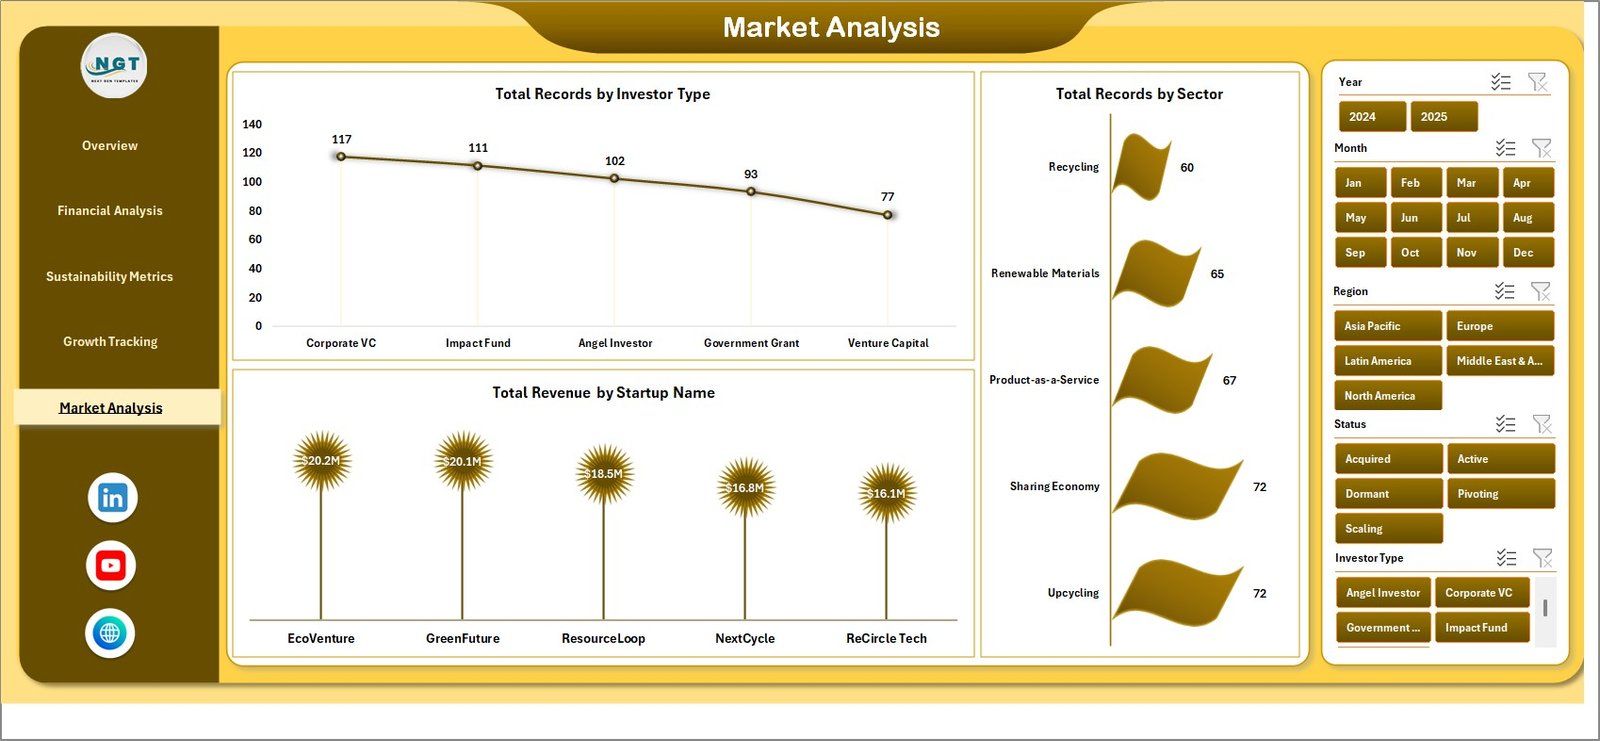
5 — Market Analysis
The Market Analysis page offers a geographic breakdown of sustainability metrics. Visualizations include Sustainability Score by Region, Market Penetration by Location, Circular Economy Adoption Rate by Geography, Revenue Distribution by Region, and Waste Diversion Performance by Area. This is especially valuable for startups operating across multiple cities or countries.
Click here to Purchase the Circular Economy Startups Dashboard in Excel
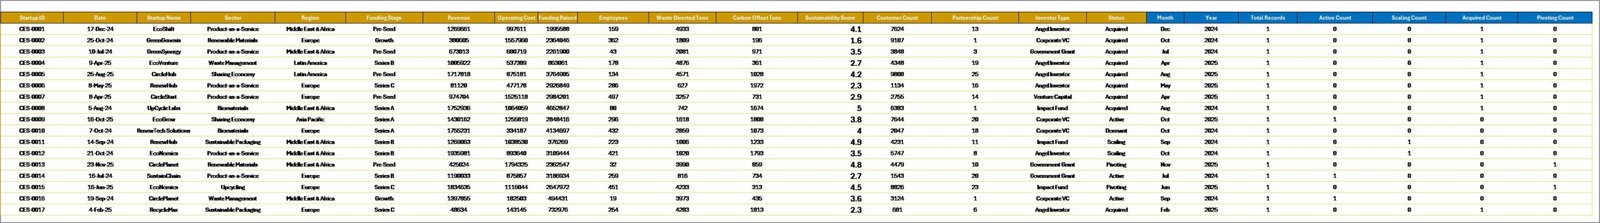
6 — Data Sheet
The Data Sheet is where all your raw data lives. This is the central input area where you enter startup performance records including startup details, material data, revenue figures, waste metrics, and regional information. Simply update this sheet with your actual data in the same column format, then go to the Data tab in Excel and click Refresh All to update the entire dashboard automatically.
 Data Sheet Tab
7 — Support Sheet
The Support Sheet contains all the pivot tables that power the dashboard charts and KPI calculations. After updating the data in the Data Sheet, you can go to the Data tab in the Excel Ribbon and click on Refresh All. All the pivots will be refreshed and all the charts will be refreshed. You can keep this sheet hidden during presentations for a cleaner look.
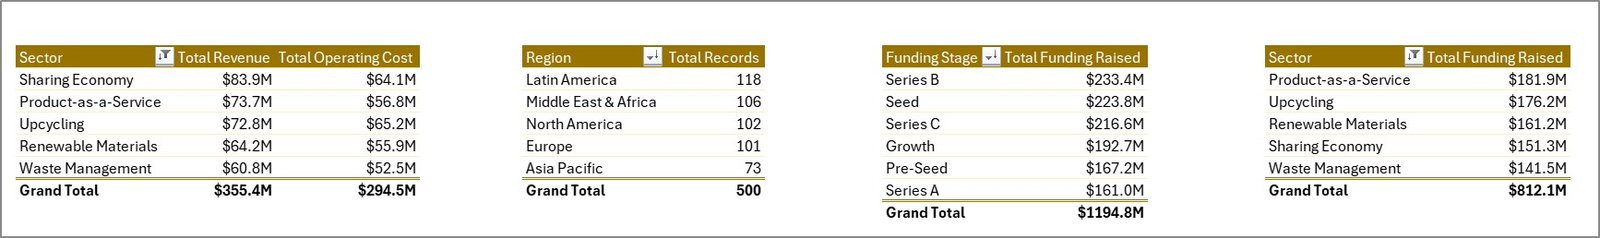 Support Sheet Tab
Advantages of Circular Economy Startups Dashboard in Excel
This dashboard offers several compelling advantages for startups and organizations committed to circular economy principles:
- Centralized Performance Monitoring — Instead of juggling multiple spreadsheets and reports, all your sustainability KPIs are consolidated into one interactive dashboard that provides instant visibility.
- Cost-Effective Analytics — Get enterprise-grade dashboard capabilities without investing in expensive business intelligence platforms like Power BI or Tableau. Excel is familiar and accessible to virtually every business professional.
- Data-Driven Decision Making — Transform raw sustainability data into visual charts and trend analyses that support evidence-based strategic decisions about resource allocation and environmental impact.
- Investor-Ready Reporting — Present clean, professional sustainability dashboards during investor meetings, accelerator demo days, or stakeholder reviews to demonstrate measurable circular economy progress.
- Scalable Framework — Start with the provided data model and expand it as your startup grows, adding new KPIs, material categories, or regional dimensions without rebuilding the dashboard from scratch.
Opportunities for Improvement
While the dashboard is powerful and comprehensive, here are some areas where users might consider enhancements:
- Adding automated data connections to external data sources such as ERP systems or IoT sensors for real-time material tracking.
- Implementing conditional formatting thresholds that change automatically based on industry benchmarks or regulatory requirements.
- Expanding the regional analysis to include map-based visualizations using Excel’s geographic chart features for more intuitive geographic comparisons.
- Creating a dedicated financial impact page that quantifies the monetary savings generated from circular economy practices.
Best Practices
To get the maximum value from this circular economy dashboard, follow these recommended best practices:
- Update Data Monthly — Maintain a consistent monthly data update cadence to ensure trend analyses and KPI comparisons remain accurate and meaningful.
- Customize KPIs to Your Industry — While the template includes common circular economy metrics, modify or add KPIs that align with your specific industry standards and reporting frameworks such as GRI or SASB.
- Use Slicers Strategically — During presentations and meetings, use slicers to drill into specific startups, regions, or time periods to highlight successes and identify areas needing attention.
- Keep the Support Sheet Hidden — Hide the Support Sheet during presentations to maintain a clean, professional appearance while preserving the pivot table engine behind the scenes.
- Back Up Regularly — Save versioned copies of your dashboard before making significant changes to the data model or adding new analysis pages.
- Click here to Purchase the Circular Economy Startups Dashboard in Excel
Explore Relevant Templates
If you find this Circular Economy Startups Dashboard useful, explore these related templates from NextGenTemplates for comprehensive sustainability tracking:
- Circular Economy KPI Dashboard in Excel — A KPI-focused dashboard tracking resource efficiency, recycling, and environmental impact metrics.
- Circular Economy KPI Scorecard in Excel — A structured scorecard with MTD/YTD tracking, target comparisons, and trend analysis for circular economy KPIs.
- Circular Economy KPI Dashboard in Google Sheets — A cloud-based version with real-time collaboration and sharing capabilities.
- Packaging Sustainability KPI Dashboard in Excel — Focused specifically on packaging waste reduction, recyclable materials, and packaging efficiency tracking.
- Ethical Fashion KPI Dashboard in Excel — Track sustainable sourcing, fair labor practices, and environmental impact in the fashion industry.
FAQs
What Excel version do I need to use this dashboard?
This dashboard works with Microsoft Excel 2016 and later versions including Excel for Microsoft 365. It uses native Excel features like pivot tables, slicers, and conditional formatting without any macros or VBA code.
Can I customize the KPIs and charts in this dashboard?
Yes, the dashboard is fully customizable. You can modify existing KPIs, add new metrics, change chart types, adjust color schemes, and expand the data model to match your specific circular economy tracking requirements.
How do I update the dashboard with my own data?
Simply navigate to the Data Sheet tab, replace the sample data with your actual startup performance data in the same column format, and then click Refresh All from the Data tab in the Excel ribbon. All pivot tables and charts will update automatically.
Click here to Purchase the Circular Economy Startups Dashboard in Excel
Is this dashboard suitable for multiple startups or just one?
The dashboard is designed to track multiple startups simultaneously. You can use the slicer filters to focus on individual startups or view aggregated performance across your entire portfolio.
Can I use this dashboard for ESG reporting?
While this dashboard is primarily designed for operational circular economy tracking, many of the KPIs align with common ESG reporting frameworks. You can customize the metrics to match specific ESG requirements like GRI, SASB, or CDP standards.
Do I need any technical skills to use this dashboard?
No advanced technical skills are needed. If you can work with basic Excel operations like entering data, clicking buttons, and navigating sheet tabs, you can use this dashboard effectively. The automated pivot table engine handles all calculations behind the scenes.
Conclusion
The Circular Economy Startups Dashboard in Excel is a must-have tool for any sustainability-focused organization looking to track, measure, and optimize circular economy performance. With its interactive multi-page design, automated calculations, and professional visual layout, this dashboard transforms complex sustainability data into actionable business intelligence.
Whether you are a startup founder tracking your environmental impact, an impact investor evaluating portfolio sustainability, or a consultant advising green businesses, this dashboard delivers the clarity and insights you need to drive meaningful change.
Click here to Purchase the Circular Economy Startups Dashboard in Excel
Visit our YouTube channel for step-by-step video tutorials and dashboard walkthroughs:
For more Excel dashboard templates and sustainability tracking tools, visit NextGenTemplates.com and explore our collection of ready-to-use business dashboards.
You can also learn more about circular economy practices and frameworks from Microsoft Learn and explore sustainable business strategies that can be tracked using this powerful Excel dashboard.
Click here to Purchase the Circular Economy Startups Dashboard in Excel