Climate change is one of the most critical global challenges of our time. To combat its effects effectively, organizations, governments, and businesses must not only commit to sustainability goals but also measure and monitor their progress.
That’s exactly what the Climate Action KPI Scorecard in Excel helps achieve.
This powerful, ready-to-use Excel template provides a structured framework for tracking climate-related Key Performance Indicators (KPIs) such as carbon emissions, energy consumption, renewable usage, waste reduction, and more. It enables sustainability teams to visualize progress, identify improvement areas, and make informed environmental decisions using real-time data.
If your organization aims to achieve net-zero emissions, reduce waste, or improve renewable energy utilization, this Excel-based scorecard is an essential management tool.
Click to Purchases Climate Action KPI Scorecard in Excel
What Is a Climate Action KPI Scorecard in Excel?
A Climate Action KPI Scorecard is a digital tool built in Microsoft Excel that tracks environmental and sustainability performance metrics. It brings together your organization’s climate-related data into a single interactive workspace.
This scorecard focuses on measuring, visualizing, and analyzing both operational and strategic KPIs that directly impact sustainability goals. These may include metrics like:
-
Total CO₂ emissions (tons/year)
-
Renewable energy percentage
-
Waste diverted from landfills (%)
-
Water consumption (liters/unit output)
-
Carbon offset achieved
-
Employee environmental training completion rate
By consolidating this data, the scorecard helps you monitor progress, benchmark performance, and ensure alignment with sustainability commitments such as the UN Sustainable Development Goals (SDGs) or corporate ESG targets.
Click to Purchases Climate Action KPI Scorecard in Excel
Key Features of the Climate Action KPI Scorecard
This ready-to-use Excel template includes four interlinked worksheets, each serving a unique function in tracking and analyzing environmental performance.
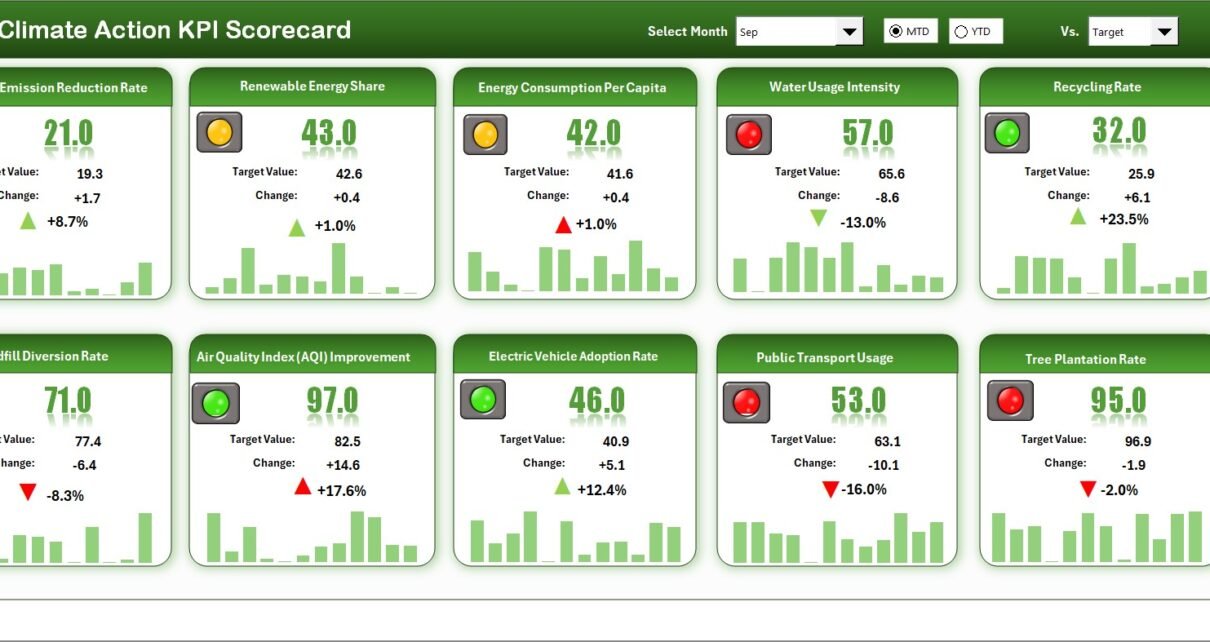
1️⃣ Scorecard Sheet

The Scorecard Sheet is the main interface of the tool and acts as your real-time climate dashboard. It provides a holistic overview of all KPIs, ensuring that sustainability professionals and decision-makers can monitor progress at a glance.
Key Highlights:
-
Dropdown Menus:
Quickly switch between Month-to-Date (MTD) or Year-to-Date (YTD) analysis and choose a specific month for evaluation. -
Actual vs Target Values:
Compare actual performance against defined targets to understand which KPIs are performing well and which require attention. -
Visual Indicators:
Utilize color-coded icons or conditional formatting (green for on-target, red for off-target) to interpret results instantly. -
Comprehensive KPI Overview:
Display MTD and YTD values for all key environmental metrics such as energy, water, waste, and emissions.
This interactive layout transforms Excel from a static spreadsheet into a dynamic decision-support tool for sustainability reporting.
2️⃣ KPI Trend Sheet

The KPI Trend Sheet helps you analyze environmental performance trends over time.
It includes:
-
A KPI selection dropdown (cell C3) to focus on a specific metric.
-
Automatic display of KPI Group, Unit, Type (UTB or LTB), Formula, and Definition for reference.
-
Dual trend charts showcasing MTD and YTD performance for Actual, Target, and Previous Year data.
This sheet is especially helpful in understanding seasonal fluctuations or long-term improvements in energy efficiency, emissions reduction, or water conservation.
3️⃣ Input Data Sheet

The Input Data Sheet serves as the central hub for recording all climate-related performance data.
Users can:
-
Enter actual results, target goals, and other relevant KPIs each month.
-
Update figures dynamically as new environmental data becomes available.
-
Maintain a continuous record of sustainability progress for accurate trend analysis.
This sheet’s structure ensures data integrity and flexibility, making it easy to scale as your reporting needs evolve.
4️⃣ KPI Definition Sheet

The KPI Definition Sheet acts as a reference guide for all metrics tracked within the scorecard.
It includes:
-
KPI Name
-
KPI Group (e.g., Energy, Waste, Water, Emissions, Sustainability)
-
Unit of Measurement
-
Formula used to calculate the KPI
-
Definition or explanation of the metric
This ensures consistency across departments and transparency in how each KPI is measured and reported.
Click to Purchases Climate Action KPI Scorecard in Excel
Examples of KPIs for Climate Action Tracking
Below are some sample KPIs typically included in climate action performance tracking:
Energy Efficiency and Consumption
-
Energy Usage per Production Unit (kWh/unit)
-
Renewable Energy Share (%)
-
Energy Savings Achieved vs Previous Year (%)
Carbon and Emissions
-
Total Greenhouse Gas Emissions (tons CO₂e)
-
Scope 1, Scope 2, and Scope 3 Emissions (%)
-
Carbon Offset Contribution (tons CO₂ compensated)
Waste Management
-
Waste Recycled (%)
-
Waste Sent to Landfill (tons)
-
Hazardous Waste Reduction (%)
Water Management
-
Water Consumption per Employee (liters)
-
Wastewater Reuse (%)
-
Water Efficiency Improvement (%)
Sustainability and Community
-
Employee Climate Awareness Training Completion (%)
-
Number of Green Projects Initiated
-
Climate Risk Mitigation Plans Implemented
Advantages of Using a Climate Action KPI Scorecard in Excel
🌱 1. Centralized Climate Performance Management
Consolidates all sustainability and environmental metrics in one structured, easy-to-update Excel file.
⚡ 2. Real-Time Insights
Instantly view MTD and YTD comparisons to identify underperforming areas.
📈 3. Data-Driven Decision-Making
Empowers sustainability officers to make informed choices on energy, emissions, and waste strategies.
💧 4. Transparency and Accountability
Ensures measurable progress toward environmental commitments and compliance with ESG standards.
🌍 5. Easy Customization
Modify or add KPIs to fit your organization’s sustainability framework or reporting needs.
📊 6. Visual Impact
Conditional formatting and charts make the scorecard visually engaging and easy to interpret for executives or auditors.
How This Scorecard Supports Climate Action Strategy
The Climate Action KPI Scorecard in Excel supports every stage of the sustainability journey:
1️⃣ Planning: Define targets aligned with climate goals.
2️⃣ Execution: Collect actual data from departments.
3️⃣ Monitoring: Compare MTD and YTD progress in real time.
4️⃣ Reporting: Create data-backed sustainability reports with visual summaries.
5️⃣ Improvement: Identify trends and corrective actions to enhance performance.
By aligning operations with measurable indicators, organizations can drive continuous improvement and demonstrate environmental responsibility transparently.
Click to Purchases Climate Action KPI Scorecard in Excel
Opportunities for Improvement
To enhance the scorecard’s functionality even further, consider:
-
Integrating with Power BI for interactive dashboards.
-
Automating data import using Power Query.
-
Adding forecasting models for future sustainability performance.
-
Including monetary impact tracking (e.g., energy cost savings).
-
Incorporating benchmarking vs industry averages for competitive insights.
These improvements can transform a static Excel workbook into a full-scale sustainability intelligence platform.
Best Practices for Using the Scorecard
To maximize the value of your Climate Action KPI Scorecard:
1️⃣ Set clear, realistic targets for each KPI.
2️⃣ Update data monthly to maintain timely reporting.
3️⃣ Verify data sources for accuracy and consistency.
4️⃣ Use color coding wisely to improve readability.
5️⃣ Train your sustainability team to interpret data effectively.
6️⃣ Regularly review KPIs to ensure continued relevance.
7️⃣ Integrate results into annual sustainability or ESG reports.
Following these best practices ensures reliable and actionable climate performance monitoring.
Conclusion
The Climate Action KPI Scorecard in Excel provides an efficient and accessible way to track, analyze, and report environmental performance. It empowers organizations to monitor progress on energy use, emissions reduction, waste management, and water conservation — all in one simple interface.
By leveraging Excel’s flexibility and visualization tools, sustainability teams can turn data into insight, and insight into action. This tool is perfect for companies that want to take measurable climate action and make data-driven environmental decisions without investing in complex software.
In an era where accountability defines leadership, this scorecard helps organizations measure their green journey and accelerate their path toward sustainability success.
Click to Purchases Climate Action KPI Scorecard in Excel
Frequently Asked Questions (FAQs)
1. What is the main purpose of the Climate Action KPI Scorecard?
It helps track and evaluate environmental KPIs such as emissions, energy use, and waste reduction to measure sustainability progress.
2. Who can use this scorecard?
It is suitable for sustainability managers, ESG teams, corporate strategists, and organizations of any size aiming to improve climate accountability.
3. Can I modify the KPIs?
Yes, you can easily edit or add KPIs in the KPI Definition sheet to match your organization’s goals.
4. How often should I update data?
It’s best to update monthly to maintain accurate MTD and YTD tracking.
5. Can this Excel file be linked to live data?
Yes, you can integrate it with databases or Power BI through Power Query for automated updates.
6. Is it suitable for reporting under ESG or SDG frameworks?
Absolutely. The structure aligns with ESG and UN SDG reporting standards.
7. Can non-technical users operate it?
Yes, it’s designed for ease of use, requiring only basic Excel knowledge.
8. How does it support climate accountability?
By quantifying environmental impact and progress, it promotes transparency, accountability, and goal alignment.
Click to Purchases Climate Action KPI Scorecard in Excel
Visit our YouTube channel to learn step-by-step video tutorials