Modern clinics operate in a highly cost-sensitive and compliance-driven environment. Therefore, procurement teams must track spending, supplier performance, targets, and trends with precision. However, many clinics still depend on disconnected Excel sheets and manual reports. As a result, visibility drops, decision-making slows, and costs increase.
That is exactly why a Clinic Procurement KPI Dashboard in Power BI becomes a game-changer.
This in-depth, SEO-friendly guide explains everything you need to know about a Clinic Procurement KPI Dashboard in Power BI. Moreover, it shows how clinics can use this ready-to-use dashboard to gain control, improve efficiency, and support data-driven decisions.
Click to buy Clinic Procurement KPI Dashboard in Power BI
What Is a Clinic Procurement KPI Dashboard in Power BI?
A Clinic Procurement KPI Dashboard in Power BI is a centralized analytics solution designed to track, monitor, and evaluate procurement performance across a clinic. It converts raw procurement data into interactive KPIs, trend charts, and comparison metrics.
Instead of manually reviewing procurement records, clinic managers can:
- Monitor MTD and YTD procurement performance
- Compare actuals vs targets
- Track current year vs previous year trends
- Identify underperforming KPIs instantly
- Improve cost control and supplier management
Because the dashboard runs on Power BI and uses Excel as a data source, it remains easy to maintain, flexible, and cost-effective.
Why Do Clinics Need a Procurement KPI Dashboard?
Clinics face constant pressure to reduce costs while maintaining care quality. Therefore, procurement decisions directly impact profitability, compliance, and patient outcomes.
However, without a structured KPI dashboard:
- Procurement data remains scattered
- Performance issues go unnoticed
- Target tracking becomes inconsistent
- Reporting consumes valuable time
A Clinic Procurement KPI Dashboard in Power BI solves these problems by delivering clarity, consistency, and control.
How Does a Clinic Procurement KPI Dashboard in Power BI Work?
The dashboard works on a simple yet powerful concept. First, users enter procurement data into structured Excel sheets. Next, Power BI connects to this data and transforms it into interactive visuals and KPIs.
Data Flow Overview
- Excel Input Files – Users maintain actuals, targets, and KPI definitions
- Power BI Model – Data relationships and measures calculate KPIs
- Interactive Dashboard Pages – Users analyze procurement performance instantly
Because of this setup, clinics can update data without technical complexity.
Key Pages of the Clinic Procurement KPI Dashboard in Power BI
This ready-to-use dashboard includes three well-structured pages, each designed for a specific analytical purpose.
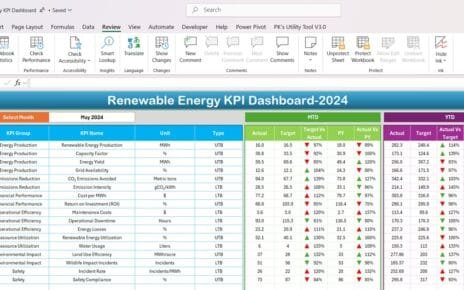
Summary Page
The Summary Page acts as the control center of the dashboard. It provides a complete snapshot of procurement performance at a glance.
Top-Level Slicers
At the top of the page, users can filter data using:
- Month Slicer
- KPI Group Slicer
These slicers ensure focused and flexible analysis.
KPI Cards for Quick Insights
The dashboard displays three powerful KPI cards:
- Total KPIs Count
- MTD Target Met Count
- MTD Target Missed Count
As a result, decision-makers instantly understand overall performance.
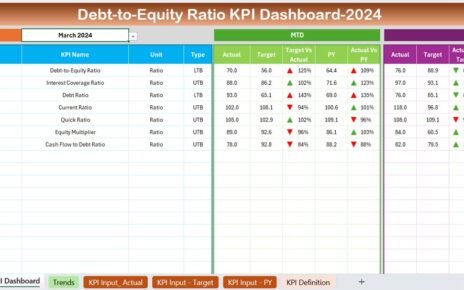
What KPIs Appear in the Detailed Table?
Below the KPI cards, the Summary Page includes a comprehensive KPI table. This table delivers granular insights into every procurement KPI.
KPI Table Columns Explained
- KPI Number – Sequential identifier for each KPI
- KPI Group – Category or group of the KPI
- KPI Name – Name of the procurement KPI
- Unit – Measurement unit (Amount, %, Days, etc.)
Type – KPI type:
LTB (Lower the Better)
UTB (Upper the Better)
MTD Performance Metrics
- Actual CY MTD – Current Year Month-to-Date actual value
Target CY MTD – Current Year Month-to-Date target
MTD Icon –
▲ Green icon for target met
▼ Red icon for target missed
Target vs Actual (MTD) – Percentage calculated as:
Actual MTD / Target MTD
PY MTD – Previous Year MTD value
CY vs PY (MTD) – Growth or decline percentage compared to last year
YTD Performance Metrics
- Actual CY YTD – Current Year Year-to-Date actual
- Target CY YTD – Current Year Year-to-Date target
- YTD Icon – Visual indicator for YTD status
- Target vs Actual (YTD) –
Actual YTD / Target YTD - PY YTD – Previous Year YTD value
- CY vs PY (YTD) – Year-over-Year comparison
Because of this structure, clinics can analyze performance both monthly and annually.

Click to buy Clinic Procurement KPI Dashboard in Power BI
What Insights Does the KPI Trend Page Provide?
The KPI Trend Page focuses on performance trends over time.
Key Features of the KPI Trend Page
Two Combo Charts:
MTD Actual vs Target vs PY
YTD Actual vs Target vs PY
KPI Name Slicer on the left for focused analysis
These visuals help users identify:
Seasonal procurement trends
- Consistent underperformance
- Long-term improvement patterns
As a result, clinics can act before issues escalate.

Click to buy Clinic Procurement KPI Dashboard in Power BI
KPI Definition
The KPI Definition Page ensures clarity and transparency.
Purpose of the KPI Definition Page
- Acts as a drill-through page
- Remains hidden from direct navigation
- Opens when users drill through from the Summary Page
What Information Does It Show?
- KPI Formula
- KPI Definition
- KPI Objective
- KPI Type (LTB or UTB)
This page ensures that every stakeholder understands what each KPI measures and why it matters.

Click to buy Clinic Procurement KPI Dashboard in Power BI
How Does Drill-Through Navigation Improve Usability?
Drill-through functionality improves user experience significantly.
- Users right-click a KPI on the Summary Page
- Power BI opens the KPI Definition Page
- Users review detailed explanations
- A Back button returns them to the main dashboard
Therefore, analysis becomes seamless and intuitive.
What Excel Data Is Required for This Dashboard?
The dashboard uses a simple Excel-based data model. Clinics only need to maintain three worksheets.
Input_Actual Sheet: What Data Goes Here?
This sheet captures actual procurement performance.
Required Columns
- KPI Name
- Month (First date of the month)
- MTD Actual Value
- YTD Actual Value
Users update this sheet regularly to keep the dashboard current.

Input_Target Sheet: How Are Targets Managed?
This sheet stores procurement targets.
Required Columns
- KPI Name
- Month (First date of the month)
- MTD Target Value
- YTD Target Value
Because targets remain separate, clinics can revise goals without touching actual data.
KPI Definition Sheet: Why Is It Critical?
This sheet defines the meaning of each KPI.
Required Columns
- KPI Number
- KPI Group
- KPI Name
- Unit
- Formula
- Definition
- Type (LTB or UTB)
As a result, the dashboard remains standardized and auditable.
Advantages of the Clinic Procurement KPI Dashboard in Power BI
Using this dashboard delivers measurable benefits to clinics.
Key Advantages
- Centralized procurement visibility
- Faster and more accurate reporting
- Clear MTD and YTD performance tracking
- Visual alerts for target misses
- Easy Excel-based data maintenance
- Scalable for clinics of any size
Because of these advantages, clinics improve both efficiency and control.
Opportunities for Improvement in Clinic Procurement Analytics
Even the best dashboards leave room for enhancement.
Opportunities for Improvement
- Add supplier-level KPI analysis
- Integrate automated data refresh
- Include cost variance analysis
- Add drill-down by department
- Introduce forecast-based KPIs
By expanding analytics, clinics unlock deeper insights.
Best Practices for the Clinic Procurement KPI Dashboard in Power BI
To maximize value, clinics should follow proven best practices.
Best Practices
- Standardize KPI definitions across departments
- Update Excel inputs on a fixed schedule
- Review target logic quarterly
- Train users on KPI interpretation
- Use slicers for focused analysis
- Monitor trends, not just snapshots
When clinics follow these practices, dashboard adoption improves significantly.
Who Can Benefit from This Dashboard?
This dashboard supports multiple roles within a clinic.
Key Users
- Procurement Managers
- Finance Teams
- Clinic Administrators
- Operations Heads
- Compliance Officers
Because everyone works from the same data, collaboration improves.
How Does This Dashboard Support Better Decision-Making?
The dashboard transforms raw numbers into insights.
- Managers spot issues early
- Leaders compare performance objectively
- Teams align with procurement targets
- Clinics reduce unnecessary costs
As a result, procurement decisions become proactive instead of reactive.
Can Small Clinics Use This Dashboard?
Yes, absolutely.
Because the dashboard uses Excel and Power BI:
- Small clinics can implement it quickly
- No complex IT infrastructure is required
- Costs remain low
- Scalability remains high
Therefore, clinics of all sizes benefit equally.
Conclusion: Why Every Clinic Needs a Procurement KPI Dashboard in Power BI
Procurement plays a critical role in clinic operations. However, without clear visibility, costs rise and efficiency drops. A Clinic Procurement KPI Dashboard in Power BI solves this challenge by delivering clarity, control, and confidence.
With structured KPIs, interactive visuals, and Excel-based data entry, this dashboard empowers clinics to manage procurement performance effectively. Moreover, it supports better planning, accountability, and long-term savings.
Frequently Asked Questions (FAQs)
What is a Clinic Procurement KPI Dashboard in Power BI?
It is a Power BI-based analytics solution that tracks clinic procurement KPIs using Excel data sources.
Does this dashboard require advanced Power BI skills?
No. Users only need to update Excel sheets. Power BI handles the analytics automatically.
Can clinics customize KPIs?
Yes. Clinics can add, modify, or remove KPIs using the KPI Definition sheet.
How often should data be updated?
Clinics should update data monthly for accurate MTD and YTD analysis.
Is this dashboard suitable for multi-location clinics?
Yes. With additional fields, it can scale to multi-clinic environments easily.
Watch the step-by-step video tutorial:
Visit our YouTube channel to learn step-by-step video tutorials
Click to buy Clinic Procurement KPI Dashboard in Power BI