Managing projects in a clinic environment requires accuracy, visibility, and timely decision-making. Clinics run multiple projects at the same time—such as facility upgrades, IT implementations, equipment installations, process improvements, and compliance initiatives. However, when project data remains scattered across emails, registers, and manual Excel sheets, control becomes difficult and risks increase.
This is exactly where Clinic Project Management in Excel becomes a powerful and practical solution.
In this in-depth guide, you will learn what Clinic Project Management in Excel is, how it works, why clinics need it, its complete dashboard structure, key features, advantages, best practices, and frequently asked questions. Moreover, the language stays simple, clear, and business-focused so clinic administrators, project managers, and decision-makers can use it confidently.
Click to Purchases Clinic Project Management in Excel
What Is Clinic Project Management in Excel?
Clinic Project Management in Excel is a ready-to-use, structured Excel-based system that helps clinics plan, track, monitor, and analyze projects from one centralized dashboard.
Instead of handling projects through disconnected spreadsheets, this solution converts raw project data into:
-
Clear KPI cards
-
Interactive charts
-
Department-wise insights
-
Project manager performance views
-
Cost tracking and risk monitoring
As a result, clinics gain full visibility and better control over budgets, timelines, risks, and outcomes.
Why Do Clinics Need Project Management in Excel?
Clinic projects often involve tight budgets, strict timelines, and high compliance requirements. Therefore, clinics must track progress and costs accurately at every stage.
However, many clinics still face common challenges such as:
-
No centralized project tracking
-
Manual follow-ups and delayed updates
-
Limited budget visibility
-
Difficulty identifying high-risk projects
-
No performance comparison across departments
Clinic Project Management in Excel solves these challenges by providing one single source of truth.
Because Excel remains widely used and easy to deploy, clinics can implement this solution without investing in complex software.
How Does Clinic Project Management in Excel Work?
Clinic Project Management in Excel works through a well-defined structure that separates data entry, calculations, and visualization.
The workflow typically follows these steps:
-
Enter project data in the Data Sheet
-
Excel formulas calculate budgets, costs, risk levels, and status
-
Pivot tables summarize project information
-
Interactive dashboards visualize insights instantly
-
Slicers allow quick filtering by clinic, department, manager, project type, or month
As a result, decision-makers can analyze project performance in seconds.
What Is the Structure of the Clinic Project Management Dashboard in Excel?
The dashboard contains five interactive analytical pages, along with backend support and data sheets. Each page focuses on a specific perspective of project management.
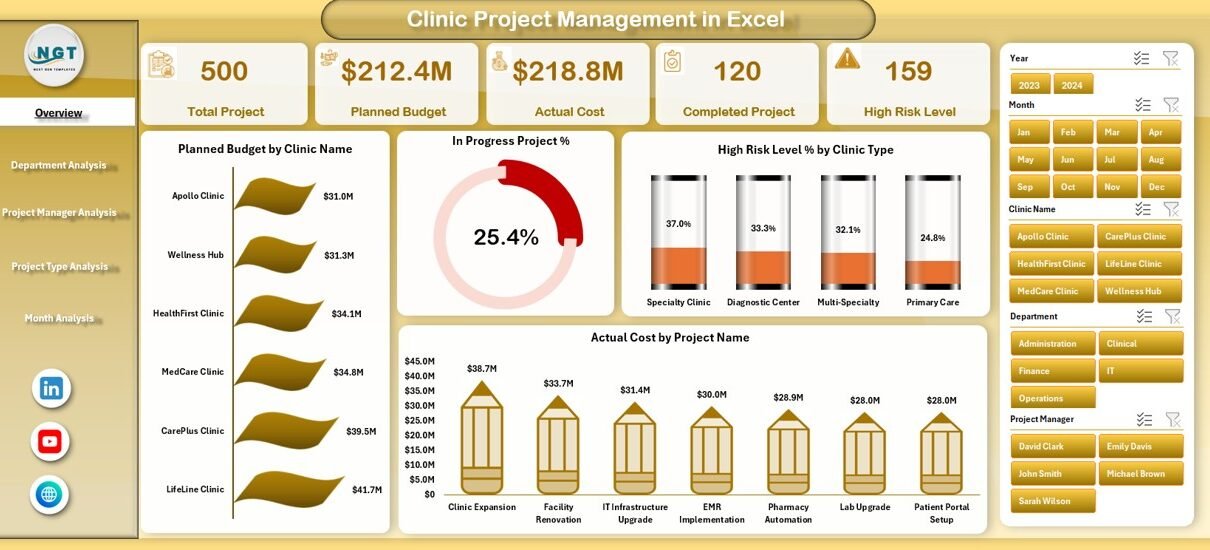
Overview Page: How Can You Get a Complete Project Snapshot?
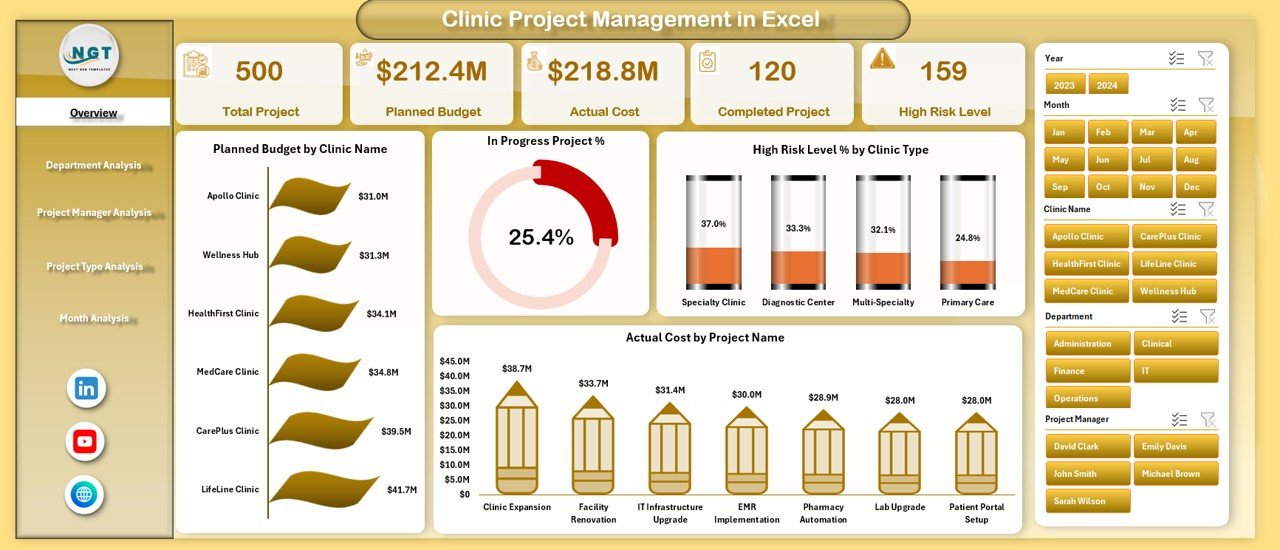
The Overview Page acts as the command center of the dashboard.
Key Highlights of the Overview Page
-
Right-side slicer for quick filtering
-
Four KPI cards for instant insights
-
Four high-impact charts for overall analysis
KPI Cards on the Overview Page
-
Total Planned Budget
-
Total Actual Cost
-
Total Projects
-
High-Risk Project Percentage
Charts on the Overview Page
-
Planned Budget by Clinic Name – Compare budget allocation across clinics
-
In-Progress Project % by Clinic Type – Track ongoing workload
-
High-Risk Level % by Clinic Type – Identify clinics with higher risks
-
Actual Cost by Project Name – Monitor cost-intensive projects
Because everything appears on one screen, leadership teams can make quick, informed decisions.
Department Analysis Page: How Are Departments Performing?
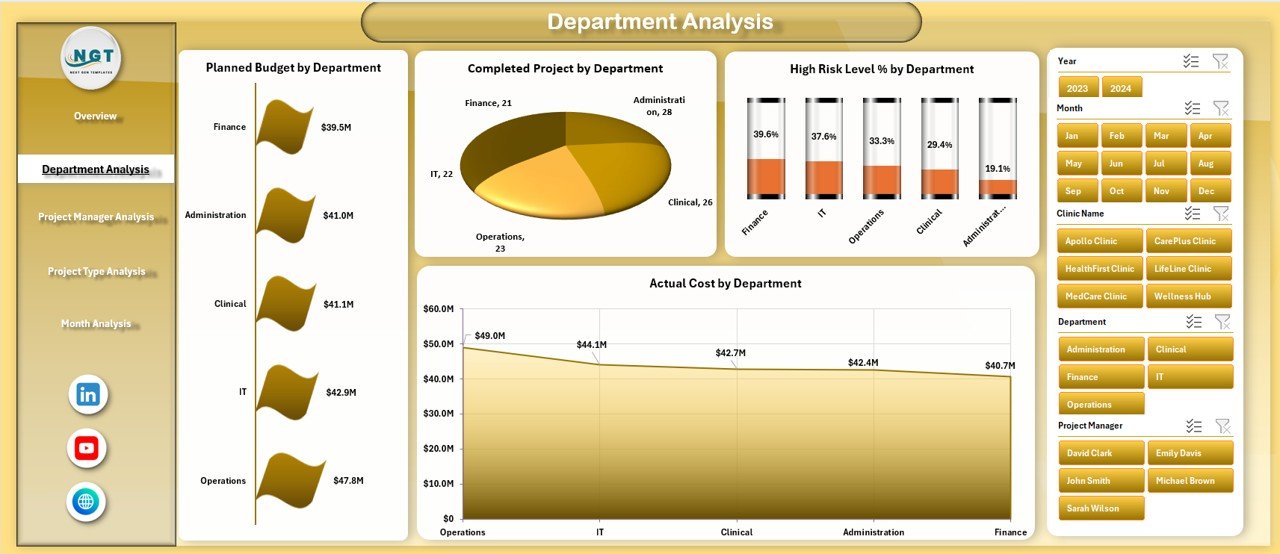
The Department Analysis Page helps clinics evaluate how each department manages its projects.
Key Features of Department Analysis
-
Right-side slicer for department filtering
-
Clear department-wise project performance view
Charts Included
-
Planned Budget by Department – Understand budget distribution
-
Completed Projects by Department – Measure delivery performance
-
High-Risk Level % by Department – Identify risk-prone departments
-
Actual Cost by Department – Control departmental spending
This page allows clinic management to reward high-performing departments and support departments facing challenges.
Project Manager Analysis Page: Who Delivers the Best Results?
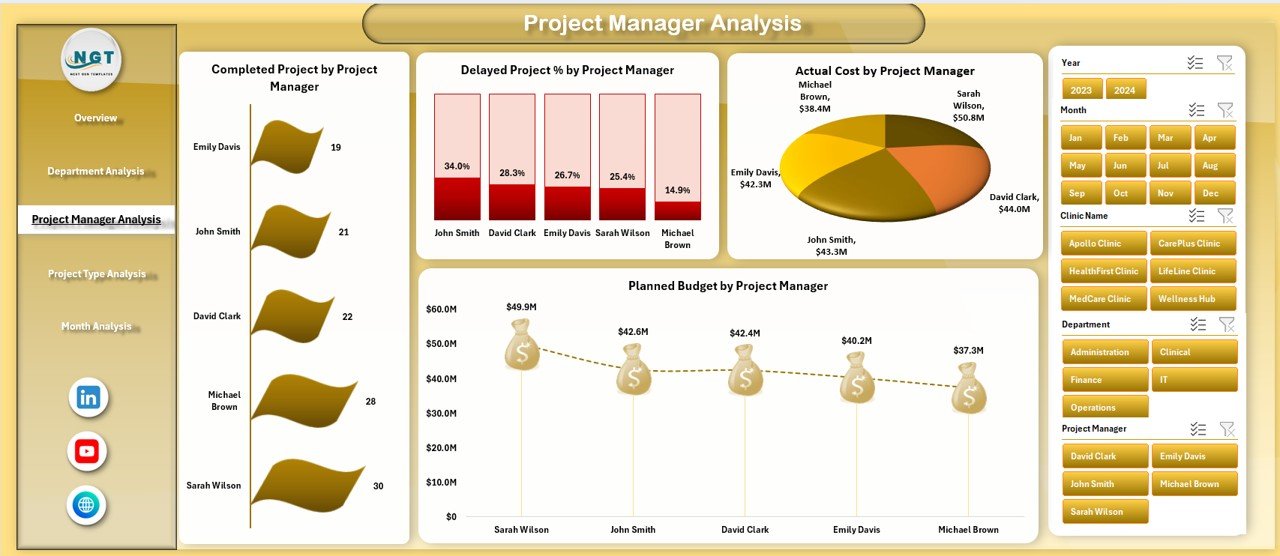
Project success depends heavily on leadership. Therefore, the Project Manager Analysis Page focuses on accountability and performance.
Charts on the Project Manager Analysis Page
-
Completed Projects by Project Manager – Track delivery efficiency
-
Delayed Project % by Project Manager – Identify schedule risks
-
Actual Cost by Project Manager – Monitor cost control
-
Planned Budget by Project Manager – Compare assigned budgets
This analysis helps clinics improve resource allocation, training, and workload balancing.
Click to Purchases Clinic Project Management in Excel
Project Type Analysis Page: Which Projects Carry More Risk?
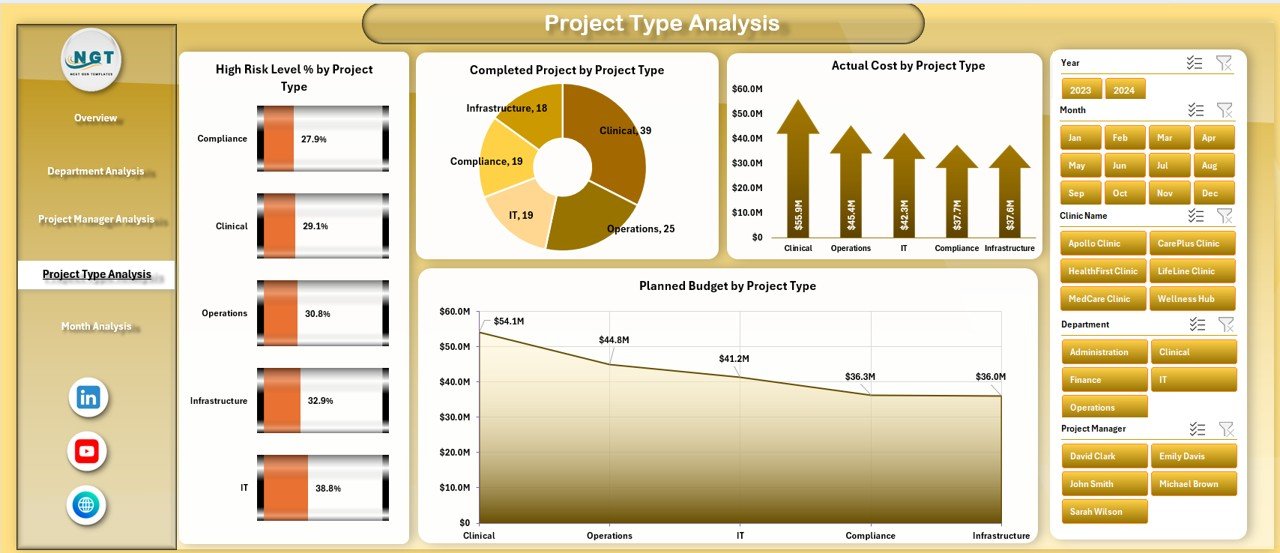
Different project types behave differently. Therefore, this page helps clinics understand performance by project category.
Charts Included
-
High-Risk Level % by Project Type – Identify risk-heavy project types
-
Completed Projects by Project Type – Measure success rates
-
Actual Cost by Project Type – Track spending patterns
-
Planned Budget by Project Type – Analyze budget planning accuracy
As a result, clinics can plan future projects more strategically.
Month Analysis Page: How Do Projects Perform Over Time?
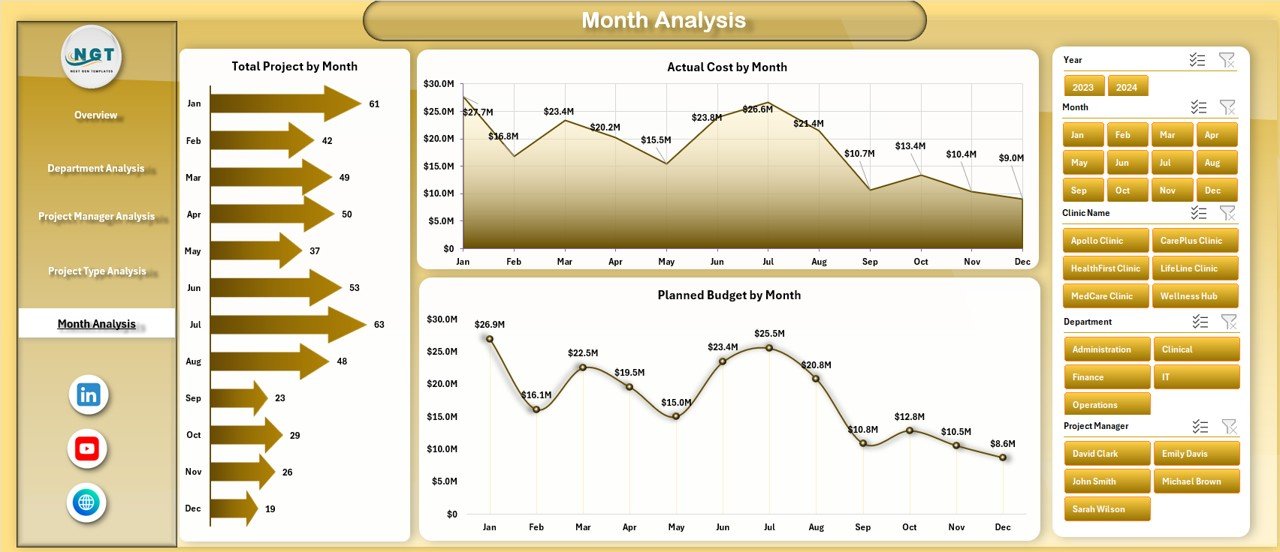
The Month Analysis Page shows time-based trends that support forecasting and planning.
Charts on the Month Analysis Page
-
Total Projects by Month – Track workload trends
-
Actual Cost by Month – Monitor spending patterns
-
Planned Budget by Month – Compare planned vs actual timelines
Because trends matter, this page helps clinics anticipate future resource needs.
What Are the Support Sheet and Data Sheet Used For?
Data Sheet
The Data Sheet stores all raw project data, including:
-
Project Name
-
Clinic Name
-
Department
-
Project Manager
-
Project Type
-
Planned Budget
-
Actual Cost
-
Start Date and End Date
-
Status
-
Risk Level
This sheet acts as the foundation of the entire dashboard.
Support Sheet
The Support Sheet contains:
-
Dropdown lists
-
Validation rules
-
Helper tables for slicers
-
Lookup values
Together, these sheets ensure data accuracy and smooth dashboard performance.
Advantages of Clinic Project Management in Excel
Using Clinic Project Management in Excel delivers several business advantages.
✔ Centralized Project Control
All project information stays in one file, which improves visibility and coordination.
✔ Cost and Budget Transparency
Planned vs actual cost tracking helps clinics prevent budget overruns.
✔ Better Risk Management
High-risk projects get identified early, which reduces surprises.
✔ Improved Accountability
Department-wise and manager-wise views promote responsibility.
✔ Faster Decision-Making
Interactive dashboards replace manual reporting and meetings.
✔ Low Cost and Easy Adoption
Excel-based solutions require no expensive software or training.
How Does Clinic Project Management in Excel Improve Decision-Making?
Clinic leaders need real-time insights, not static reports.
With this dashboard:
-
Decisions rely on data, not assumptions
-
Trends become visible instantly
-
Risks get addressed proactively
-
Performance comparisons become fair and transparent
As a result, clinics operate with confidence and clarity.
Best Practices for Clinic Project Management in Excel
Click to Purchases Clinic Project Management in Excel
To get the best results, clinics should follow proven best practices.
🔹 Maintain Clean Data Entry
Always use standardized formats and dropdown lists.
🔹 Update Data Regularly
Frequent updates ensure accurate dashboards and insights.
🔹 Define Clear Project Status Rules
Standardize status values like Planned, In Progress, Completed, and Delayed.
🔹 Track Risks Consistently
Use uniform criteria to classify risk levels.
🔹 Limit Manual Overrides
Let formulas and calculations run automatically.
🔹 Review Dashboards Monthly
Regular reviews help clinics stay proactive instead of reactive.
Who Can Use Clinic Project Management in Excel?
This solution suits multiple roles, including:
-
Clinic administrators
-
Operations managers
-
Project managers
-
Finance teams
-
Compliance officers
-
Healthcare consultants
Because Excel remains familiar, teams can adopt it quickly.
Is Clinic Project Management in Excel Scalable?
Yes, clinics can scale this dashboard by:
-
Adding new projects and clinics
-
Expanding departments and managers
-
Creating yearly or multi-year tracking
-
Integrating with Power BI later if needed
Therefore, it grows along with clinic operations.
Conclusion: Why Should Clinics Use Project Management in Excel?
Clinic Project Management in Excel provides a simple, powerful, and cost-effective way to manage healthcare projects.
It replaces confusion with clarity, manual work with automation, and guesswork with data-driven insights. Moreover, it empowers clinics to deliver projects on time, within budget, and with lower risk.
For clinics that want better control without complexity, this solution delivers exactly what they need.
Frequently Asked Questions (FAQs)
❓ What is Clinic Project Management in Excel used for?
It helps clinics plan, track, analyze, and control projects using dashboards and structured Excel sheets.
❓ Can small clinics use this dashboard?
Yes, both small and large clinics can use it because Excel scales easily.
❓ Does it require advanced Excel skills?
No, basic Excel knowledge is enough to use and maintain the dashboard.
❓ Can we customize the dashboard?
Yes, clinics can add KPIs, charts, or filters as per their needs.
❓ How often should project data be updated?
Ideally, clinics should update data weekly or monthly for accurate insights.
❓ Is this better than manual project tracking?
Yes, it improves visibility, accuracy, and decision-making significantly.
Visit our YouTube channel to learn step-by-step video tutorials