Introduction
The Co-working Spaces KPI Dashboard is a comprehensive tool designed to monitor and manage the key performance indicators of co-working spaces efficiently. This ready-to-use template is tailored for outsourced accounting KPIs, enabling businesses to track vital metrics with ease and accuracy. Whether you are managing multiple locations or a single co-working facility, this dashboard brings clarity and actionable insights to your financial and operational performance.
Click to Purchases Co-working Spaces KPI Dashboard in Excel
Key Features of Co-working Spaces KPI Dashboard
- Seven fully designed worksheets covering all aspects of KPI tracking and inputs.
- Interactive dropdowns to select months and KPIs for dynamic data visualization.
- Conditional formatting with up/down arrows for quick performance comparison.
- Clear segregation of MTD (Month-To-Date) and YTD (Year-To-Date) actuals, targets, and previous year data.
- Trend analysis charts to observe KPI performance over time.
- Input sheets dedicated to actual numbers, targets, previous year figures, and KPI definitions for easy updating and maintenance.
Dashboard Pages Explanation
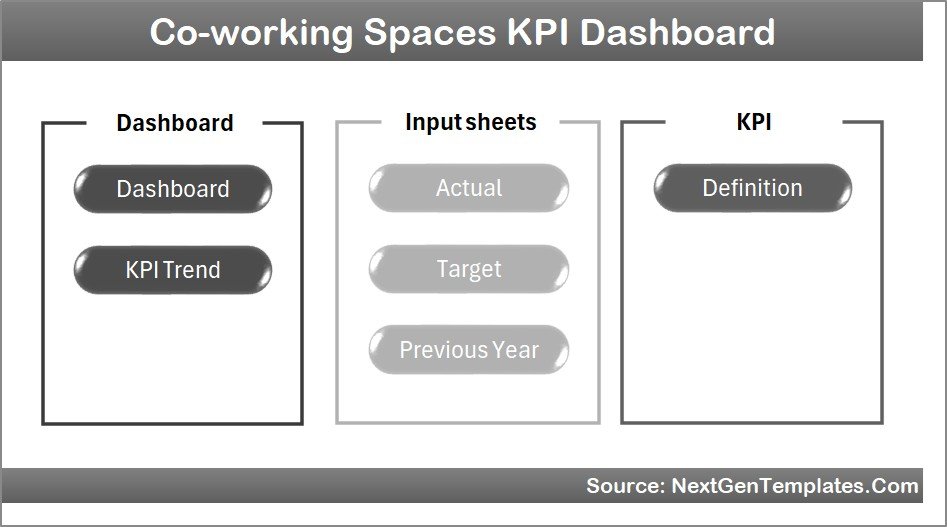
1. Home Sheet
This acts as the index page with six buttons facilitating quick navigation to the respective sheets within the dashboard.
Home Page
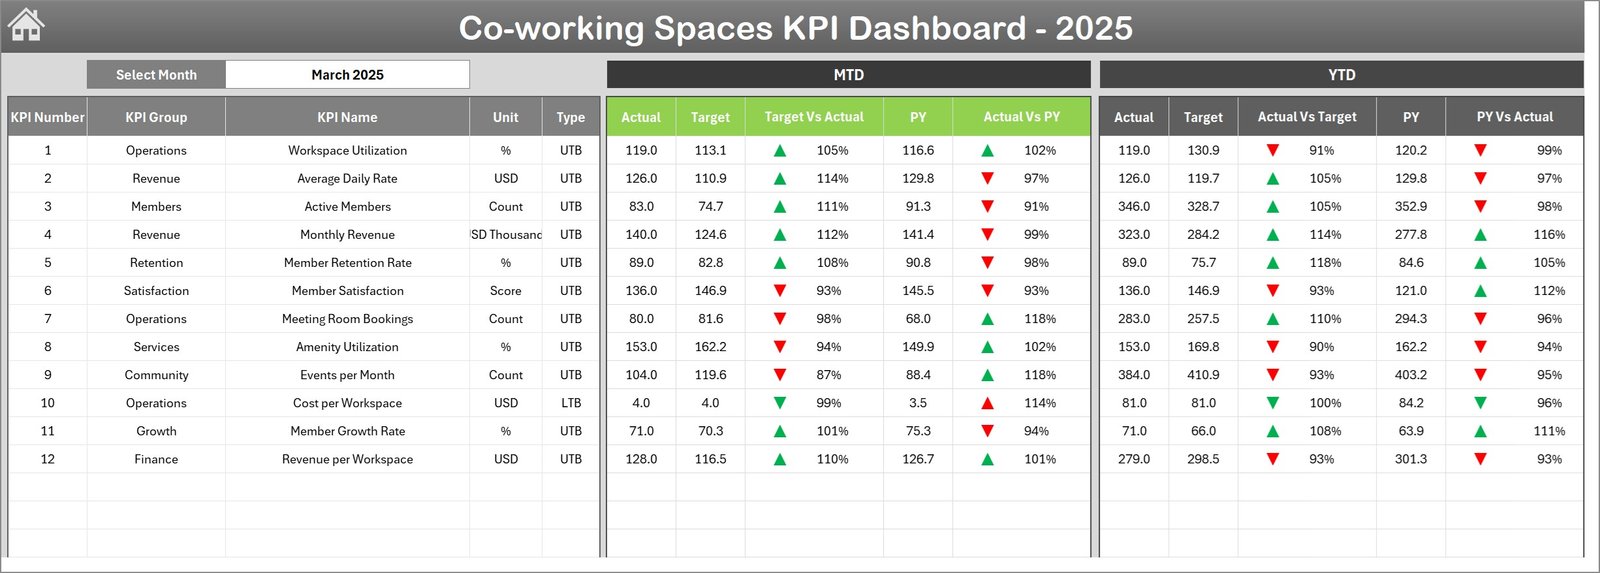
2. Dashboard Sheet Tab
This is the main hub of the dashboard where all KPI information is compiled. A month selector (cell D3) changes the displayed figures dynamically to the selected month.
- Displays MTD Actual, Target, and Previous Year data.
- Shows Target Vs Actual and PY Vs Actual comparisons with conditional formatting featuring up or down arrows.
- Includes YTD Actual, Target, and Previous Year data with similar comparative visual cues.
Co-working Spaces KPI Dashboard
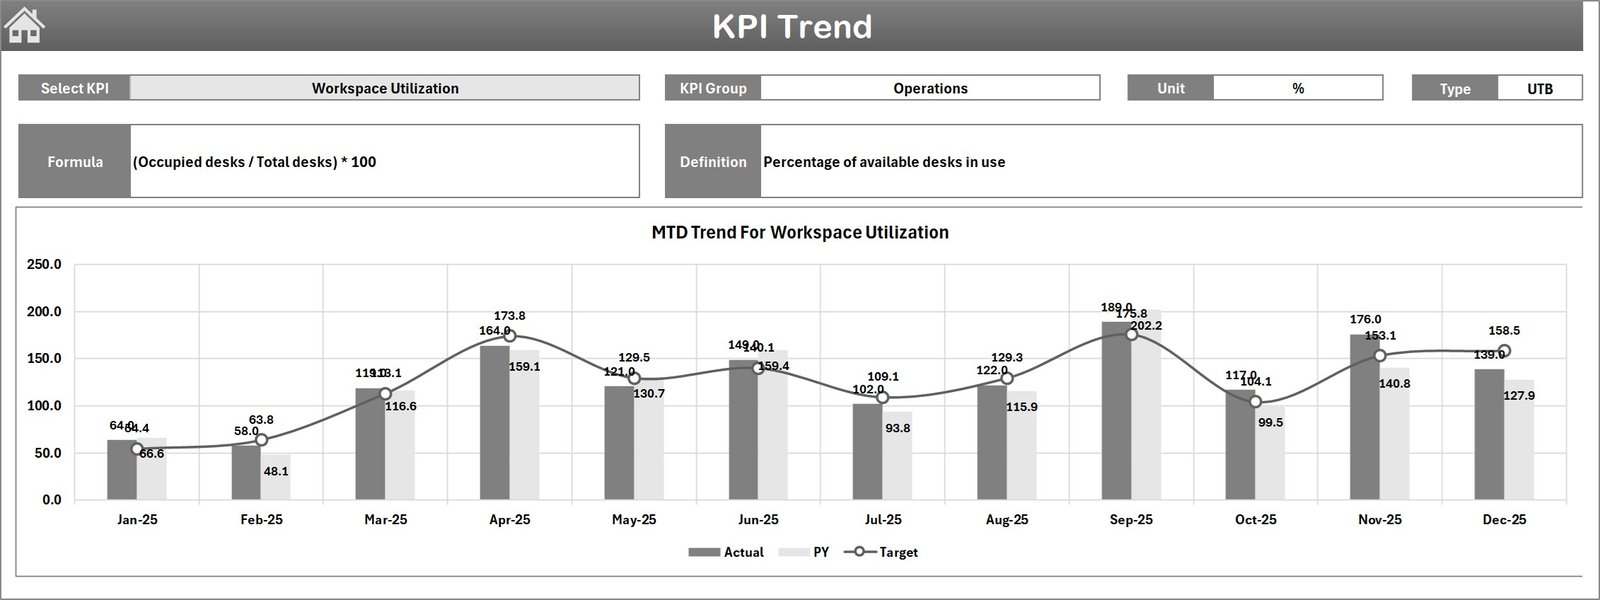
3. KPI Trend Sheet Tab
Enables users to select any KPI from the dropdown in cell C3 and view detailed information about the KPI, including:
- KPI Group
- Unit of measurement
- Type of KPI (Lower The Better or Upper The Better)
- Formula used for calculation
- KPI Definition
Displays MTD and YTD trend charts showing Actual, Target, and Previous Year numbers to facilitate performance tracking.
KPI Trend Sheet
4. Actual Numbers Input Sheet
This sheet is dedicated to entering actual numbers for both YTD and MTD for each month. Users can change the starting month by updating cell E1.
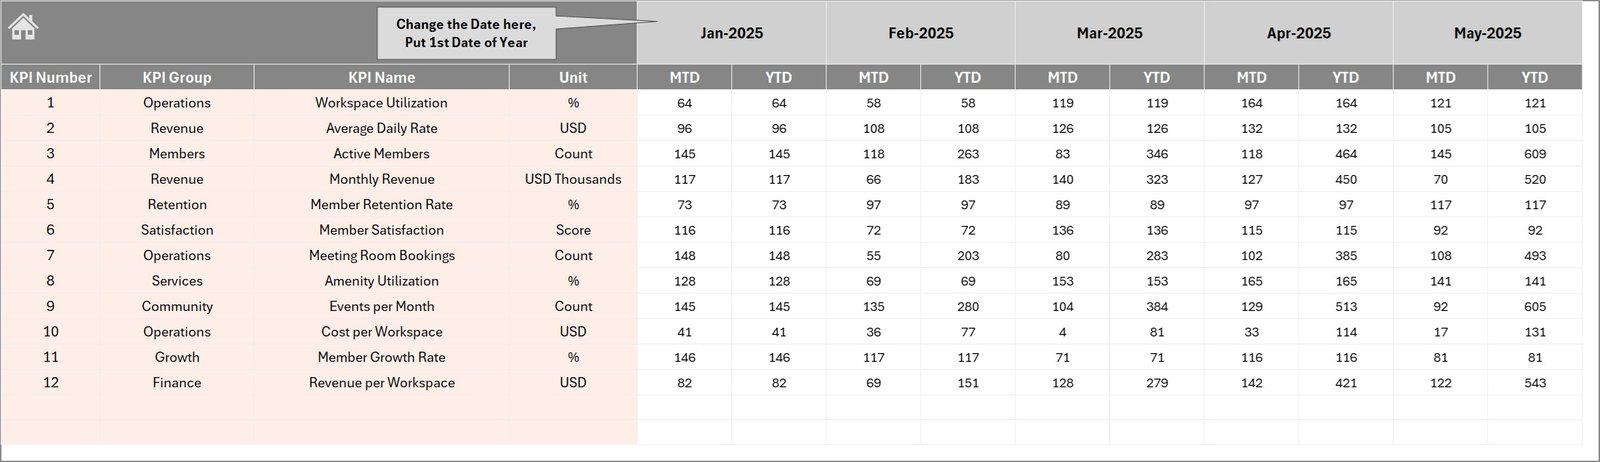
Actual Numbers Input sheet
5. Target Number Input Sheet
Use this sheet to input target figures for each KPI for every month, covering both MTD and YTD intervals.

Target Number Input sheet
6. Previous Year Number Sheet Tab
This sheet is designed for entering the previous year’s KPI numbers in the same format as the current year data for comparative analysis.
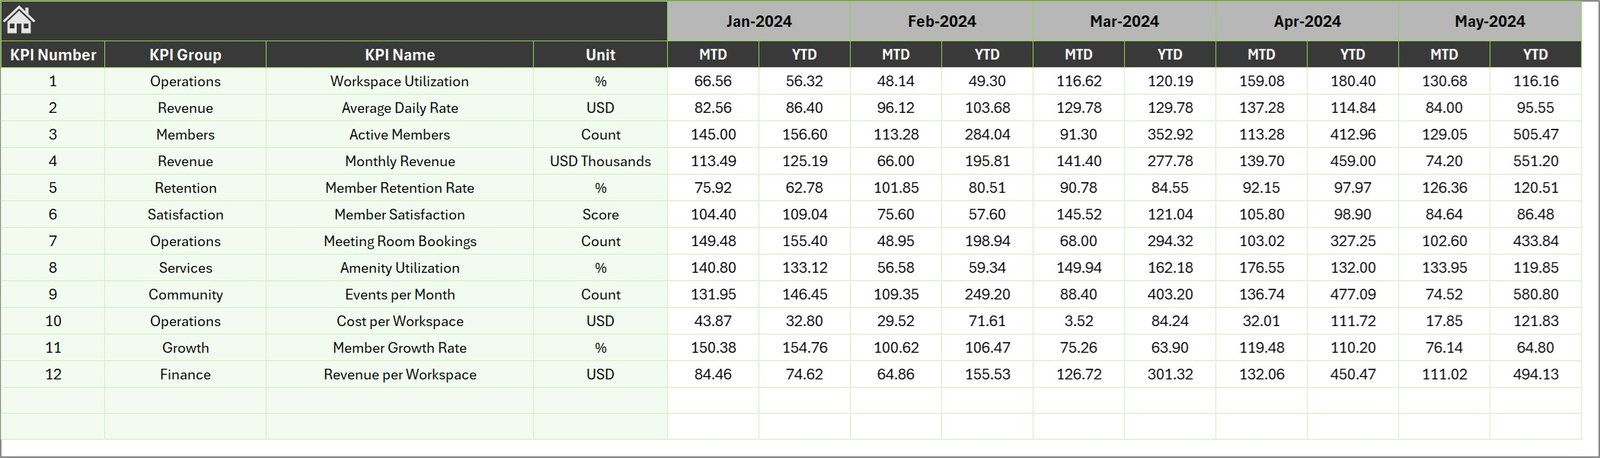
Previous Year Number Input sheet
7. KPI Definition Sheet Tab
This tab allows you to maintain the list of KPIs with detailed attributes including name, group, unit, formula, definition, and type (LTB: Lower The Better or UTB: Upper The Better).

KPI Definition sheet
Advantages of Co-working Spaces KPI Dashboard
- Efficiency: Streamlines KPI management by consolidating all relevant data into one interactive file.
- Visibility: Immediate insight into both monthly and yearly performances supported by clear visual indicators.
- Data Accuracy: Structured input sheets minimize errors and maintain data integrity.
- Customizability: Easily adapt KPIs, targets, and definitions to fit various business models.
- Informed Decision Making: Access to trend analyses supports strategic planning and operational adjustments.
Opportunities for Improvement
- Incorporate automated data import from accounting systems to reduce manual input.
- Add more interactive charts such as heat maps for spatial performance analysis across multiple co-working locations.
- Enable multi-user collaboration with version control to support team-based management.
- Integrate alerting features to notify stakeholders when KPIs hit critical thresholds.
Best Practices
- Regularly update actual, target, and previous year data to maintain real-time relevance.
- Use the trend sheet to review KPI progress monthly and adjust targets accordingly.
- Define clear KPI formulas and units in the KPIs Definition sheet to avoid confusion.
- Leverage the dashboard’s conditional formatting to quickly identify performance gaps and successes.
- Train team members on navigating between sheets using the Home tab for efficient use.
FAQs
What KPI categories does this dashboard cover?
The dashboard is customizable for any KPI relevant to co-working spaces such as occupancy rate, revenue per seat, customer satisfaction rates, and more.
Can this dashboard handle multiple co-working locations?
While the current template focuses on consolidated data, it can be customized to differentiate between locations by adding additional input and filter options.
Is prior Excel knowledge required to use this dashboard?
Basic familiarity with Excel navigation and data entry is helpful but the dashboard’s interactive design and the Home sheet buttons make it user-friendly.
Click to Purchases Co-working Spaces KPI Dashboard in Excel
Conclusion
The Co-working Spaces KPI Dashboard is an indispensable tool for managers and accountants seeking to optimize their operational and financial oversight. By consolidating vital data inputs alongside visually dynamic outputs, this dashboard empowers stakeholders with actionable insights. Whether you’re tracking month-over-month trends or closely comparing actuals versus targets, this template enhances transparency, efficiency, and proactive decision making.
To learn more about leveraging Excel dashboards for your business needs, visit the official Microsoft Excel support page for advanced dashboard tips and tutorials.
Visit our YouTube channel to watch the demo.