Cold chain logistics plays a critical role in industries like pharmaceuticals, food & beverages, biotechnology, and chemicals. However, managing temperature-sensitive shipments without structured reporting creates serious risks. Delays damage products. Temperature fluctuations cause losses. Poor visibility increases costs.
Therefore, companies need a centralized, real-time monitoring solution. The Cold Chain Logistics Dashboard in Power BI solves this challenge. It converts raw shipment data into meaningful visual insights. As a result, logistics managers track performance, control costs, protect product quality, and improve profitability.
In this comprehensive guide, you will learn:
- What a Cold Chain Logistics Dashboard in Power BI is
- Why cold chain monitoring matters
- Detailed explanation of all 5 dashboard pages
- Key KPIs tracked in the dashboard
- Advantages of using this dashboard
- Best practices for implementation
- Frequently Asked Questions with answers
Click to buy Cold Chain Logistics Dashboard in Power BI
What Is a Cold Chain Logistics Dashboard in Power BI?
A Cold Chain Logistics Dashboard in Power BI is an interactive reporting solution built inside Microsoft Power BI. It tracks shipments that require temperature control throughout transportation and storage.
Instead of reviewing multiple spreadsheets manually, managers analyze:
- Total Shipments
- Revenue Amount
- Cost Amount
- Profit Amount
- Delivered Shipment %
- Profit Margin %
- In-Transit and Delayed Shipments
Moreover, the dashboard allows filtering using slicers. Therefore, users can analyze performance by:
- Month
- Product Type
- Carrier Name
- Origin Country
- Destination Country
As a result, decision-makers gain complete visibility in seconds.
Why Does Cold Chain Logistics Need Structured Analytics?
Cold chain operations involve strict temperature compliance. Even a small deviation damages goods. Therefore, companies must monitor every shipment closely.
However, without analytics:
- Managers miss delivery delays
- Costs increase without visibility
- Carrier performance remains unclear
- Profit margins decline silently
On the other hand, when you use a structured Power BI dashboard:
- You identify delays instantly
- You compare carrier performance
- You track profitability by country
- You monitor monthly trends
- You improve operational efficiency
Consequently, businesses protect product quality and increase profits.
Key Features of Cold Chain Logistics Dashboard in Power BI
This dashboard includes 5 powerful analytical pages inside the Power BI Desktop file. Each page focuses on a specific operational area.
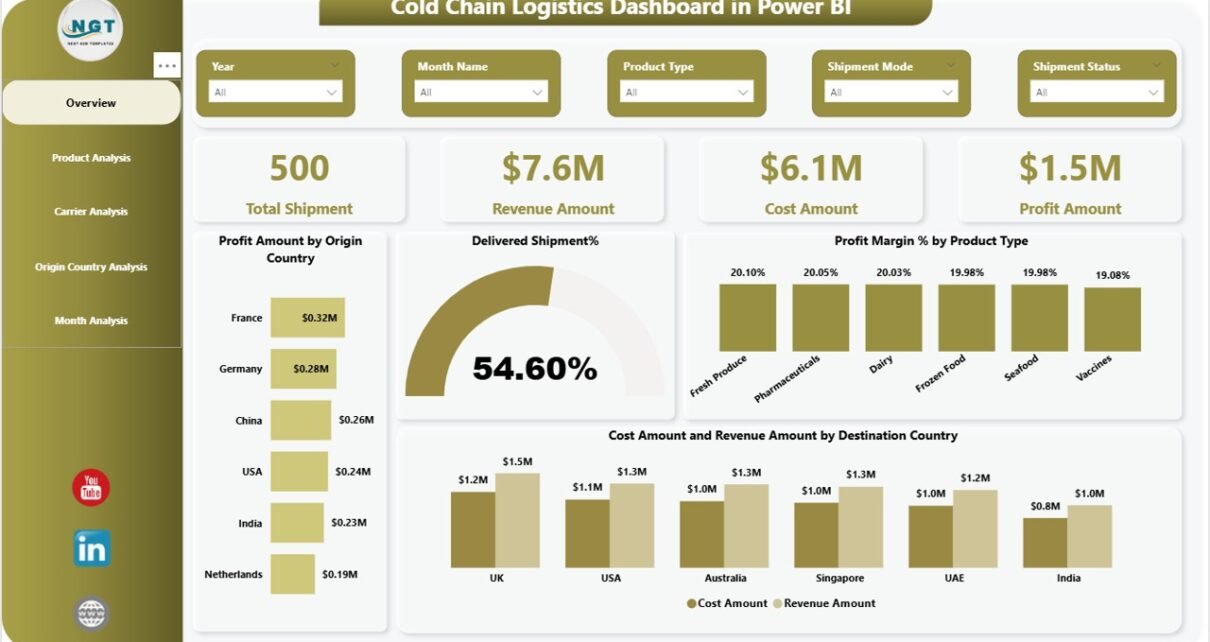
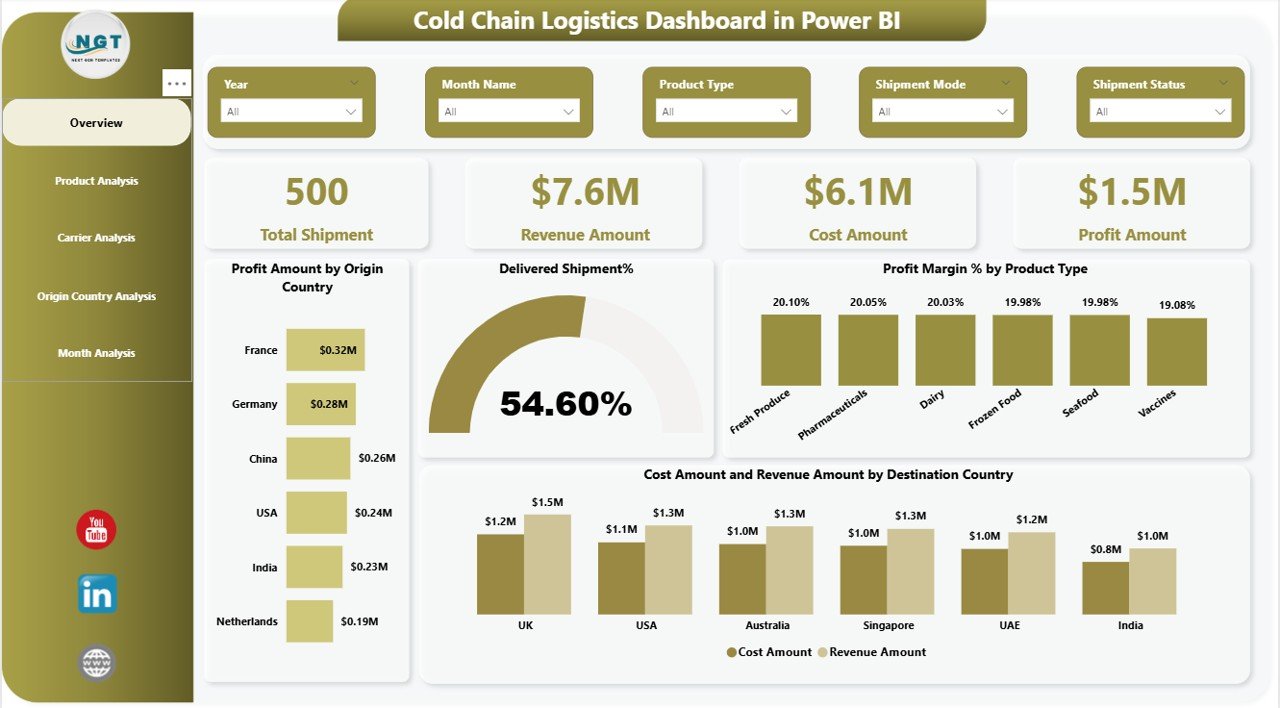
Overview Page – What Is the Overall Performance?
The Overview Page serves as the central control panel.
KPI Cards (5 Key Indicators)
At the top, you see 5 powerful KPI cards:
- Total Shipment
- Revenue Amount
- Cost Amount
- Profit Amount
- Delivered Shipment %
These cards provide instant performance visibility.
Charts Included in Overview
- Profit Amount by Origin Country
This chart highlights which countries generate maximum profit. Therefore, managers can focus on high-performing regions.
- Delivered Shipment %
This metric shows delivery success rate. Higher percentage means better operational reliability.
- Profit Margin % by Product Type
This chart identifies which product categories generate stronger margins.
- Cost Amount & Revenue Amount by Destination Country
This comparison chart reveals whether destination-wise operations remain profitable.
As a result, executives quickly understand financial health and operational efficiency.
Click to buy Cold Chain Logistics Dashboard in Power BI
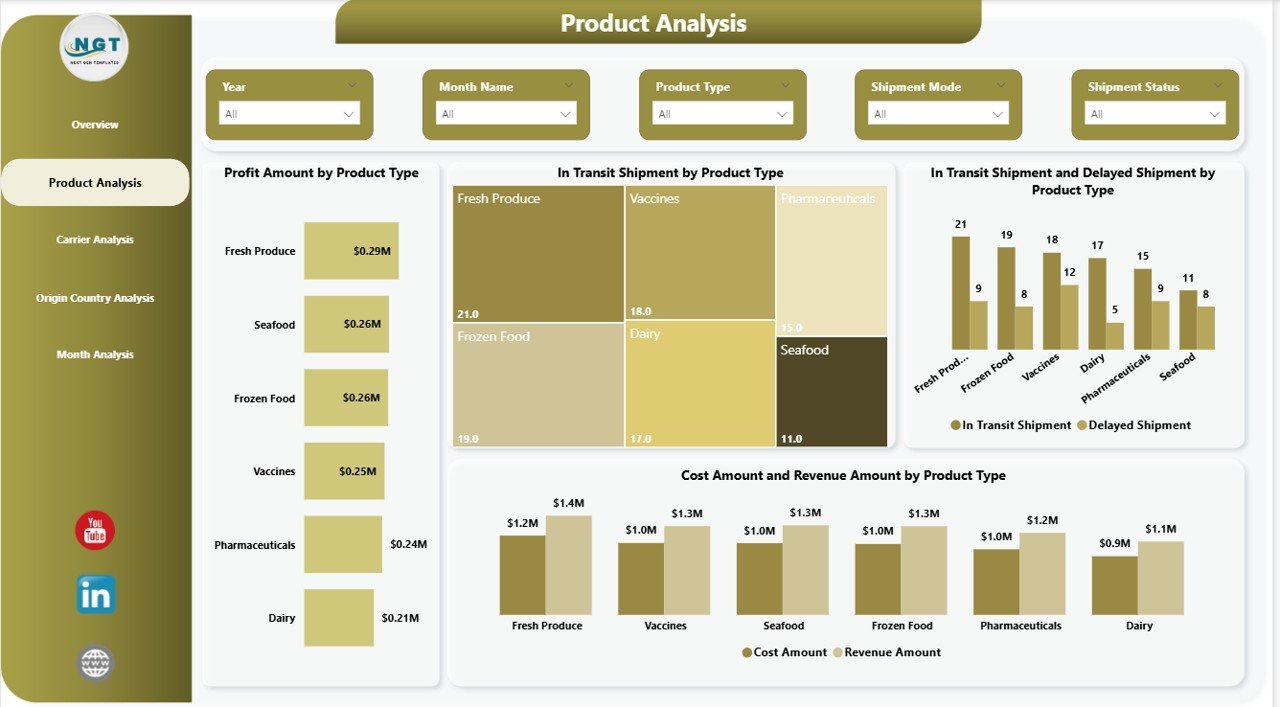
Product Analysis – Which Products Perform Best?
Cold chain logistics handles multiple product types such as:
- Pharmaceuticals
- Vaccines
- Dairy
- Frozen Foods
- Biotech Products
Therefore, product-level tracking becomes essential.
Charts in Product Analysis Page
- Profit Amount by Product Type
This chart reveals which products generate the highest returns.
- In-Transit Shipment by Product Type
This metric shows operational workload distribution.
- In-Transit & Delayed Shipment by Product Type
This visual highlights product categories facing delays.
- Cost & Revenue by Product Type
This comparison allows margin evaluation.
Consequently, logistics managers optimize product handling strategies.
Click to buy Cold Chain Logistics Dashboard in Power BI
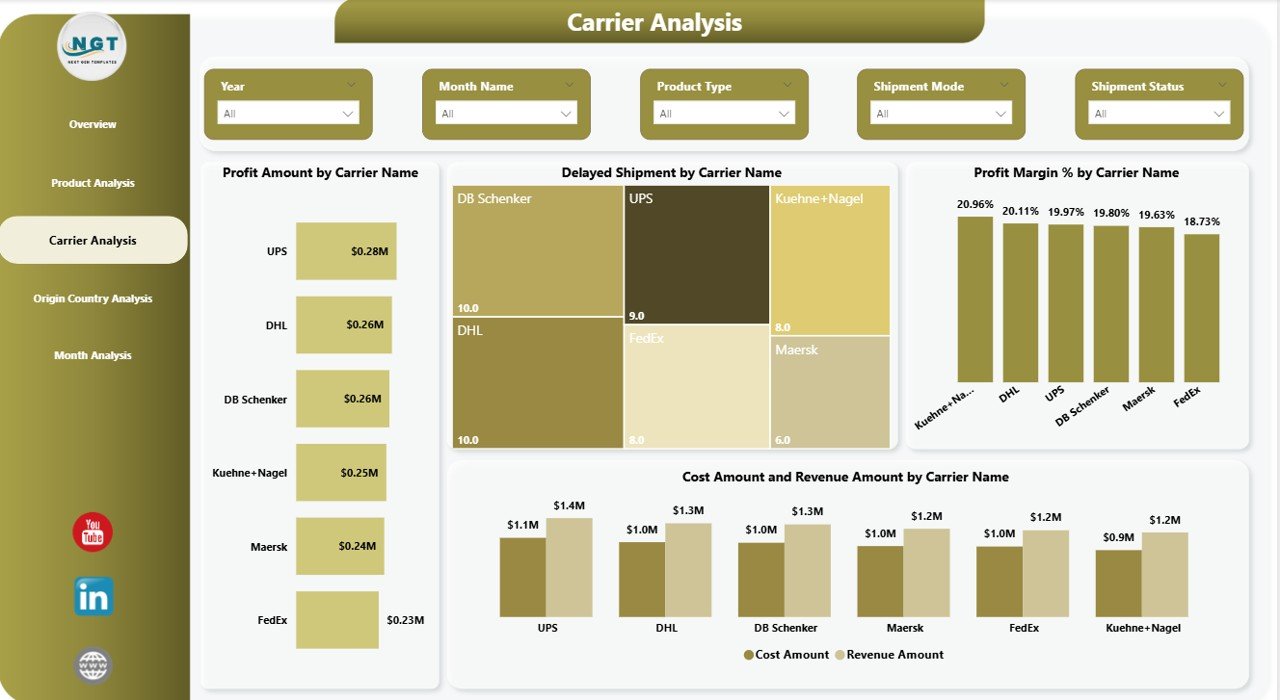
Carrier Analysis – Which Carrier Performs Better?
Carriers directly impact delivery time and cost efficiency. Therefore, analyzing carrier performance remains critical.
- Charts in Carrier Analysis Page
- Profit Amount by Carrier Name
- Identify which carrier contributes most to profit.
- Delayed Shipment by Carrier Name
- Spot carriers causing delivery issues.
- Profit Margin % by Carrier Name
- Compare cost efficiency across carriers.
- Cost & Revenue by Carrier Name
- Understand financial performance by transportation partner.
As a result, management negotiates better contracts and improves service quality.
Click to buy Cold Chain Logistics Dashboard in Power BI
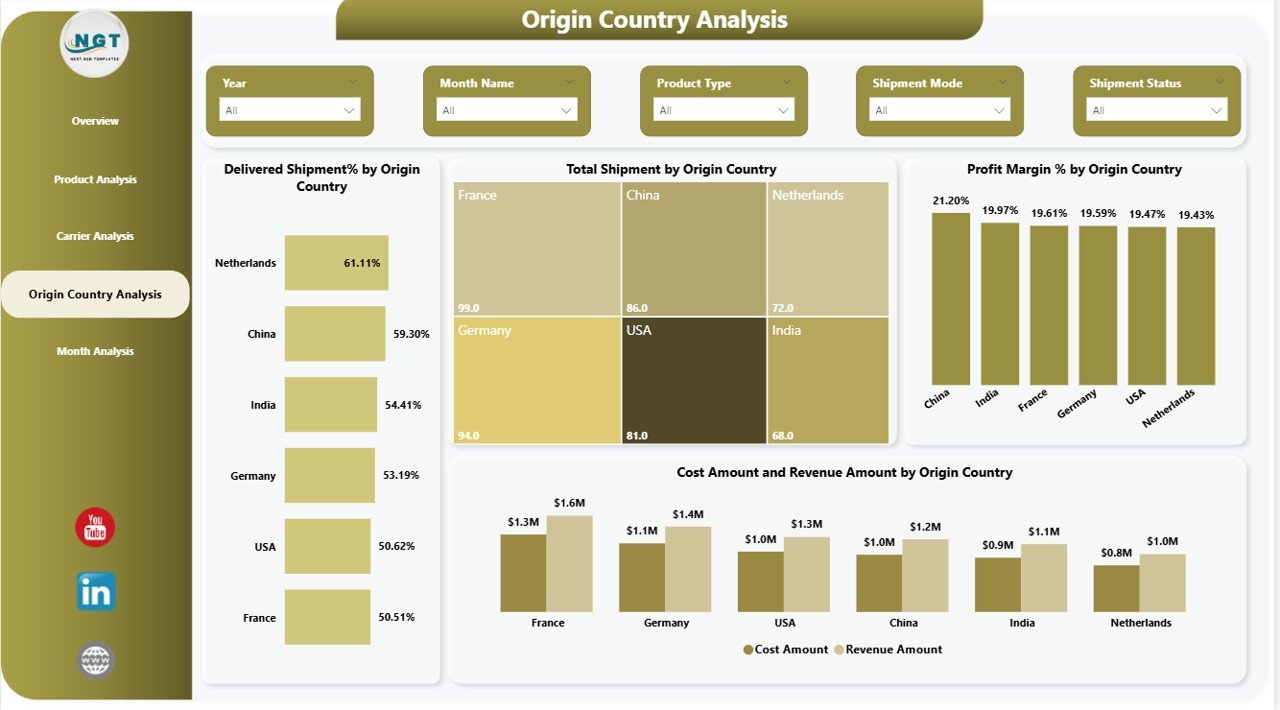
Origin Country Analysis – Where Do Shipments Start?
Origin country performance plays a major role in profitability.
Charts Included
- Delivered Shipment % by Origin Country
This reveals country-wise delivery reliability.
- Total Shipment by Origin Country
Shows shipment volume distribution.
- Profit Margin % by Origin Country
Highlights profitable sourcing regions.
- Cost & Revenue by Origin Country
Provides financial comparison.
Therefore, companies improve sourcing decisions strategically.
Click to buy Cold Chain Logistics Dashboard in Power BI
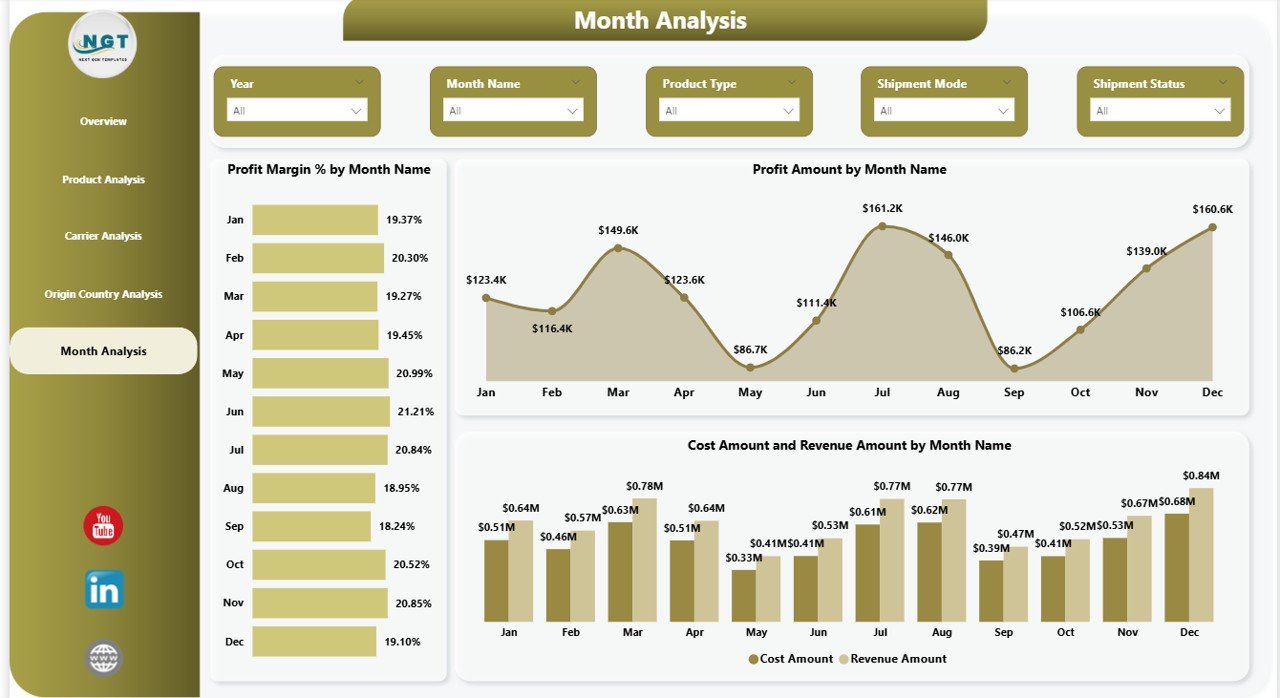
Month Analysis – How Does Performance Change Over Time?
Time-based analysis helps identify seasonal patterns.
Charts in Month Analysis
- Profit Margin % by Month Name
Identify profitable months.
- Profit Amount by Month Name
Understand financial growth trends.
- Cost & Revenue by Month Name
Compare monthly operational performance.
Consequently, managers plan budgets and optimize seasonal strategies.
Click to buy Cold Chain Logistics Dashboard in Power BI
What Key KPIs Does This Dashboard Track?
The dashboard monitors critical cold chain metrics:
- Total Shipment
- Delivered Shipment %
- In-Transit Shipment
- Delayed Shipment
- Revenue Amount
- Cost Amount
- Profit Amount
- Profit Margin %
These KPIs ensure operational transparency.
Advantages of Cold Chain Logistics Dashboard in Power BI
Using this dashboard offers multiple benefits.
- Real-Time Visibility
Managers monitor shipments instantly.
- Improved Profitability
You identify loss-making regions quickly.
- Better Carrier Decisions
Carrier comparison improves contract negotiations.
- Reduced Operational Risk
Delay tracking minimizes product damage risk.
- Data-Driven Decisions
Executives rely on facts instead of assumptions.
- Centralized Reporting
Everything stays inside one interactive Power BI file.
Best Practices for Cold Chain Logistics Dashboard
To maximize results, follow these best practices:
- Ensure Data Accuracy
Always validate shipment data before importing.
- Update Data Regularly
Use scheduled refresh for up-to-date insights.
- Monitor Delivery % Frequently
Act immediately when delivery rate drops.
- Compare Carriers Quarterly
Review carrier performance every quarter.
- Focus on High-Margin Products
Allocate resources strategically.
- Use Slicers Effectively
Filter by month, country, or product for deeper insights.
Who Can Benefit from This Dashboard?
This dashboard helps:
- Logistics Managers
- Supply Chain Directors
- Cold Storage Operators
- Pharmaceutical Companies
- Food & Beverage Distributors
- Export/Import Companies
Therefore, any business handling temperature-sensitive goods gains value.
How Does This Dashboard Improve Decision-Making?
The dashboard connects financial data with operational metrics. Therefore, managers:
- Detect inefficiencies faster
- Improve shipment reliability
- Control costs
- Increase revenue
- Strengthen profitability
As a result, the company builds a competitive advantage.
Conclusion
Cold chain logistics requires precision, speed, and visibility. Without analytics, companies face delays, product damage, and rising costs. However, the Cold Chain Logistics Dashboard in Power BI transforms chaos into clarity.
It tracks shipments, monitors profitability, evaluates carriers, and analyzes monthly trends. Moreover, it empowers managers to act confidently.
If your organization manages temperature-sensitive goods, this dashboard will enhance performance, reduce risk, and increase profitability.
Frequently Asked Questions (FAQs)
- What industries use a Cold Chain Logistics Dashboard?
Pharmaceutical, food & beverage, biotechnology, dairy, frozen food, and chemical industries use it.
- Can I customize this dashboard?
Yes. You can customize KPIs, filters, and visuals based on business needs.
- Does this dashboard support real-time data?
Yes. Power BI supports scheduled refresh and live connections.
- Can I track delayed shipments easily?
Yes. The dashboard includes delayed shipment analysis by product and carrier.
- How does this dashboard improve profitability?
It identifies high-cost routes, inefficient carriers, and low-margin products. Therefore, managers take corrective action quickly.
- Is technical knowledge required to use this dashboard?
Basic knowledge of Power BI helps. However, interactive visuals make navigation easy.
Visit our YouTube channel to learn step-by-step video tutorials
Watch the step-by-step video tutorial:
Click to buy Cold Chain Logistics Dashboard in Power BI