In today’s publishing world, success depends not only on creativity but also on data-driven insights. The comic book and publishing industry thrives on audience engagement, production efficiency, and sales performance — and monitoring all of these requires a clear and structured approach.
The Comic Books and Publishing KPI Dashboard in Excel provides that clarity. It helps publishers, editors, illustrators, and marketers track their creative, production, and sales metrics all in one place. With an interactive dashboard built entirely in Microsoft Excel, publishers can understand how each title performs, where production stands, and what business areas need improvement.
Instead of scattered spreadsheets and manual tracking, this ready-to-use dashboard organizes everything — from creative output to distribution performance — into easy-to-read charts and KPI summaries. Whether you manage an independent comic label or a global publishing house, this tool ensures your storytelling success is supported by strong operational analytics.
Click to Purchases Comic Books and Publishing KPI Dashboard in Excel
What Is a Comic Books and Publishing KPI Dashboard in Excel?
A Comic Books and Publishing KPI Dashboard is an Excel-based management system designed to monitor and analyze key performance indicators (KPIs) across creative, editorial, and business functions.
It transforms traditional data tables into an interactive visual dashboard, showing trends, comparisons, and goal achievement status through conditional formatting, color indicators, and dynamic charts.
This dashboard enables teams to:
-
Track month-to-month performance.
-
Compare actual results with targets and previous years.
-
Visualize trends for each KPI group (Sales, Production, Marketing, Distribution, etc.).
-
Ensure that each creative and business metric aligns with the company’s publishing goals.
Key Features of the Dashboard
The Comic Books and Publishing KPI Dashboard includes seven structured worksheet tabs, each serving a unique purpose.
1️⃣ Home Sheet

The Home Sheet functions as the index page of the entire dashboard.
It includes six navigation buttons that allow users to jump directly to the desired worksheet, such as the Dashboard, KPI Trend, or Data Input sheets.
This design ensures smooth navigation — especially useful for publishing teams that handle large volumes of KPIs or multiple titles simultaneously.
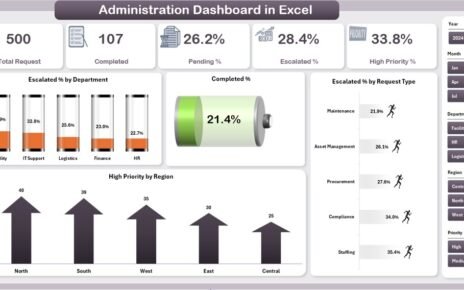
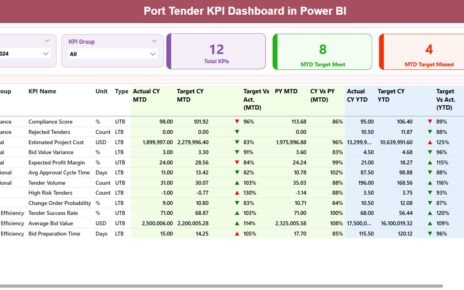
2️⃣ Dashboard Sheet Tab

This is the main analytical page where all KPI results come together.
At the top, users can select a month from the drop-down list (cell D3) to update the entire dashboard instantly. Once a month is selected, the dashboard recalculates and displays all updated metrics.
The dashboard showcases both Month-to-Date (MTD) and Year-to-Date (YTD) performance:
-
MTD Actual, Target, and Previous Year data
-
YTD Actual, Target, and Previous Year data
-
Target vs Actual comparison (% values)
-
PY vs Actual comparison (% values)
Each of these metrics uses conditional formatting with upward (▲ green) and downward (▼ red) arrows to instantly communicate progress or decline.
This page gives executives, editors, and financial teams a complete overview of how the business is performing across key creative and operational metrics.
Click to Purchases Comic Books and Publishing KPI Dashboard in Excel
3️⃣ KPI Trend Sheet Tab

The KPI Trend Sheet allows detailed performance tracking for each KPI over time.
On this sheet, users can select a KPI Name from a drop-down menu (cell C3) to view its full performance history and metadata, including:
-
KPI Group (e.g., Sales, Production, Marketing)
-
Unit of Measurement (e.g., %, Copies, Days)
-
Type (UTB – Upper the Better, LTB – Lower the Better)
-
Formula used for calculation
-
Definition or description of the KPI
Below this, two combo charts display the MTD and YTD trend lines for Actual, Target, and Previous Year numbers. These visuals make it easy to spot growth trends or potential issues early.
4️⃣ Actual Numbers Input Sheet

This sheet collects all actual performance data.
Users simply input the actual values for MTD and YTD for each KPI corresponding to a specific month.
A month selector in cell E1 allows users to define the first month of the financial year, automatically adjusting the period sequence across the workbook.
This design simplifies updates and ensures data remains organized and consistent every month.
5️⃣ Target Sheet Tab

The Target Sheet defines the performance goals for each KPI.
Users input both MTD and YTD targets for all KPIs.
These targets form the basis of all comparisons and visual indicators in the main dashboard. Having clear targets ensures alignment between creative production schedules, marketing objectives, and financial goals.
6️⃣ Previous Year Number Sheet Tab

To evaluate growth and trend patterns, this sheet records previous year data for the same KPIs and timeframes.
By comparing current performance with historical numbers, publishers can measure year-over-year progress — essential for understanding reader engagement, production efficiency, and sales expansion.
7️⃣ KPI Definition Sheet Tab

This sheet serves as the reference library for all KPI definitions.
It includes:
-
KPI Name
-
KPI Group
-
Unit
-
Formula
-
KPI Definition
Having a dedicated sheet for definitions ensures all users interpret metrics consistently — vital for organizations that involve multiple departments or teams.
Click to Purchases Comic Books and Publishing KPI Dashboard in Excel
Examples of KPIs in Comic Book and Publishing Industry
Some practical KPIs you can track using this dashboard include:
-
Issue Release Timeliness (% of on-schedule releases)
-
Printing Cost per Issue (USD)
-
Average Time from Script to Print (Days)
-
Number of Titles Published (Monthly/Yearly)
-
Sales per Title (Units)
-
Digital vs Print Sales Ratio (%)
-
Customer Satisfaction Rating (%)
-
Marketing Campaign ROI (%)
-
Subscription Renewal Rate (%)
-
Production Error Rate (%)
-
Distribution Delay (%)
By analyzing these KPIs regularly, publishers can ensure smoother operations, higher profitability, and greater reader satisfaction.
Advantages of Comic Books and Publishing KPI Dashboard in Excel
The dashboard delivers numerous operational and strategic benefits:
📘 1. Centralized Performance View
Brings together creative, editorial, and financial metrics in one unified Excel dashboard.
📊 2. Real-Time Monitoring
Instantly updates visuals and charts as soon as new data is entered.
💡 3. Transparent Decision-Making
Provides clear insights for editors, finance teams, and marketing heads to align decisions.
🕓 4. Time Savings
Automates calculations for MTD, YTD, and target comparisons, saving manual effort.
📈 5. Improved Accountability
Each KPI highlights responsible departments and progress, promoting ownership.
🎯 6. Easy Customization
Easily add new KPIs, titles, or departments without rebuilding the dashboard.
🧩 7. Enhanced Collaboration
Multiple departments can contribute to the same Excel file, fostering teamwork.
How It Supports the Publishing Workflow
The dashboard aligns with the entire publishing process — from ideation to sales analysis.
-
Editorial Teams: Track manuscript throughput and editing efficiency.
-
Design & Production Teams: Monitor print schedules and cost variances.
-
Marketing Teams: Evaluate campaign effectiveness and ROI.
-
Finance Teams: Compare revenue vs cost performance.
-
Management: Gain a holistic view of all publishing activities.
By turning performance data into actionable insights, this dashboard helps publishers deliver both creative excellence and business growth.
Click to Purchases Comic Books and Publishing KPI Dashboard in Excel
Opportunities for Improvement
Although the dashboard is powerful, continual enhancements can make it even more valuable:
-
Add automatic data imports from accounting or sales systems.
-
Include genre-wise breakdowns (Superhero, Manga, Graphic Novel).
-
Add forecasting models using Excel formulas or Power Query.
-
Introduce visual storytelling metrics (reader engagement by story arc).
-
Create a mobile-friendly version using Power BI or Google Sheets integration.
Best Practices for Using the Dashboard
Follow these practices to ensure accurate, meaningful analysis:
1️⃣ Update data regularly – Enter actuals and targets monthly without delays.
2️⃣ Validate data sources – Cross-check inputs for consistency and accuracy.
3️⃣ Use consistent KPI definitions – Keep terminology uniform across sheets.
4️⃣ Leverage conditional formatting – Highlight underperforming KPIs visually.
5️⃣ Back up data monthly – Keep historical copies for audit and reference.
6️⃣ Train users – Educate editors, finance, and marketing teams on how to interpret KPIs.
7️⃣ Expand gradually – Start with key metrics and expand as data maturity grows.
Following these practices helps maintain credibility and long-term usability of the dashboard.
Step-by-Step: How to Use the Comic Books and Publishing Dashboard
-
Open the Excel file.
-
Go to the Home sheet and use buttons to navigate to different sections.
-
Select the current month from the drop-down (cell D3) in the Dashboard sheet.
-
Review the KPI cards and charts to analyze performance.
-
Drill down to the KPI Trend sheet for individual metric tracking.
-
Update Actual, Target, and Previous Year sheets monthly.
-
Refer to KPI Definition sheet for understanding formulas or definitions.
This process ensures your publishing team stays synchronized and focused on the right performance goals.
Conclusion
The Comic Books and Publishing KPI Dashboard in Excel empowers publishers to bridge creativity and analytics. It translates raw data into visual stories about performance — revealing how production, marketing, and sales align with business goals.
By combining ease of use with analytical depth, this Excel-based solution offers a complete 360-degree view of your publishing operations. It helps you understand trends, control costs, enhance output quality, and grow your readership strategically.
For every comic creator or publishing manager aiming for measurable success, this dashboard is the perfect companion for smarter, data-driven storytelling.
Click to Purchases Comic Books and Publishing KPI Dashboard in Excel
Frequently Asked Questions (FAQs)
1. What is the main purpose of this dashboard?
It tracks and analyzes key performance indicators related to publishing, sales, production, and marketing for comic books and related publications.
2. Can it handle multiple comic titles?
Yes. You can add or filter KPIs for multiple titles, series, or publishing categories.
3. Is the dashboard suitable for digital-only publishers?
Absolutely. You can track digital sales, downloads, and web traffic alongside print performance.
4. Do I need advanced Excel skills to use it?
Not at all. The dashboard is fully automated with formulas, drop-downs, and pre-built visuals.
5. Can I customize the KPIs?
Yes. You can modify KPI names, formulas, and targets in the KPI Definition sheet.
6. How often should data be updated?
Monthly updates are recommended to ensure MTD and YTD metrics remain accurate.
7. Can it be linked with other data systems?
Yes. You can connect it to Power Query, external databases, or even Power BI for advanced analytics.
8. Why use Excel instead of complex software?
Excel offers flexibility, affordability, and ease of use — ideal for publishers of all sizes.
Click to Purchases Comic Books and Publishing KPI Dashboard in Excel
Visit our YouTube channel to learn step-by-step video tutorials