Home>Blogs>Dashboard>Comparative Analysis Dashboard in Excel>Comparative Analysis Dashboard in Excel-2
Comparative Analysis Dashboard in Excel-2
20
Jun 2021
128Comments Off on Comparative Analysis Dashboard in Excel-2
PK
Meet PK, the founder of PK-AnExcelExpert.com! With over 15 years of experience in Data Visualization, Excel Automation, and dashboard creation. PK is a Microsoft Certified Professional who has a passion for all things in Excel. PK loves to explore new and innovative ways to use Excel and is always eager to share his knowledge with others. With an eye for detail and a commitment to excellence, PK has become a go-to expert in the world of Excel. Whether you're looking to create stunning visualizations or streamline your workflow with automation, PK has the skills and expertise to help you succeed. Join the many satisfied clients who have benefited from PK's services and see how he can take your Excel skills to the next level!
https://www.pk-anexcelexpert.com
Related Articles
After-Sales Service KPI Dashboard in Power BI
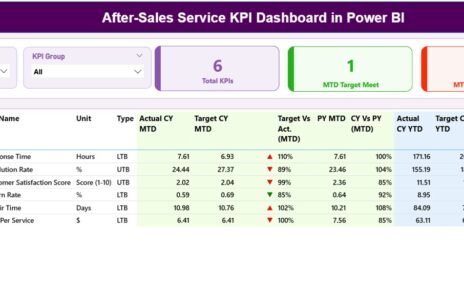
In today’s competitive business world, after-sales service plays a crucial role in shaping customer loyalty and brand reputation. A satisfied
Port Operations Dashboard in Power BI
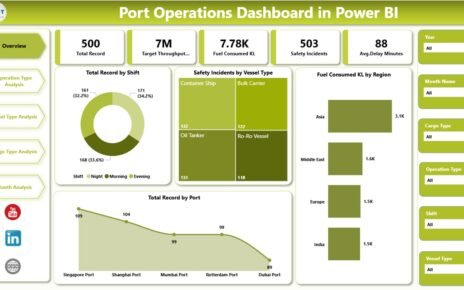
Modern ports handle thousands of vessel movements, cargo shipments, and logistics operations every day. Therefore, port authorities, shipping companies, and
Destination Management Companies KPI Dashboard in Power BI
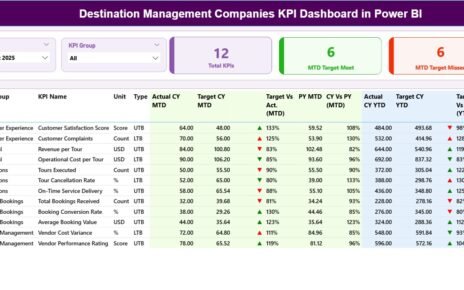
Destination Management Companies (DMCs) operate in a fast-moving, service-driven environment. They manage tours, events, transportation, hotels, vendors, and client expectations—all


