In today’s fast-paced business environment, staying compliant is not just a legal requirement—it’s a competitive advantage. Organizations across industries must track hundreds of regulations, internal policies, and risk controls. Yet, traditional methods of managing compliance—spreadsheets, manual reports, and siloed tools—often lead to missed deadlines, poor visibility, and high risk.
That’s where a Compliance Tracking Dashboard in Power BI comes in. This modern dashboard brings real-time visibility, accountability, and efficiency to your compliance operations. Built using Excel as the data source and visualized in Power BI, it’s a powerful solution for companies looking to strengthen governance while saving time and cost.
Let’s explore how it works, what features it offers, and how your team can benefit from using it.
Click to Purchases Compliance Tracking Dashboard in Power BI
What is a Compliance Tracking Dashboard in Power BI?
A Compliance Tracking Dashboard in Power BI is a centralized visualization tool that helps you monitor, manage, and report on compliance activities. It collects data from Excel or other sources and presents it through dynamic charts, tables, and KPIs (Key Performance Indicators).
It allows stakeholders—from compliance officers to department heads—to instantly track overdue tasks, cost estimates, time spent, and responsibility distribution across the organization.
With five interactive pages, this Power BI dashboard covers every essential aspect of compliance monitoring:
-
Overview
-
Department Level Analysis
-
Compliance Area Tracking
-
Responsible Person Summary
-
Timeline Tracking
Each page contains filters (slicers), cards, and visualizations that help you drill down into the data without technical expertise.
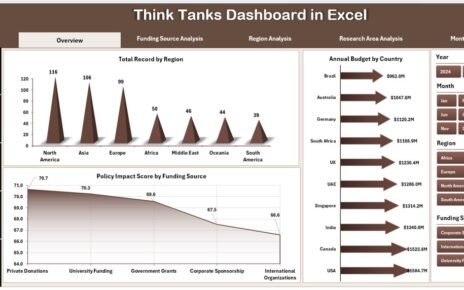
Overview Page: Your Compliance Command Center
This is the main page of the dashboard—your first stop for a quick compliance health check.
Key Elements:
-
6 Slicers to filter by Compliance Type, Department, Date, Status, etc.
4 KPI Cards showing:
- Total Compliance Count
- Overdue Tasks
- Total Estimated Cost (USD)
- Avg. Time Spent
2 Visual Charts:
- Total Estimated Cost (USD) by Compliance Type
- Number of Compliance Tasks by Department
Click to Purchases Compliance Tracking Dashboard in Power BI
This page allows you to quickly identify red flags, such as which departments are struggling or which compliance types are consuming the most resources.
Department Level Analysis: Zoom In on Department Performance
The second page dives deeper into department-specific compliance data.
Visual Insights Include:
-
6 Slicers to filter for a targeted view
3 Powerful Charts:
- Avg. Time Spent (hrs) by Department
- Avg. Overdue Days by Department
- Total Estimated Cost (USD) by Department
You can easily assess which departments are performing well and which need intervention, making this page essential for inter-departmental accountability.
Compliance Area Tracking: Measure Control Effectiveness
Each compliance task typically falls under a broader compliance area (e.g., Data Protection, Financial Reporting, Environmental Standards). This page helps you evaluate how well each compliance area is being managed.
Included Visuals:
-
6 Slicers
3 Charts:
- Avg. Time Spent (hrs) by Compliance Area
- Avg. Overdue Days by Compliance Area
- Total Estimated Cost (USD) by Compliance Area
With this data, teams can optimize processes for specific compliance domains and reduce penalties or audit risks.
Responsible Person Summary: Know Who’s Accountable
Compliance is a team sport. But someone must be responsible for each task. This page shows how well individuals are handling their assigned compliance duties.
Features:
-
6 Slicers
3 Charts:
- Avg. Time Spent (hrs) by Responsible Person
- Avg. Overdue Days by Responsible Person
- Total Estimated Cost (USD) by Responsible Person
You’ll quickly identify high performers and areas where extra training or support may be required.
Timeline Tracking: Understand When and How Compliance is Happening
Time is a critical factor in compliance. This final page provides insights into trends over months.
Visualizations:
-
6 Slicers
4 Charts:
- Total Estimated Cost (USD) by Month Name
- Avg. Time Spent (hrs) by Month Name
- Avg. Overdue Days by Month
- Count of Compliance Type by Month
This page supports historical trend analysis and helps in forecasting future compliance loads or bottlenecks.
Advantages of Using a Compliance Tracking Dashboard in Power BI
Using Power BI for compliance tracking has many benefits:
🔍 Real-time Visibility: Know what’s overdue, under control, or costly.
🧠 Data-Driven Decisions: Back your strategies with solid compliance metrics.
📉 Risk Reduction: Prevent violations and non-compliance penalties.
🕒 Time Savings: Eliminate manual reporting and consolidate all data in one place.
💰 Cost Control: Track estimated costs across departments and compliance areas.
👥 Team Accountability: Assign and monitor tasks per person and department.
📊 Custom Views: Use slicers and filters to create role-specific dashboards.
Best Practices for the Compliance Tracking Dashboard in Power BI
To make the most out of your dashboard, follow these expert tips:
✅ Keep Your Excel Data Clean: Remove duplicates and use consistent naming conventions.
✅ Update Data Regularly: Automate Excel refreshes if possible.
✅ Use Conditional Formatting: Highlight overdue or critical items.
✅ Assign Clear Roles: Ensure every task has a responsible person assigned.
✅ Leverage Power BI Bookmarks: Create saved views for different roles (e.g., auditor vs. manager).
✅ Train Stakeholders: Give a quick walkthrough of how to use filters and interpret charts.
✅ Review Monthly: Use the timeline page for monthly reviews and compliance meetings.
Use Cases: Who Can Benefit from This Dashboard?
This Power BI dashboard is helpful across industries:
-
Finance & Banking – For regulatory reporting, KYC compliance, etc.
-
Healthcare – HIPAA or local medical data compliance.
-
Manufacturing – Safety and environmental compliance tracking.
-
Education – Tracking policies related to accreditation or student privacy.
-
IT & Cybersecurity – Monitoring system audits, data protection, and risk controls.
How to Implement the Compliance Dashboard
Here’s a quick roadmap to get started:
-
Prepare Your Excel Data: Columns should include Task Name, Compliance Type, Department, Responsible Person, Estimated Cost, Deadline, Status, Time Spent, and Overdue Days.
-
Load Data in Power BI: Connect your Excel source.
-
Build Slicers and Cards: Start with the Overview page.
-
Add Charts with Filters: Use bar, column, and donut charts for insights.
-
Design Remaining Pages: Follow the structure of the 5-page layout.
-
Publish and Share: Use Power BI Service to share with your team securely.
Integrating with Other Tools
Enhance your compliance dashboard by integrating:
-
Microsoft Teams – Share compliance updates with teams.
-
SharePoint – Store compliance documents and link them.
-
Outlook – Set up deadline reminders using Power Automate.
-
Excel Macros – Use VBA scripts for automated data entry or validation.
Frequently Asked Questions (FAQs)
1. What data source is used in this Compliance Dashboard?
The primary data source is Microsoft Excel. You can also connect it to SQL, SharePoint, or cloud databases.
2. Can I customize the dashboard for my company’s specific compliance needs?
Yes. You can add or remove pages, charts, and filters based on your business model or regulatory framework.
3. Is this dashboard suitable for small businesses?
Absolutely. Small businesses can benefit immensely as it reduces manual effort and improves compliance visibility.
4. How often should I update the dashboard?
Weekly or monthly updates are ideal. However, you can set up automatic refreshes for real-time tracking.
5. Does Power BI require coding skills to use this dashboard?
No. You can build and use this dashboard using drag-and-drop features in Power BI Desktop.
6. Can I use this dashboard during an audit?
Yes. This dashboard provides auditors with quick access to critical compliance metrics, overdue items, and accountability trails.
7. What charts are best for compliance tracking?
Bar charts, line charts, and donut charts are the most effective for tracking time, cost, and compliance counts.
8. What makes this dashboard better than spreadsheets?
Unlike spreadsheets, Power BI provides interactive visuals, centralized data, faster insights, and automation capabilities.
Conclusion
Staying compliant is not optional—it’s essential. The Compliance Tracking Dashboard in Power BI makes this task simpler, smarter, and faster. With real-time insights, department-level tracking, and timeline-based monitoring, this dashboard turns complex compliance data into clear actions.
Visit our YouTube channel to learn step-by-step video tutorials
Click to Purchases Compliance Tracking Dashboard in Power BI