Managing costs in the construction and real estate industry is no easy feat. With multiple projects, tight deadlines, fluctuating material prices, and labor issues, organizations often struggle to maintain profitability. This is exactly where a Cost Efficiency KPI Dashboard in Excel becomes a game-changer.
In this article, we will walk you through an intuitive, powerful, and ready-to-use Construction and Real Estate Cost Efficiency KPI Dashboard built in Excel. You’ll learn how it works, what it includes, and how it helps decision-makers gain financial clarity and performance insights with just a few clicks.
Click to Purchases Construction and Real Estate Cost Efficiency KPI Dashboard in Excel
What is a Cost Efficiency KPI Dashboard?
A Cost Efficiency KPI Dashboard is a centralized tool used to monitor, track, and visualize key performance indicators (KPIs) related to cost control and operational efficiency in construction and real estate projects. Built in Excel, this dashboard simplifies complex data into easy-to-read visuals and metrics.
Whether you’re tracking monthly costs, comparing actual vs target values, or analyzing trends, this tool allows you to stay in control without needing expensive software.
Key Features of the Construction and Real Estate KPI Dashboard in Excel
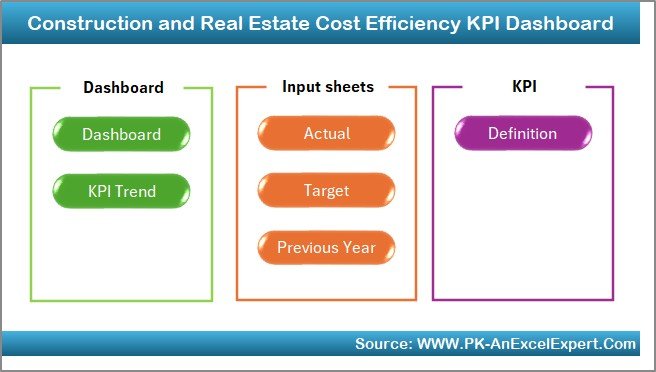
This dashboard template includes 7 smartly structured worksheet tabs that give you full control over your KPIs, targets, and performance analysis.
Home Sheet: The Navigation Hub
-
Acts as the index page.
-
Includes six interactive buttons that allow users to jump directly to the desired sheet.
-
Enhances navigation and saves time.
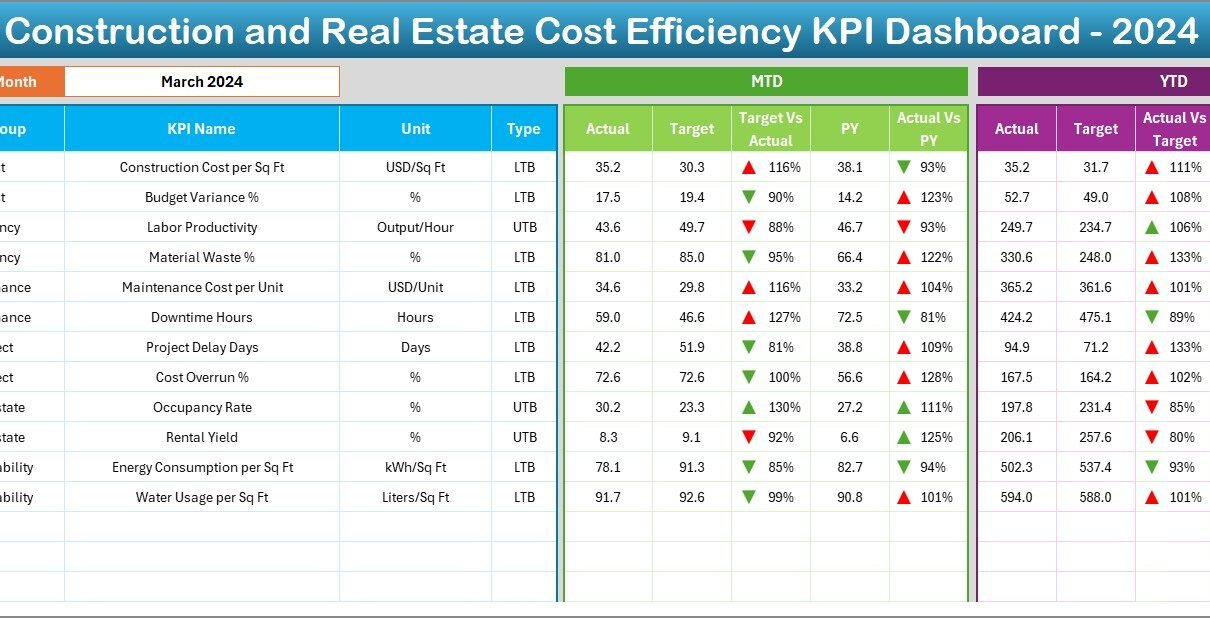
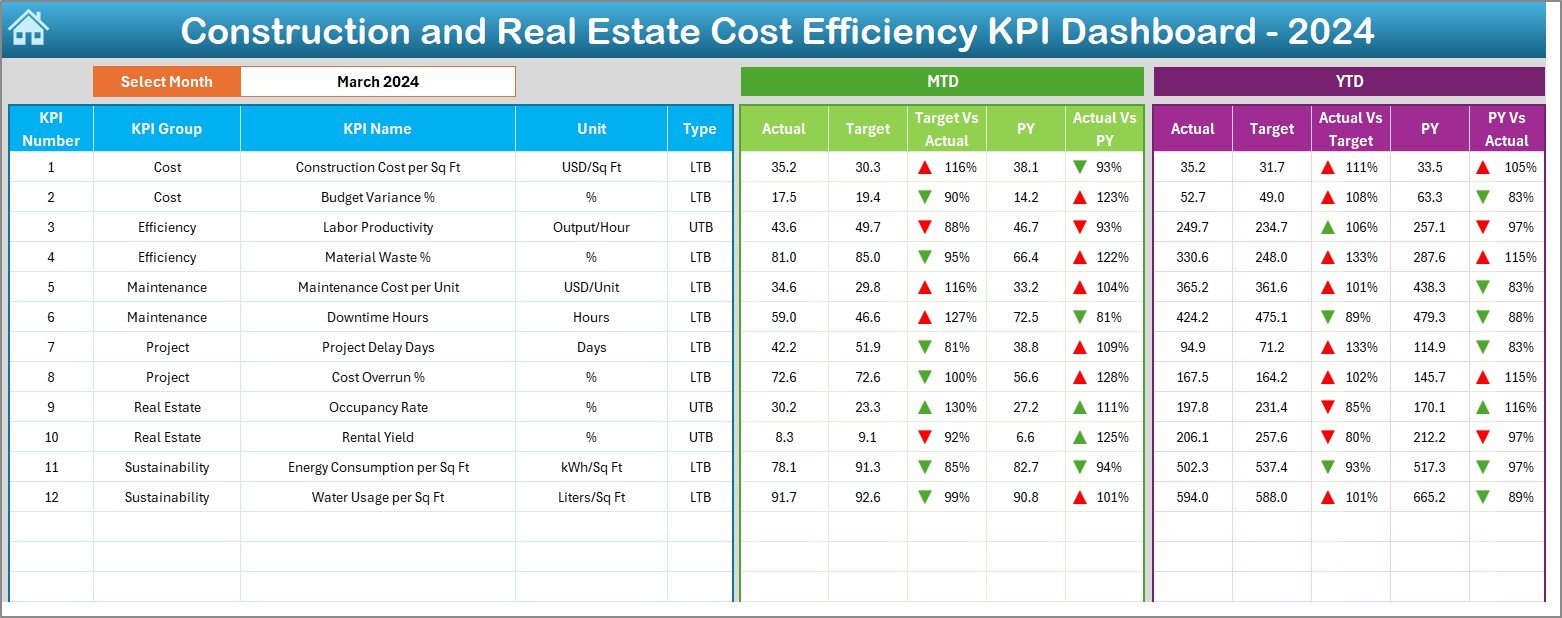
Dashboard Sheet: One-Stop View
-
The core of the tool.
-
Select the month from cell D3 dropdown.
-
Automatically updates MTD (Month-to-Date) and YTD (Year-to-Date) numbers.
Compares:
- Actual vs Target
- Actual vs Previous Year
Conditional formatting highlights performance:
- 🔼 Up arrows for improvements
- 🔽 Down arrows for declines
You don’t just see numbers—you see what matters.
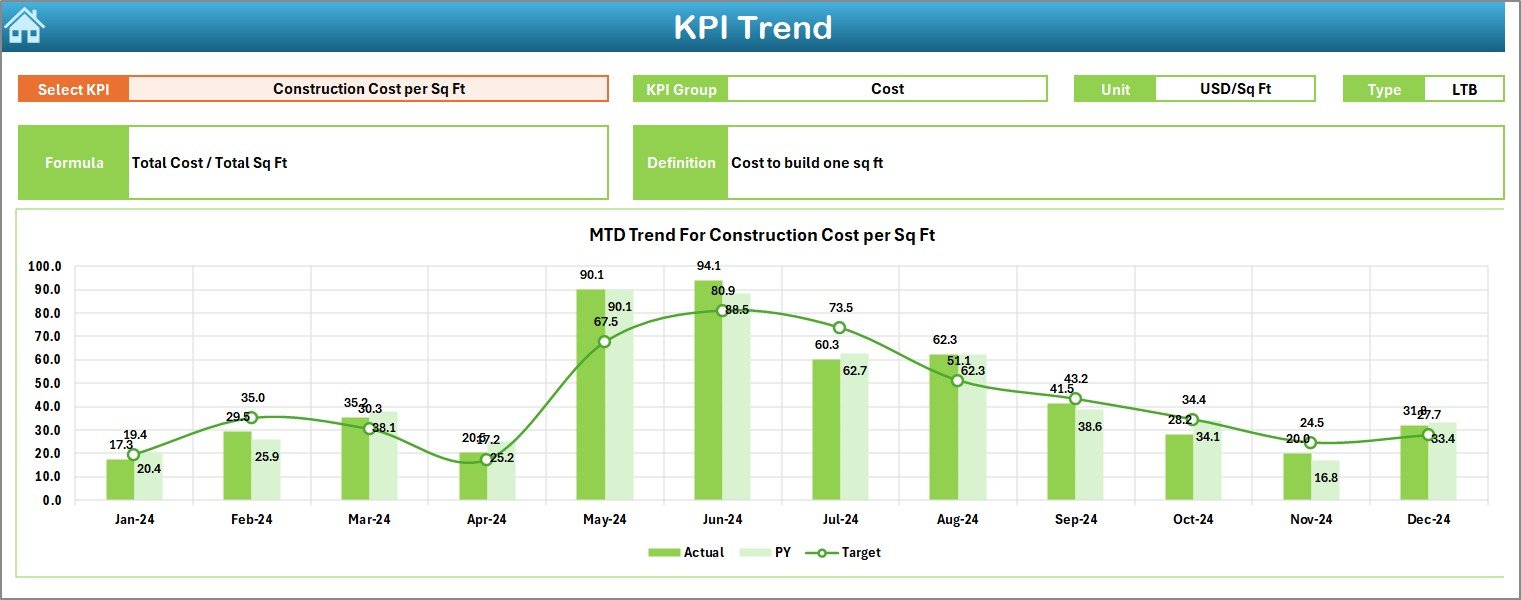
KPI Trend Sheet: Visual Insights
-
Select any KPI from a dropdown in cell C3.
Displays:
- KPI Group
- Unit
- Formula
- Type (UTB/LTB)
- Definition
-
Shows MTD and YTD trend charts for Actual, Target, and Previous Year—allowing quick performance diagnosis.
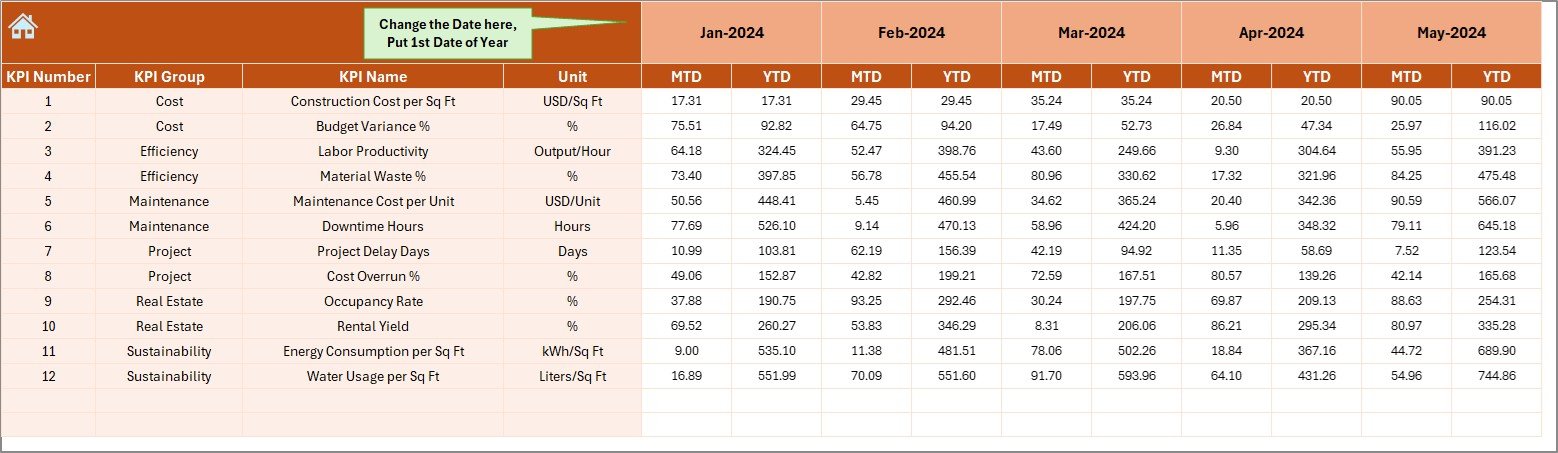
Actual Numbers Input Sheet: Monthly Entry
-
Enter monthly Actual MTD and YTD data.
-
Choose starting month in cell E1.
-
Ensures alignment with fiscal periods.
-
Clean layout avoids confusion and simplifies updates.
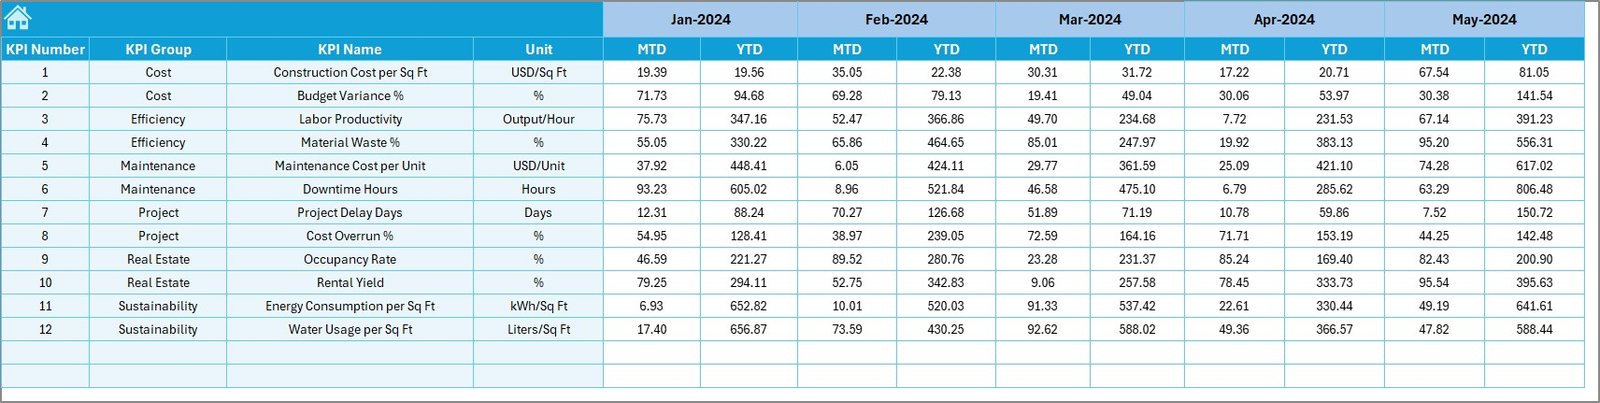
Target Sheet: Set Your Goals
-
Input monthly targets for each KPI—MTD and YTD.
-
Align performance with financial goals.
-
Enables variance analysis with the Dashboard view.
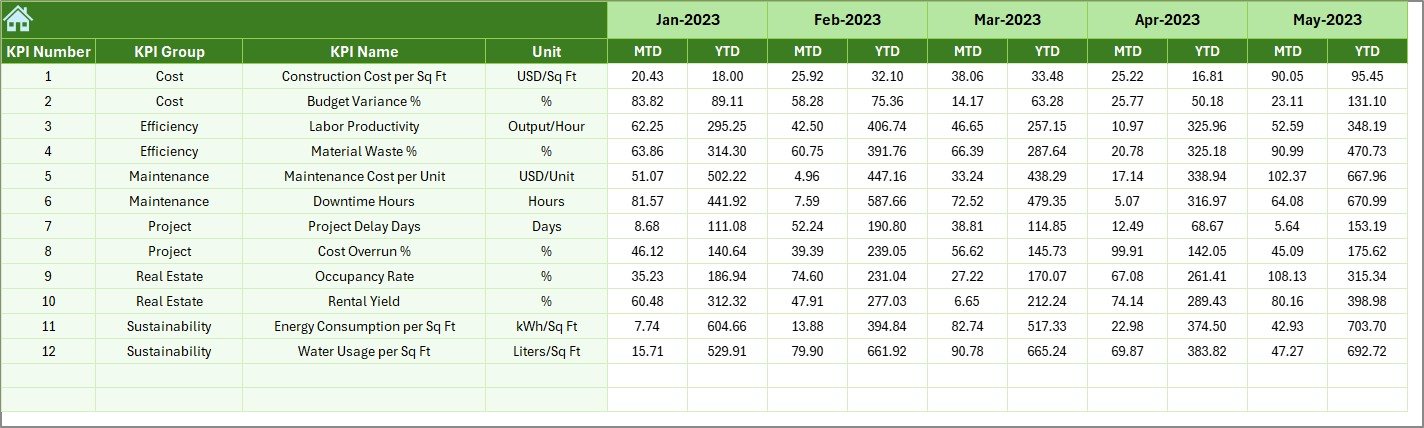
Previous Year Numbers Sheet: Historical Reference
-
Input same-format data from the prior year.
-
Essential for trend analysis and historical comparison.
KPI Definition Sheet: Central KPI Repository
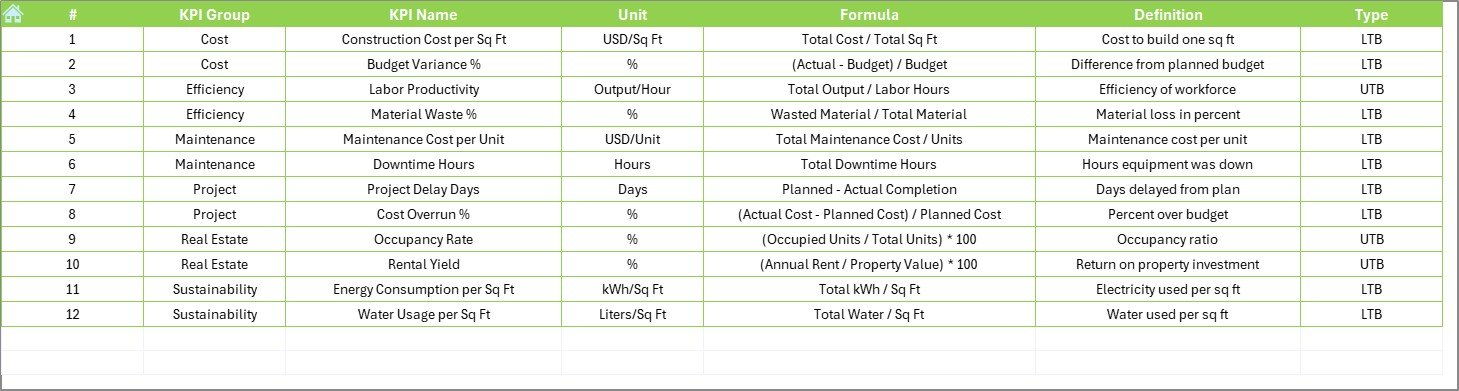
-
Store and define:
- KPI Name
- KPI Group
- Unit of Measurement
- Formula
- KPI Definition
-
Supports customization and internal transparency.
How to Use This Dashboard Effectively
-
Set your starting month in the Actual Input sheet (cell E1).
-
Enter KPI definitions in the KPI Definition sheet.
-
Fill in actual, target, and previous year numbers monthly.
-
Navigate using the Home sheet.
-
Select a month on the Dashboard sheet (D3) to view real-time analysis.
-
Track trends using the KPI Trend sheet.
Popular KPIs Tracked in Construction & Real Estate
This dashboard is compatible with many relevant KPIs, such as:
-
Cost per Square Foot
-
Material Cost Variance
-
Labor Cost Efficiency
-
Overhead Percentage
-
Budget Utilization Rate
-
Project Margin
-
Equipment Utilization
-
Maintenance Cost Ratio
-
Invoice Processing Time
-
RFI (Request for Information) Resolution Time
These KPIs tell a story—your financial performance story.
Advantages of Using a Cost Efficiency KPI Dashboard in Excel
Implementing this dashboard comes with multiple benefits:
🎯 Real-Time Cost Control
-
Adjust plans quickly by monitoring actual vs target metrics every month.
📉 Reduced Operational Waste
-
Identify areas of overspending or inefficiency.
📈 Better Forecasting
-
Use historical trends to plan future budgets more accurately.
💼 Enhanced Decision-Making
-
Get a holistic view of financial performance without relying on gut feeling.
🧮 No Need for Expensive Software
-
Excel-based dashboards are cost-effective and widely accessible.
👥 Cross-Functional Use
-
Teams from Finance, Project Management, and Procurement can all collaborate using the same tool.
Why Choose Excel for KPI Dashboards?
Click to Purchases Construction and Real Estate Cost Efficiency KPI Dashboard in Excel
Many professionals already use Excel, but not everyone knows its power. Excel enables:
-
Custom dashboards tailored to your data.
-
Advanced formulas for real-time analysis.
-
Pivot charts for dynamic visuals.
-
Conditional formatting for automated alerts.
-
Universal compatibility across teams and systems.
And the best part? No new software installations are required.
Best Practices for the Construction and Real Estate KPI Dashboard
To make the most of this tool, follow these best practices:
📅 Keep Data Timely
-
Update your actual, target, and previous year data at the end of each month.
📌 Define Clear KPIs
-
Use the KPI Definition sheet to avoid confusion and maintain consistency.
🔍 Review Trends Monthly
-
Use the KPI Trend sheet to assess performance momentum.
🎨 Use Color Coding
-
Customize conditional formatting to match your branding or focus areas.
👨👩👧👦 Assign Responsibility
-
Allocate KPI ownership to specific team members for better accountability.
📂 Keep a Backup
-
Store backups regularly, especially before major data entry sessions.
Opportunities for Improvement in KPI Management
While dashboards streamline tracking, there’s always room to grow. Consider:
-
Automating data imports from external sources (ERP, Google Sheets, etc.).
-
Integrating forecast models to predict cost overruns.
-
Adding project-level filters for multi-project firms.
-
Creating mobile versions or Power BI integrations for executive reporting.
Each of these upgrades can transform your Excel dashboard into an enterprise-grade tool.
Conclusion: Start Controlling Your Costs Today
In an industry where every dollar matters, a Construction and Real Estate Cost Efficiency KPI Dashboard offers unmatched value. It transforms raw data into actionable insights and helps teams operate more strategically.
Whether you manage one project or hundreds, this Excel dashboard gives you clarity, control, and confidence.
So why wait? Empower your team with the tools they need to stay ahead of budget issues, monitor key metrics, and drive profitability.
Frequently Asked Questions (FAQs)
🔹 What KPIs are included in this dashboard?
This dashboard is customizable. However, common KPIs include Cost per Sq. Ft., Budget Utilization, Labor Cost, Equipment Usage, and Overhead %.
🔹 Can I track multiple projects with this Excel dashboard?
Yes, you can adapt the structure to track multiple projects by adding filters or project columns in the input sheets.
🔹 Is this dashboard compatible with Excel 2016 and above?
Absolutely. It works smoothly with Excel 2016, 2019, and Microsoft 365.
🔹 How do I update KPI data every month?
Go to the Actual Numbers Input, Target, and Previous Year sheets. Update the new values and the dashboard will automatically reflect them.
🔹 Is technical expertise required to use this?
Not at all. This dashboard is built for project managers, finance heads, and business owners—no advanced Excel skills are needed.
🔹 Can I add new KPIs?
Yes, simply update the KPI Definition sheet and input matching data in the Actual, Target, and Previous Year sheets.
🔹 What does UTB or LTB mean?
-
UTB (Upper the Better): Higher value = better performance (e.g., Profit Margin).
-
LTB (Lower the Better): Lower value = better performance (e.g., Cost per Sq. Ft.).
Click to Purchases Construction and Real Estate Cost Efficiency KPI Dashboard in Excel
Visit our YouTube channel to learn step-by-step video tutorials