Modern consumer electronics companies manage thousands of service requests every month. Customers expect quick repairs, transparent communication, and high-quality support experiences. However, when organizations rely on scattered spreadsheets or manual reporting, teams struggle to track performance effectively. As a result, delays increase, service costs rise, and customer satisfaction drops.
Therefore, companies now adopt intelligent analytics solutions that provide real-time operational visibility. One of the most powerful solutions is the Consumer Electronics Service Dashboard in Power BI — a centralized analytics platform designed to monitor service performance, customer satisfaction, operational costs, and revenue insights in one place.
In this comprehensive guide, you will learn everything about the Consumer Electronics Service Dashboard in Power BI, including its structure, features, benefits, analysis capabilities, best practices, and frequently asked questions. Moreover, you will understand how this dashboard transforms raw service data into meaningful business decisions.
What Is a Consumer Electronics Service Dashboard in Power BI?
A Consumer Electronics Service Dashboard in Power BI is an interactive data visualization system that tracks after-sales service operations using dynamic charts, KPIs, filters, and automated calculations.
Instead of reviewing multiple reports, managers analyze service performance through a single interactive dashboard. Consequently, decision-makers identify problems faster and improve operational efficiency.
This dashboard helps organizations:
-
Monitor service requests and repair status
-
Analyze service costs and profitability
-
Track customer satisfaction trends
-
Evaluate product performance issues
-
Measure regional service efficiency
-
Improve support team productivity
Because Power BI updates data dynamically, organizations always work with accurate and actionable insights.
Why Do Consumer Electronics Companies Need a Service Dashboard?
Consumer electronics businesses operate in a highly competitive environment. Customers compare service experiences instantly, and poor service directly impacts brand reputation.
Without analytics:
-
Service teams react slowly to issues
-
Managers cannot identify cost drivers
-
Customer complaints increase
-
Performance tracking becomes inconsistent
However, when companies implement a Power BI dashboard, they gain full operational visibility.
Key Reasons Organizations Use Service Dashboards
-
Faster service decision-making
-
Better customer experience monitoring
-
Improved cost control
-
Data-driven performance management
-
Real-time operational tracking
As a result, businesses move from reactive service management to proactive service optimization.
Key Features of Consumer Electronics Service Dashboard in Power BI
This dashboard contains five powerful analytical pages inside the Power BI Desktop application. Each page focuses on a specific operational perspective.
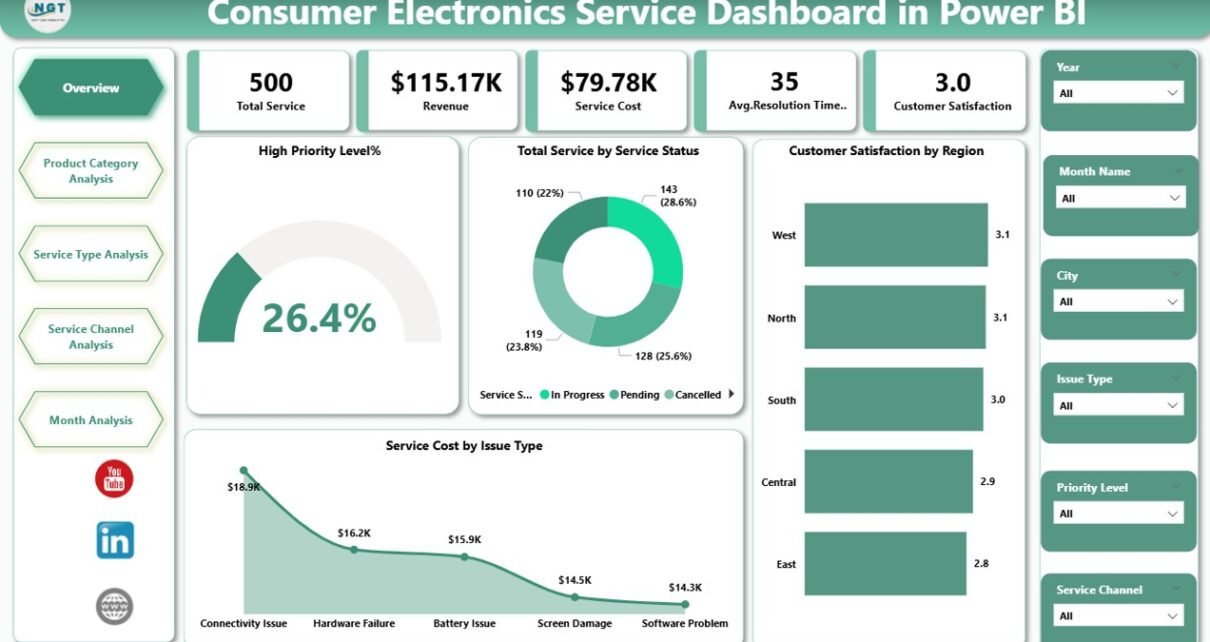
1. Overview Page — Central Performance Monitoring
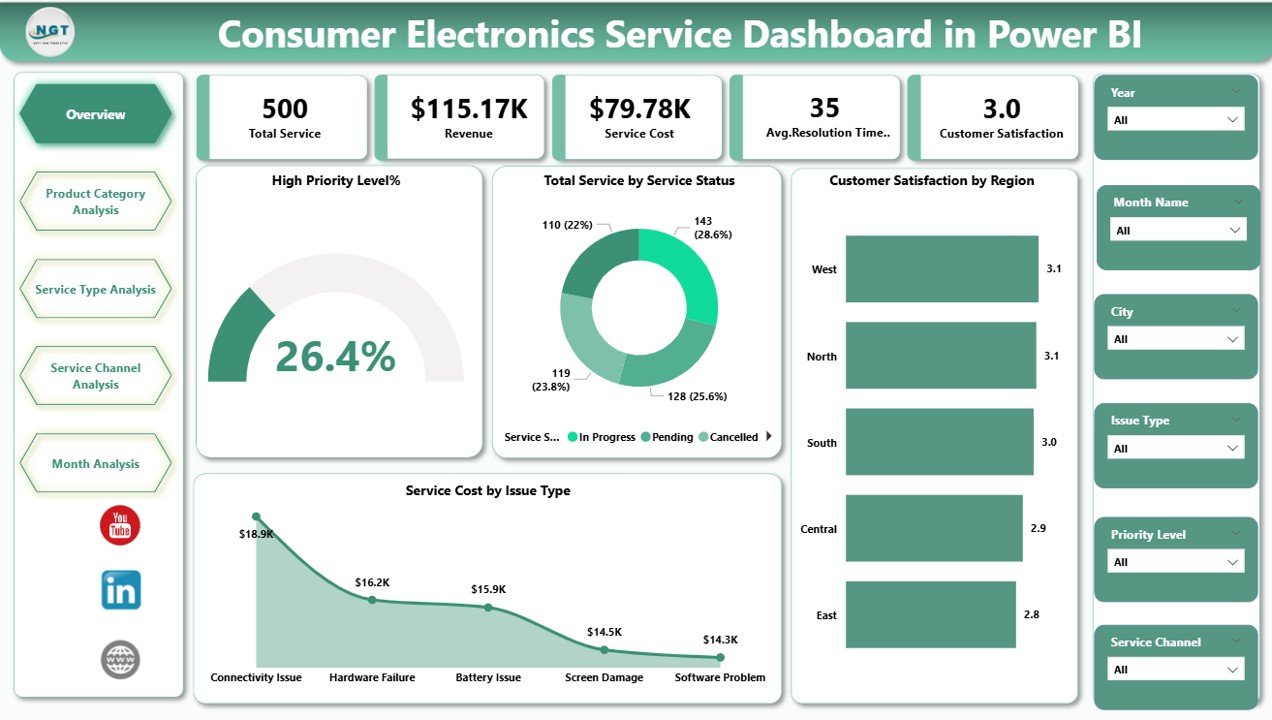
The Overview Page acts as the main control center of the dashboard. Users immediately understand overall service health through summarized KPIs and visuals.
KPI Cards Included
-
High Priority Level %
-
Total Service by Service Status
-
Customer Satisfaction by Region
-
Service Cost by Issue Type
-
Overall Service Performance Indicators
Charts Available
-
High Priority Service Analysis
-
Service Status Distribution
-
Regional Satisfaction Comparison
-
Issue-Type Cost Analysis
Why This Page Matters
Managers quickly detect operational risks. For example, if high-priority cases increase, teams can immediately allocate resources.
Additionally, slicers allow users to filter data by region, product, or time period.
2. Product Category Analysis — Product Performance Insights
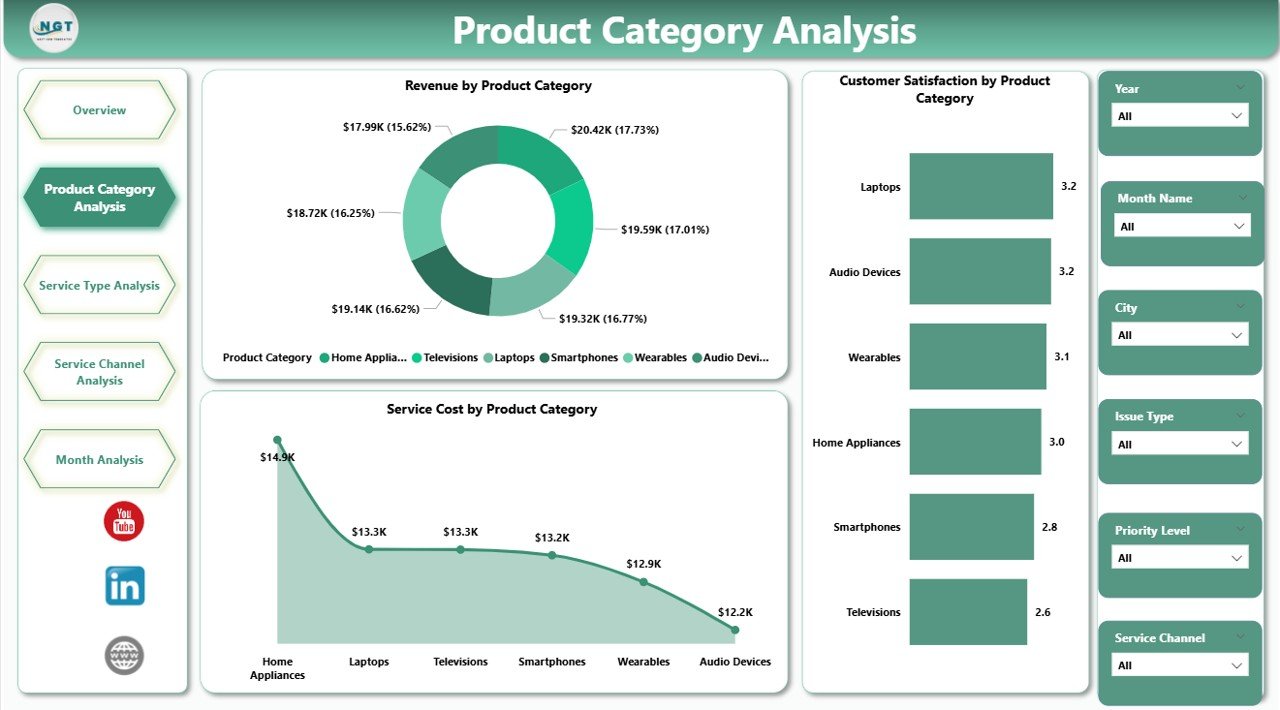
The Product Category Analysis Page focuses on how different product categories perform in service operations.
Charts Included
-
Revenue by Product Category
-
Customer Satisfaction by Product Category
-
Service Cost by Product Category
Insights You Can Generate
-
Which products generate the most service revenue
-
Which products cause frequent complaints
-
Cost-heavy product categories
-
Satisfaction trends by device type
Therefore, product managers identify design or quality issues faster.
3. Service Type Analysis — Service Channel Efficiency
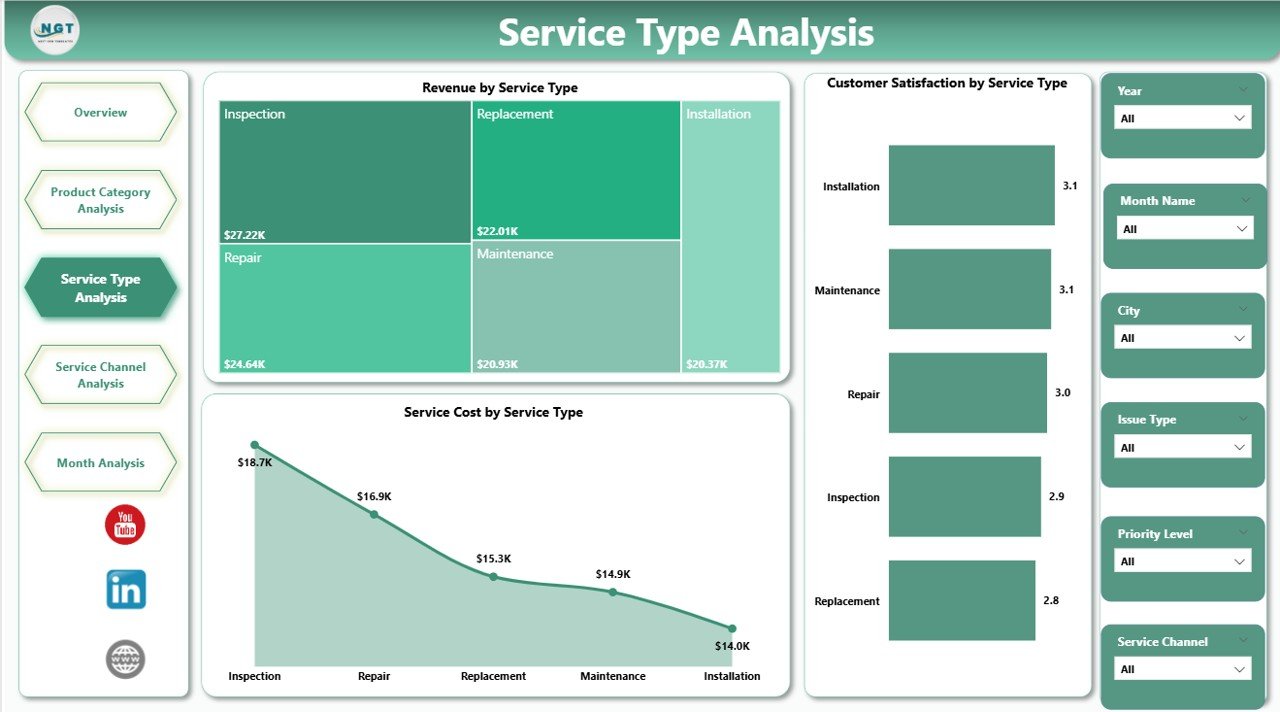
The Service Type Analysis Page evaluates performance across different service channels.
Charts Included
-
Revenue by Service Channel
-
Customer Satisfaction by Service Channel
-
Service Cost by Service Channel
Key Benefits
-
Compare online vs in-store service efficiency
-
Measure support channel profitability
-
Improve service delivery strategies
For instance, companies may discover that remote support resolves issues faster while reducing operational costs.
4. Service Channel Analysis — Regional Sales & Profit Insights
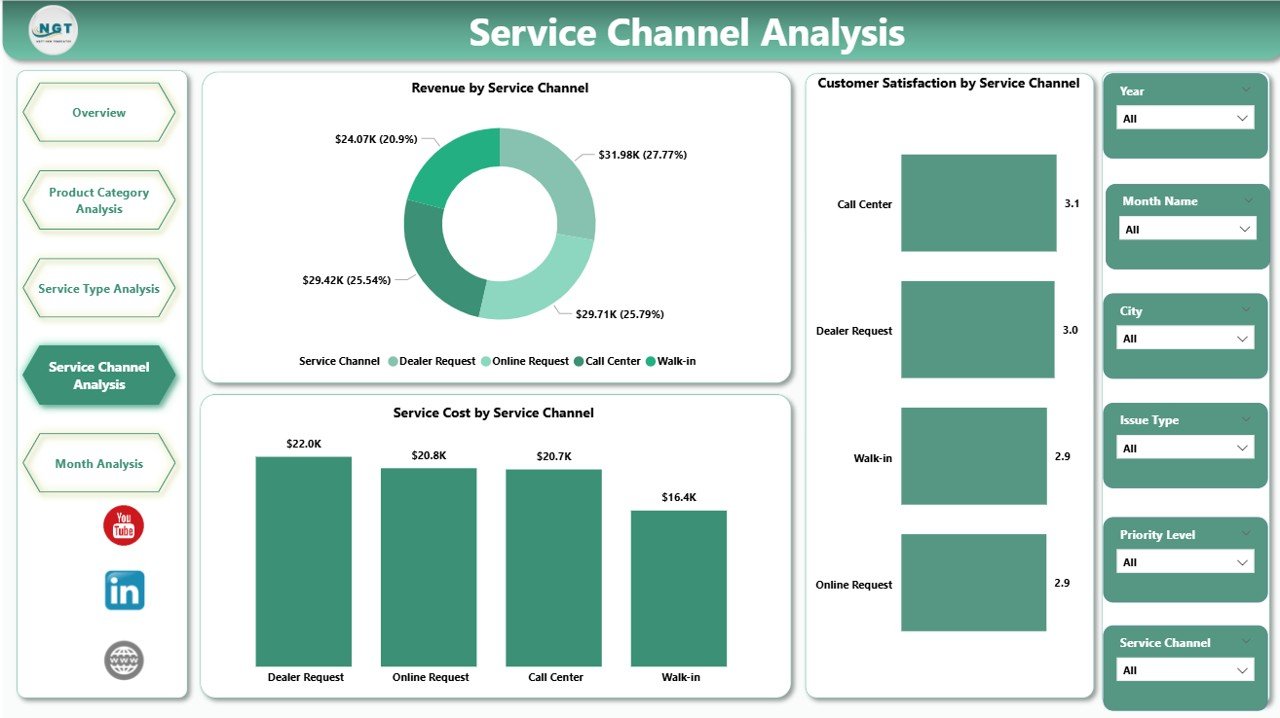
This page analyzes regional service and sales performance.
Charts Included
-
Profit Margin % by Region
-
Target Sales by Region
-
Gross Sales by Region
Business Value
Managers understand:
-
Which regions perform above targets
-
Profitability differences across markets
-
Sales and service relationships
Consequently, organizations optimize regional strategies and allocate resources effectively.
5. Month Analysis — Time-Based Performance Tracking
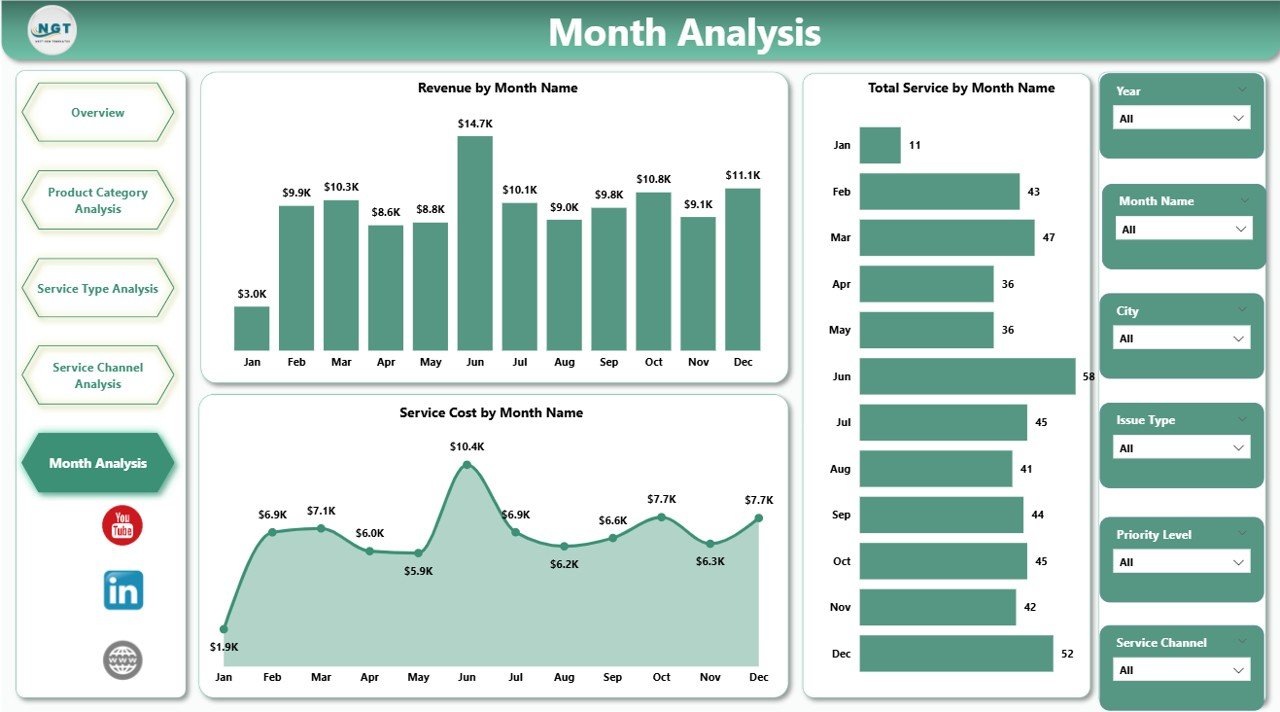
The Month Analysis Page focuses on trend analysis over time.
Charts Included
-
Revenue by Month
-
Total Service by Month
-
Service Cost by Month
Why Monthly Analysis Is Important
Trend analysis helps businesses:
-
Identify seasonal service spikes
-
Predict workload demand
-
Control cost growth
-
Improve staffing planning
Because trends become visible instantly, companies make proactive operational decisions.
How Does the Dashboard Improve Service Management?
A structured Power BI dashboard changes how teams manage service operations.
Before Dashboard Implementation
-
Manual reports
-
Delayed insights
-
Limited visibility
-
Reactive decisions
After Dashboard Implementation
-
Real-time analytics
-
Automated reporting
-
Faster decision-making
-
Data-driven strategies
Therefore, organizations significantly improve operational efficiency.
Advantages of Consumer Electronics Service Dashboard in Power BI
Why Should Businesses Use This Dashboard?
✅ Centralized Data Visibility
All service information appears in one platform, which reduces confusion.
✅ Faster Decision Making
Managers instantly identify performance gaps.
✅ Improved Customer Satisfaction
Teams resolve issues faster using clear insights.
✅ Cost Optimization
Organizations track service expenses precisely.
✅ Better Resource Planning
Workload trends help allocate technicians efficiently.
✅ Interactive Analysis
Users explore data using slicers and filters.
What Type of Analysis Can Businesses Perform?
This dashboard supports multiple analytical perspectives.
Operational Analysis
-
Service completion rate
-
High-priority case monitoring
-
Resolution efficiency
Financial Analysis
-
Service cost trends
-
Revenue performance
-
Profit margin evaluation
Customer Experience Analysis
-
Satisfaction by region
-
Channel performance
-
Product complaint trends
Strategic Analysis
-
Regional growth opportunities
-
Product improvement insights
-
Channel optimization decisions
Who Can Use This Dashboard?
Many professionals benefit from this solution.
Ideal Users Include:
-
Service Managers
-
Operations Heads
-
Customer Support Leaders
-
Product Managers
-
Business Analysts
-
Electronics Manufacturers
-
Repair Service Providers
Because the dashboard uses intuitive visuals, both technical and non-technical users can operate it easily.
How to Use the Consumer Electronics Service Dashboard in Power BI?
Follow these simple steps:
-
Import service data into Power BI.
-
Connect datasets to the dashboard model.
-
Refresh data regularly.
-
Use slicers to filter analysis.
-
Monitor KPIs daily.
-
Share reports with stakeholders.
As teams adopt regular monitoring habits, performance improves consistently.
Best Practices for the Consumer Electronics Service Dashboard in Power BI
To achieve maximum value, organizations should follow proven practices.
✔ Maintain Clean Data
Ensure consistent product names and service categories.
✔ Update Data Frequently
Schedule automatic refresh for real-time insights.
✔ Monitor KPIs Regularly
Daily monitoring prevents operational surprises.
✔ Use Standard Definitions
Align teams on KPI meanings.
✔ Train Teams Properly
Educate users on dashboard navigation.
✔ Focus on Actionable Metrics
Track metrics that drive decisions.
Common Challenges and How to Overcome Them
Challenge: Data Inconsistency
Solution: Use standardized data input templates.
Challenge: Low Dashboard Adoption
Solution: Provide training sessions and executive support.
Challenge: Too Many Metrics
Solution: Focus on key performance indicators only.
Challenge: Slow Decision Cycles
Solution: Set automated alerts based on KPIs.
Future Trends in Consumer Electronics Service Analytics
Service analytics continues evolving rapidly.
Emerging Trends Include:
-
AI-powered predictive maintenance
-
Automated service recommendations
-
Real-time IoT device monitoring
-
Customer sentiment analytics
-
Predictive workload forecasting
Therefore, dashboards will become even more intelligent and proactive.
Conclusion
The Consumer Electronics Service Dashboard in Power BI provides a powerful solution for managing modern service operations. Instead of relying on disconnected reports, organizations gain a centralized analytics platform that delivers real-time visibility into service performance, customer satisfaction, costs, and revenue.
Because the dashboard combines interactive visuals with automated calculations, businesses improve efficiency, reduce service costs, and enhance customer experiences simultaneously.
Ultimately, companies that adopt data-driven service analytics achieve faster decision-making, stronger customer loyalty, and sustainable operational growth.
Frequently Asked Questions (FAQs)
What is a Consumer Electronics Service Dashboard in Power BI?
It is an interactive analytics dashboard that tracks service operations, costs, satisfaction, and performance using Power BI visuals.
Who should use this dashboard?
Service managers, operations teams, electronics manufacturers, and business analysts benefit the most.
Can beginners use this dashboard?
Yes. Power BI visuals make analysis simple and user-friendly.
Does the dashboard support real-time updates?
Yes. When connected to live data sources, Power BI refreshes information automatically.
What insights can companies gain?
Organizations can analyze service efficiency, customer satisfaction, cost trends, and regional performance.
How often should data be updated?
Businesses should refresh data daily or weekly depending on operational needs.
Can this dashboard improve customer satisfaction?
Yes. Faster insights allow teams to resolve issues quickly and improve service quality.
Visit our YouTube channel to learn step-by-step video tutorials