Managing a consumer electronics service operation demands accuracy, speed, and clear visibility into performance. However, many service managers still rely on scattered Excel files, manual reports, and delayed insights. As a result, decision-making slows down, and service quality suffers. This is exactly where a Consumer Electronics Service KPI Dashboard in Excel becomes essential.
In this in-depth article, you will learn what a Consumer Electronics Service KPI Dashboard in Excel is, why it matters, how it works, and how each worksheet contributes to better service management. Moreover, you will discover its advantages, best practices, opportunities for improvement, and frequently asked questions. By the end, you will clearly understand how to use this dashboard as a powerful decision-support tool for electronics service operations.
Click to buy Consumer Electronics Service KPI Dashboard in Excel
What Is a Consumer Electronics Service KPI Dashboard in Excel?
A Consumer Electronics Service KPI Dashboard in Excel is an interactive performance monitoring tool designed to track, analyze, and visualize key service-related metrics for electronics repair and service centers. Instead of reviewing raw tables and disconnected reports, this dashboard converts service data into meaningful insights.
This dashboard focuses on KPIs related to service efficiency, turnaround time, service quality, cost control, and customer satisfaction. Since it is built entirely in Excel, it remains accessible, flexible, and easy to use without requiring complex BI tools.
Why Do Consumer Electronics Service Teams Need a KPI Dashboard?
Service operations in consumer electronics involve multiple moving parts. Technicians, spare parts, turnaround times, warranty claims, and service costs must align perfectly. However, when data stays unorganized, managers lose visibility.
A Consumer Electronics Service KPI Dashboard in Excel solves this challenge by:
- Centralizing all service KPIs in one place
- Providing instant Month-to-Date (MTD) and Year-to-Date (YTD) views
- Highlighting gaps between actual performance and targets
- Supporting faster and more confident decisions
As a result, service managers gain control, while technicians receive clearer performance direction.
How Does a Consumer Electronics Service KPI Dashboard in Excel Work?
This dashboard uses structured worksheets, dropdown selections, formulas, and pivot-driven logic. Once you input actual, target, and previous-year numbers, the dashboard automatically calculates variances, trends, and indicators.
Moreover, the dashboard updates dynamically when you change the selected month or KPI. Therefore, you can analyze performance from multiple angles without rebuilding reports every time.
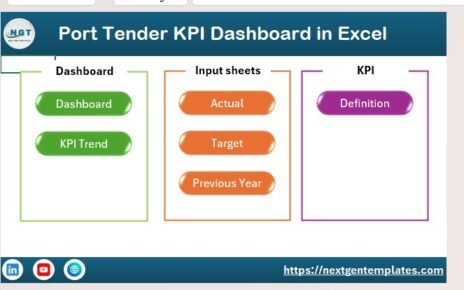
What Are the Core Worksheets in the Consumer Electronics Service KPI Dashboard in Excel?
This dashboard contains 7 well-structured worksheets, each serving a specific purpose. Together, they create a complete service performance management system.
Summary Page
The Summary Page works as the index of the dashboard. It provides easy navigation across all major sections.
Key Highlights of the Summary Page
- Acts as a central landing page
- Contains 6 navigation buttons
- Allows instant access to key worksheets
- Improves usability for non-technical users
Because of this design, users can move between sheets quickly without scrolling or searching.

Click to buy Consumer Electronics Service KPI Dashboard in Excel
Dashboard Sheet
The Dashboard Sheet serves as the heart of the entire KPI system. It displays consolidated performance metrics for all KPIs.
Key Features of the Dashboard Sheet
- Month selection dropdown available in cell D3
- Automatic refresh of all KPI values based on the selected month
- Displays:
MTD Actual
MTD Target
MTD Previous Year
YTD Actual
YTD Target
YTD Previous Year
Smart Variance Analysis
- Target vs Actual comparison
- Previous Year vs Actual comparison
- Conditional formatting with up and down arrows
- Quick identification of underperforming KPIs
As a result, managers instantly understand where service performance improves and where it needs attention.

Click to buy Consumer Electronics Service KPI Dashboard in Excel
Trend Sheet
The Trend Sheet focuses on deep KPI-level analysis. Instead of viewing all KPIs together, this sheet allows you to analyze one KPI at a time.
Key Functionalities of the Trend Sheet
- KPI selection dropdown in cell C3
- Displays:
KPI Group
KPI Unit
KPI Type (Lower the Better or Upper the Better)
KPI Formula
KPI Definition
Visual Trend Analysis
- MTD trend chart for Actual, Target, and Previous Year
- YTD trend chart for Actual, Target, and Previous Year
Because of this, service leaders can identify long-term performance patterns instead of reacting only to monthly numbers.

Click to buy Consumer Electronics Service KPI Dashboard in Excel
Actual Numbers Input
The Actual Numbers Input Sheet is where you enter real service performance data.
Key Input Logic
- Month selection in cell E1
- Enter the first month of the financial year in cell E1
- Input MTD and YTD actual values for each KPI
Since the dashboard pulls data directly from this sheet, accuracy here ensures reliable insights everywhere else.

Target Sheet
The Target Sheet defines expected service performance.
What You Enter in the Target Sheet
- Monthly MTD targets for each KPI
- Corresponding YTD targets
By maintaining clear targets, service teams stay aligned with business goals. Additionally, managers can quickly identify performance gaps.

Click to buy Consumer Electronics Service KPI Dashboard in Excel
Previous Year
The Previous Year Number Sheet stores historical service data.
Purpose of This Sheet
- Enter last year’s MTD and YTD values
- Enable year-on-year comparison
- Identify improvement or decline trends
Because benchmarking remains critical in service operations, this sheet adds strong analytical value.

Click to buy Consumer Electronics Service KPI Dashboard in Excel
KPI Definition Sheet
The KPI Definition Sheet acts as the knowledge base of the dashboard.
What This Sheet Contains
- KPI Name
- KPI Group
- Unit of Measurement
- KPI Formula
- KPI Definition
This sheet ensures clarity and consistency. Moreover, it helps new users understand KPIs without external documentation.

Click to buy Consumer Electronics Service KPI Dashboard in Excel
Which KPIs Can You Track in a Consumer Electronics Service KPI Dashboard?
This dashboard supports a wide range of service KPIs, such as:
- First-Time Fix Rate
- Average Repair Turnaround Time
- Service Cost per Job
- Warranty Claim Rate
- Technician Productivity
- Repeat Repair Rate
- Customer Complaint Resolution Time
You can easily customize KPIs based on your service model.
Advantages of Consumer Electronics Service KPI Dashboard in Excel
Using this dashboard delivers measurable benefits for service teams and management.
Key Advantages
- Centralized KPI monitoring
- Faster decision-making
- Clear MTD and YTD visibility
- Easy comparison with targets and past performance
- No dependency on complex BI tools
- Fully customizable in Excel
As a result, organizations improve service quality while reducing operational chaos.
How Does This Dashboard Improve Service Decision-Making?
This dashboard replaces guesswork with data-driven clarity. Since managers see performance gaps instantly, they act faster. Moreover, technicians receive focused improvement areas instead of vague feedback.
Because insights appear visually, communication across teams becomes simpler and more effective.
Best Practices for the Consumer Electronics Service KPI Dashboard in Excel
Following best practices ensures maximum value from the dashboard.
Best Practices
- Update actual data regularly
- Validate data entries before review
- Keep KPI definitions clear and simple
- Review trends instead of only monthly numbers
- Align targets with realistic service capacity
- Train users on reading KPI indicators
When teams follow these practices, the dashboard becomes a reliable performance partner.
Opportunities for Improvement in the Dashboard
Although this dashboard works effectively, you can enhance it further.
Possible Enhancements
- Add technician-level performance analysis
- Include service category filters
- Integrate customer satisfaction scores
- Automate data input using Power Query
- Add alert flags for critical KPIs
These enhancements increase analytical depth while keeping Excel as the core platform.
Who Should Use a Consumer Electronics Service KPI Dashboard in Excel?
This dashboard suits multiple roles, including:
- Service Center Managers
- Operations Heads
- Quality Assurance Teams
- Warranty Management Teams
- Business Owners in Electronics Services
Since the dashboard uses Excel, even small service centers can adopt it easily.
Conclusion
A Consumer Electronics Service KPI Dashboard in Excel transforms raw service data into actionable insights. Instead of relying on disconnected reports, service teams gain a centralized, dynamic, and easy-to-use performance management system.
By tracking MTD and YTD KPIs, comparing targets, and analyzing trends, organizations improve service efficiency, reduce costs, and enhance customer satisfaction. When you implement best practices and maintain data discipline, this dashboard becomes an indispensable operational tool.
Frequently Asked Questions (FAQs)
What is a Consumer Electronics Service KPI Dashboard in Excel used for?
It helps monitor, analyze, and improve service performance by tracking key service-related KPIs in one interactive Excel dashboard.
Can I customize KPIs in this dashboard?
Yes, you can fully customize KPI names, formulas, groups, and targets based on your service requirements.
Does this dashboard require advanced Excel skills?
No, basic Excel knowledge is enough to use and maintain this dashboard effectively.
Can this dashboard handle multiple service centers?
Yes, with proper data structuring, you can extend it to support multiple service locations.
How often should I update the data?
You should update actual numbers monthly or weekly to ensure accurate insights.
Is this dashboard suitable for small service businesses?
Absolutely. Since it uses Excel, it works well for both small service centers and large operations.
Visit our YouTube channel to learn step-by-step video tutorials
Watch the step-by-step video tutorial:
Click to buy Consumer Electronics Service KPI Dashboard in Excel