In today’s digital-first world, content drives business growth. Every brand publishes blogs, social media posts, landing pages, newsletters, and marketing campaigns to attract audiences and increase engagement. However, managing large volumes of content becomes challenging when teams rely on scattered spreadsheets or manual tracking systems.Therefore, organizations increasingly adopt a Copywriting & Content Creation Dashboard in Power BI to centralize content analytics, monitor productivity, and improve performance decisions.
This detailed guide explains everything you need to know about the Copywriting & Content Creation Dashboard in Power BI, including its structure, benefits, features, advantages, best practices, and frequently asked questions.What Is a Copywriting & Content Creation Dashboard in Power BI?
A Copywriting & Content Creation Dashboard in Power BI is an interactive business intelligence solution designed to track content production, engagement performance, workflow efficiency, and team productivity using visual analytics.
Instead of manually reviewing multiple files, content managers analyze performance from a single dashboard.
The dashboard helps teams:
- Monitor content progress from draft to publishing
- Track engagement metrics and clicks
- Compare estimated vs actual working hours
- Analyze content performance by platform and category
- Identify workflow bottlenecks quickly
As a result, teams make faster decisions and improve content strategy continuously.
Click to buy Copywriting & Content Creation Dashboard in Power BI
Why Do Content Teams Need a Content Creation Dashboard?
Content marketing involves multiple moving parts. Writers, editors, designers, and marketers collaborate daily. Without proper tracking, confusion increases quickly.
Common Challenges Without a Dashboard
- Content deadlines get missed frequently
- Teams cannot track workload accurately
- Engagement performance remains unclear
- Managers struggle to measure productivity
- Reporting consumes too much time
However, when teams implement a Power BI dashboard, they gain structured visibility into every stage of content creation.
How Does Power BI Improve Content Management?
Power BI transforms raw content data into interactive visuals. Consequently, users instantly understand performance trends.
Key improvements include:
- Real-time performance monitoring
- Automated reporting dashboards
- Interactive slicers for filtering insights
- Easy comparison across platforms and categories
- Data-driven editorial planning
Because Power BI updates visuals dynamically, decision-makers always work with current insights.
Structure of the Copywriting & Content Creation Dashboard in Power BI
This dashboard contains five powerful analytical pages, each designed to answer specific business questions.
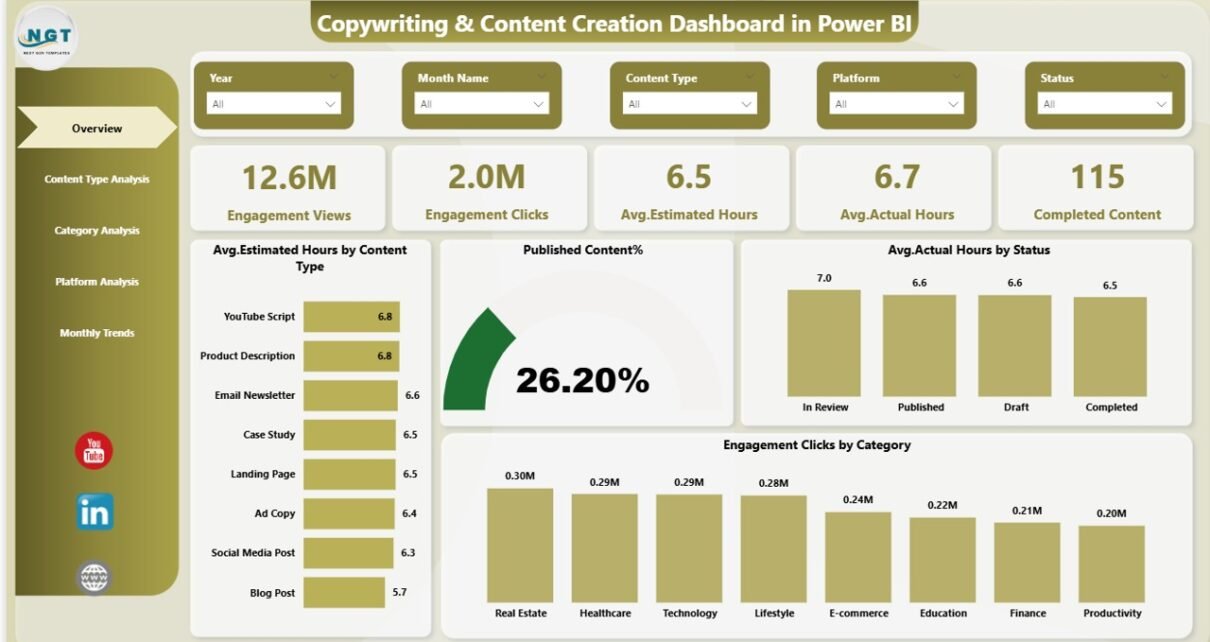
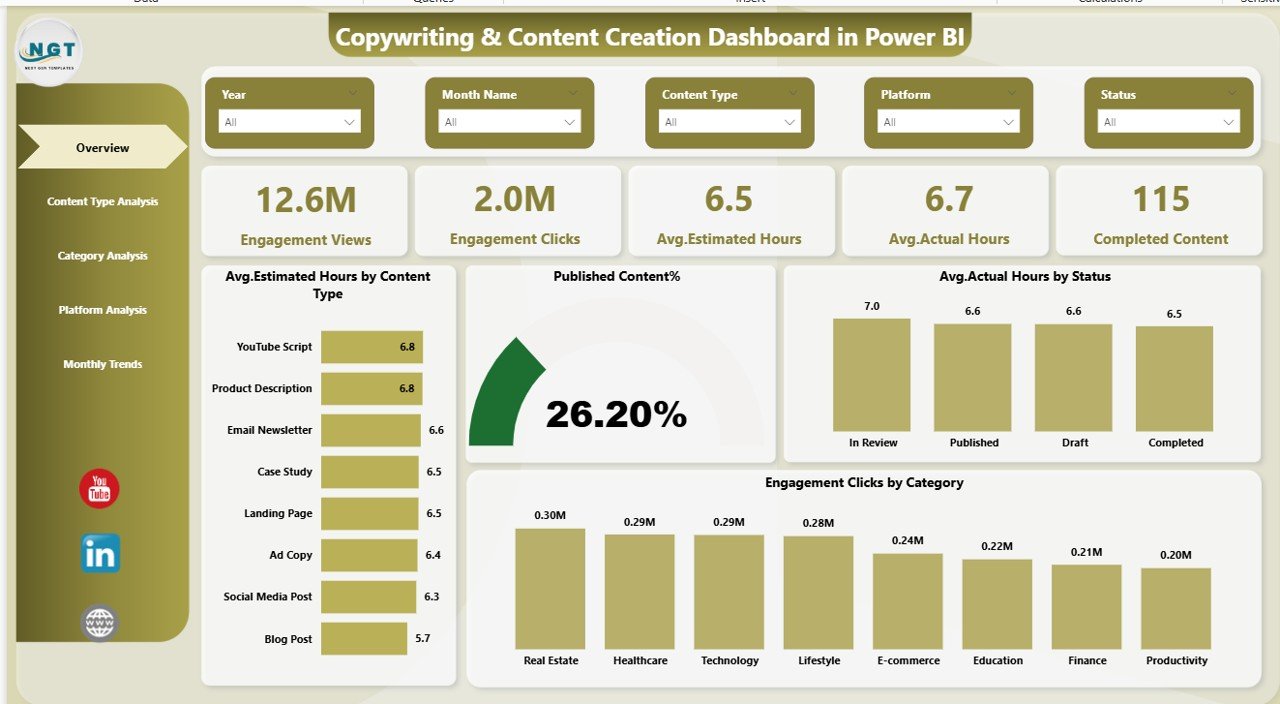
Overview Page – The Command Center of Content Performance
The Overview Page acts as the main dashboard where users get a quick snapshot of overall performance.
KPI Cards Available
- Engagement Views
- Engagement Clicks
- Average Estimated Hours
- Average Actual Hours
- Completed Content
These KPIs instantly show productivity and engagement health.
Charts Included
- Avg. Estimated Hours by Content Type
- Published Content %
- Avg. Actual Hours by Status
- Engagement Clicks by Category
Therefore, managers immediately understand workload distribution and performance results.
Why This Page Matters
Because leadership often needs quick insights, this page provides instant answers without deep analysis.
Click to buy Copywriting & Content Creation Dashboard in Power BI
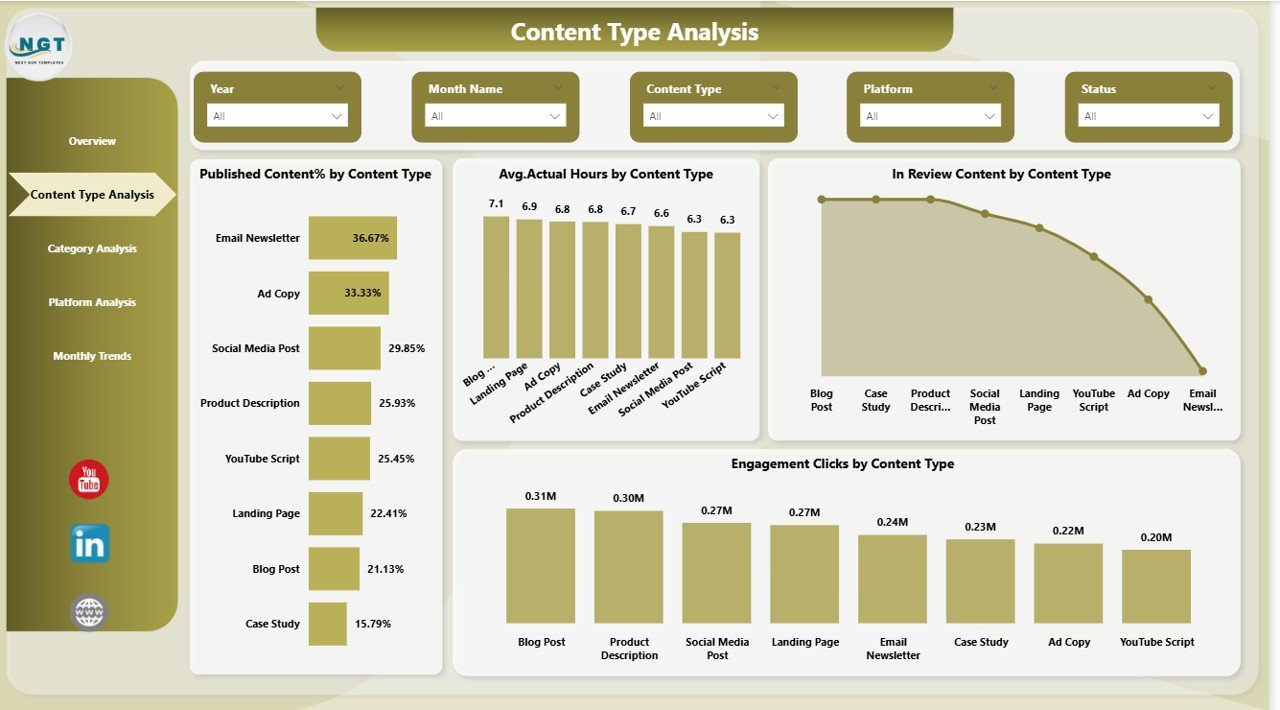
Content Type Analysis – Which Content Performs Best?
Different content formats produce different results. Blogs, videos, social posts, and email campaigns require different effort levels.
This page focuses on analyzing performance based on content type.
Charts Included
- Published Content % by Content Type
- Avg. Actual Hours by Content Type
- In-Review Content by Content Type
- Engagement Clicks by Content Type
Insights You Can Discover
- Which content type generates maximum engagement
- Which format consumes more production time
- Where approval delays occur
- What content delivers higher ROI
As a result, teams allocate resources more efficiently.
Click to buy Copywriting & Content Creation Dashboard in Power BI
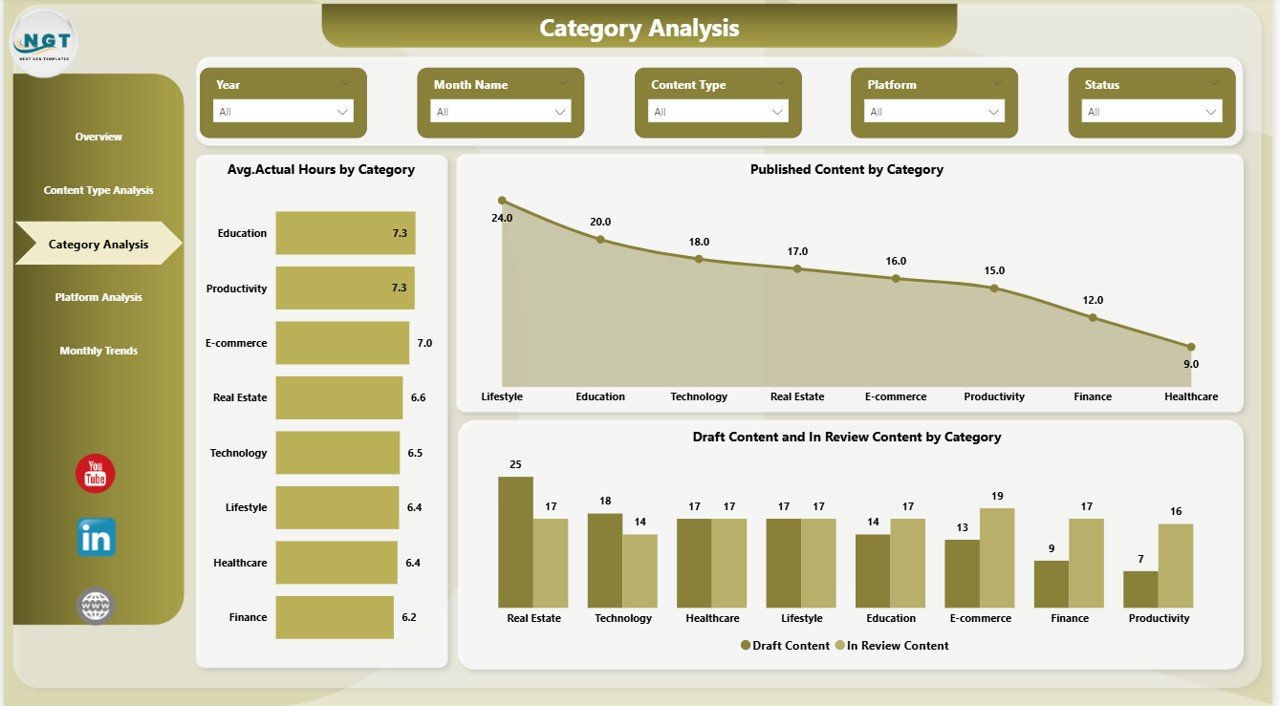
Category Analysis – Understanding Content Topics
Content categories represent themes such as marketing, education, product updates, or tutorials.
This page helps teams evaluate category performance.
Charts Included
- Avg. Actual Hours by Category
- Published Content by Category
- Draft Content and In-Review Content by Category
Key Benefits
- Identify high-performing topics
- Detect slow-moving categories
- Balance editorial calendars
- Improve topic strategy
Consequently, teams produce content aligned with audience interests.
Click to buy Copywriting & Content Creation Dashboard in Power BI
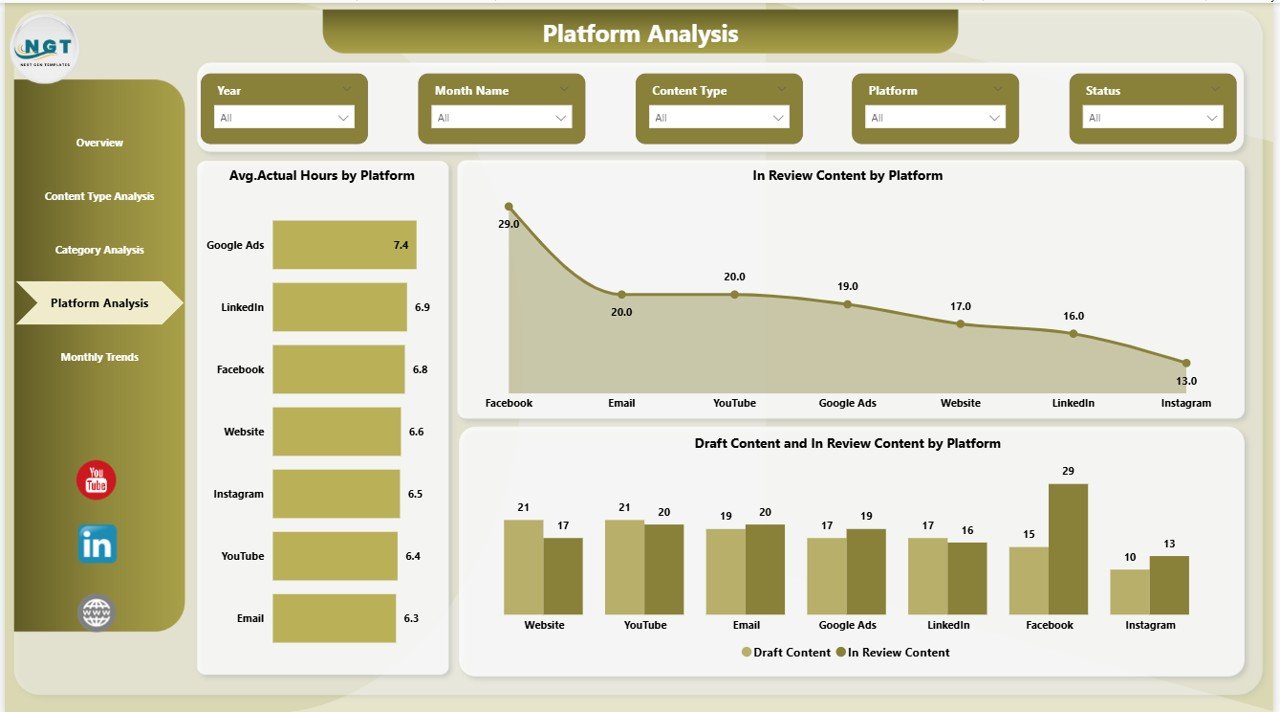
Platform Analysis – Where Does Content Work Best?
Modern content spreads across multiple platforms such as websites, LinkedIn, YouTube, Instagram, and newsletters.
The Platform Analysis Page compares performance across publishing channels.
Charts Included
- Avg. Actual Hours by Platform
- In-Review Content by Platform
- Draft and In-Review Content by Platform
Questions This Page Answers
- Which platform requires more effort?
- Where does approval delay happen most?
- Which channel needs workflow improvement?
Therefore, marketers optimize distribution strategies effectively.
Click to buy Copywriting & Content Creation Dashboard in Power BI
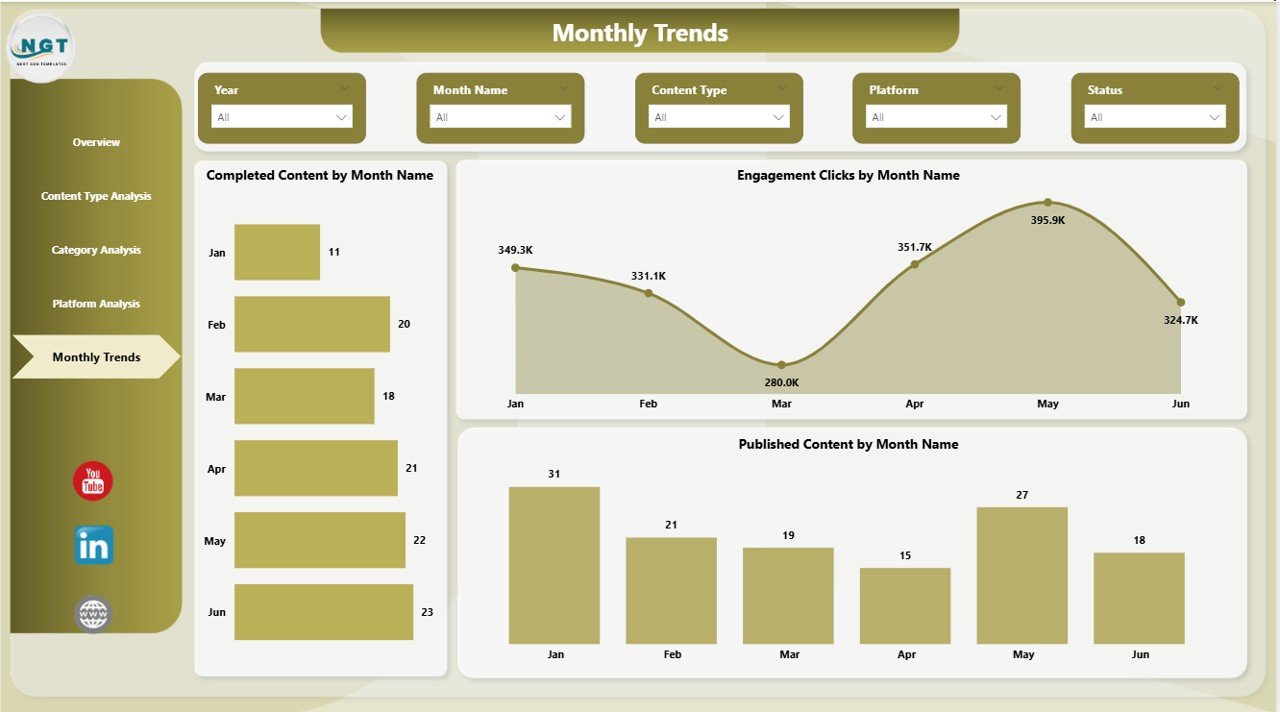
Monthly Trends – Tracking Growth Over Time
Trend analysis helps teams understand long-term performance patterns.
Charts Included
- Completed Content by Month Name
- Engagement Clicks by Month Name
- Published Content by Month Name
Why Monthly Trends Matter
- Measure growth consistency
- Evaluate campaign success
- Forecast future workload
- Improve planning accuracy
Because trends reveal patterns, teams avoid reactive decision-making.
Click to buy Copywriting & Content Creation Dashboard in Power BI
What KPIs Can You Track Using This Dashboard?
The dashboard monitors essential content performance indicators.
Productivity KPIs
- Completed content count
- Estimated vs actual hours
- Workflow status tracking
Engagement KPIs
- Engagement views
- Engagement clicks
- Published content percentage
Operational KPIs
- Draft content volume
- Review pipeline status
- Platform efficiency
These KPIs together provide a complete performance picture.
Advantages of Copywriting & Content Creation Dashboard in Power BI
Organizations experience significant benefits after implementing this dashboard.
Centralized Content Management
Teams access all performance metrics in one place.
Better Productivity Tracking
Managers compare estimated and actual effort easily.
Faster Decision-Making
Real-time visuals eliminate manual reporting delays.
Improved Content Strategy
Data clearly shows what works and what does not.
Workflow Transparency
Everyone understands content status instantly.
Performance Accountability
Teams track progress objectively.
How Does This Dashboard Improve Content Strategy?
A strong content strategy relies on accurate insights.
This dashboard helps because it:
- Highlights high-performing content formats
- Shows audience engagement behavior
- Identifies workflow inefficiencies
- Improves publishing consistency
As a result, teams shift from guesswork to data-driven planning.
Who Can Benefit from This Dashboard?
Many professionals can use this solution effectively.
Content Teams
Writers and editors track workload and deadlines.
Marketing Managers
Managers evaluate campaign performance quickly.
Digital Agencies
Agencies monitor multiple client projects efficiently.
Business Owners
Leaders understand marketing ROI clearly.
Social Media Managers
Managers compare platform performance easily.
How to Use the Copywriting Dashboard Effectively?
Although the dashboard is user-friendly, structured usage improves results.
Step-by-Step Workflow
- Import content tracking data into Power BI.
- Refresh data regularly.
- Use slicers to filter categories or platforms.
- Review overview KPIs daily.
- Analyze trends monthly.
Consequently, teams maintain consistent performance monitoring.
Best Practices for the Copywriting & Content Creation Dashboard in Power BI
Following best practices ensures maximum value.
- Maintain Clean Data
Always use standardized content categories.
- Update Data Regularly
Frequent updates keep insights accurate.
- Define Clear KPIs
Choose measurable engagement metrics.
- Use Consistent Naming
Keep platform and content type labels uniform.
- Monitor Workflow Stages
Track draft, review, and published stages carefully.
- Review Trends Monthly
Trend analysis improves strategic planning.
What Insights Can Managers Gain from This Dashboard?
Managers can answer important questions quickly:
- Which content type drives engagement?
- Which platform performs best?
- Where do delays occur?
- How efficient is the team?
- Are estimated hours realistic?
Therefore, leadership improves both productivity and marketing outcomes.
Future of Content Analytics with Power BI
Content analytics continues to evolve rapidly.
In the future, dashboards will include:
- AI-driven content recommendations
- Predictive engagement forecasting
- Automated performance alerts
- Real-time collaboration analytics
Therefore, adopting Power BI today prepares organizations for advanced analytics tomorrow.
Conclusion
The Copywriting & Content Creation Dashboard in Power BI transforms how teams manage content operations. Instead of relying on manual tracking, organizations gain structured visibility into productivity, engagement, and workflow performance.
Because the dashboard combines multiple analytical views—Overview, Content Type, Category, Platform, and Monthly Trends—users understand content performance from every angle.
Moreover, data-driven insights help teams optimize strategy, improve efficiency, and increase engagement consistently.
In a competitive digital environment, organizations that measure content performance accurately always stay ahead. Therefore, implementing a Power BI content dashboard becomes not just helpful but essential.
Frequently Asked Questions (FAQs)
What is a Copywriting & Content Creation Dashboard in Power BI?
It is an interactive analytics dashboard that tracks content production, engagement metrics, workflow status, and performance insights using Power BI visuals.
Who should use this dashboard?
Content creators, marketing managers, agencies, and business owners who manage digital content workflows benefit the most.
Can beginners use this dashboard?
Yes. Power BI provides user-friendly filters and visuals, so beginners can easily analyze data without advanced technical skills.
What data is required for the dashboard?
You typically need:
- Content title
- Content type
- Category
- Platform
- Status
- Estimated hours
- Actual hours
- Engagement metrics
How often should the dashboard be updated?
Teams should update data weekly or daily depending on publishing frequency.
Does this dashboard help improve productivity?
Yes. It compares estimated and actual hours, helping managers identify inefficiencies and improve planning accuracy.
Why use Power BI instead of Excel for content analytics?
Power BI offers interactive visuals, automated updates, advanced filtering, and scalable analytics beyond traditional spreadsheets.
Can this dashboard support multiple platforms?
Absolutely. You can track website content, social media posts, email campaigns, and more within one dashboard.
Visit our YouTube channel to learn step-by-step video tutorials
Watch the step-by-step video tutorial:
Click to buy Copywriting & Content Creation Dashboard in Power BI