Copywriting & Content Creation KPI Dashboard In today’s digital world, content powers business growth. From brand storytelling to SEO strategy, every piece of content counts toward engagement, visibility, and conversion. But how can teams measure the success of their content and copywriting efforts effectively?
That’s where the Copywriting & Content Creation KPI Dashboard in Power BI becomes a game-changer. This dashboard transforms scattered performance data into clear insights, empowering teams to analyze writing productivity, quality, reach, and engagement — all in one interactive, easy-to-use platform.
Click to Purchases Copywriting & Content Creation KPI Dashboard in Power BI
What Is the Copywriting & Content Creation KPI Dashboard in Power BI?
A Copywriting & Content Creation KPI Dashboard is a powerful analytics solution built using Microsoft Power BI that helps marketers, writers, and content strategists track their performance across multiple metrics.
Copywriting & Content Creation KPI Dashboard in Power BIBy connecting this dashboard to a structured Excel data source, teams can visualize content performance trends, compare targets versus actual results, and identify which areas of copywriting and content creation need improvement.
It bridges the gap between creative storytelling and measurable business impact, allowing decision-makers to take data-driven actions that enhance efficiency, visibility, and ROI.
Structure of the Dashboard
The dashboard consists of three key pages inside the Power BI Desktop file, each designed to offer a different level of insight and control.
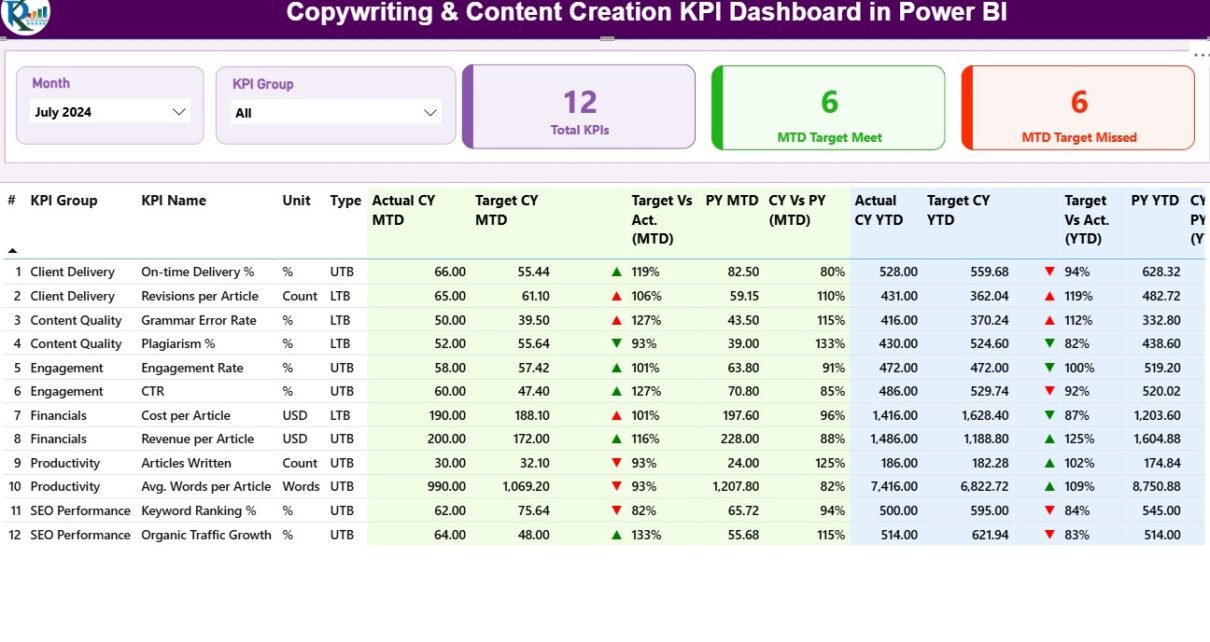
1. Summary Page
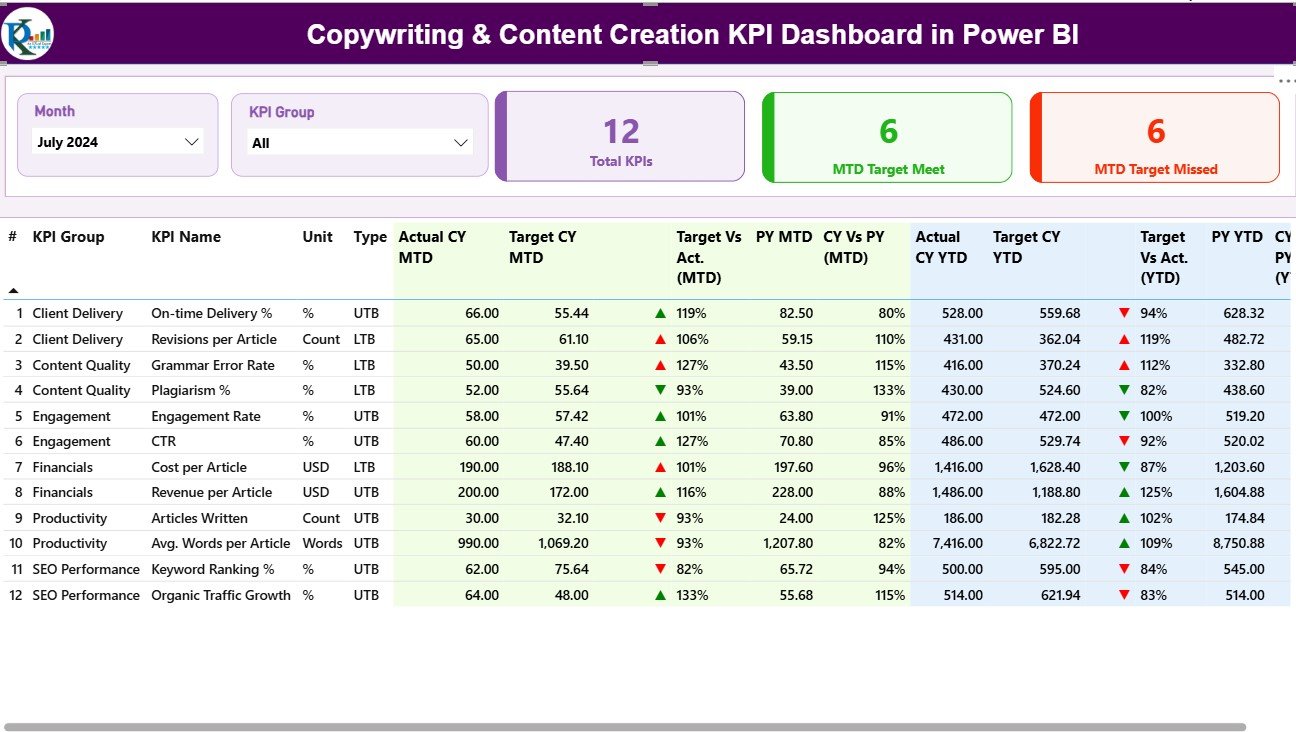
This is the main dashboard page — the command center for all content KPIs.
-
Filters and Slicers: Month and KPI Group slicers appear at the top, allowing users to filter metrics dynamically.
-
KPI Overview Cards:
-
Total KPIs Count
-
Month-to-Date (MTD) Target Met Count
-
MTD Target Missed Count
-
-
Detailed KPI Table:
Each KPI row includes critical details such as:-
KPI Number: Sequential identifier for easy reference.
-
KPI Group: Category of the metric (e.g., Productivity, Engagement, Quality).
-
KPI Name: The specific metric being measured (e.g., Article Turnaround Time, Readability Score).
-
Unit: The unit of measurement — percentage, count, or rating.
-
Type: Whether the KPI is LTB (Lower the Better) or UTB (Upper the Better).
-
Actual CY MTD / Target CY MTD: Actual and target values for the current month.
-
MTD Icons: Green ▲ and red ▼ icons visually indicate if KPIs met or missed their targets.
-
Target vs Actual (MTD): Displays the performance percentage.
-
PY MTD: Shows last year’s values for the same month.
-
CY vs PY (MTD): Compares current versus previous year MTD results.
-
YTD Metrics:
-
Actual CY YTD, Target CY YTD, and PY YTD track year-to-date numbers.
-
Icons and percentage comparisons instantly reveal whether performance is improving.
-
-
This layout ensures teams can monitor every KPI at a glance, saving time and improving clarity.
2. KPI Trend Page
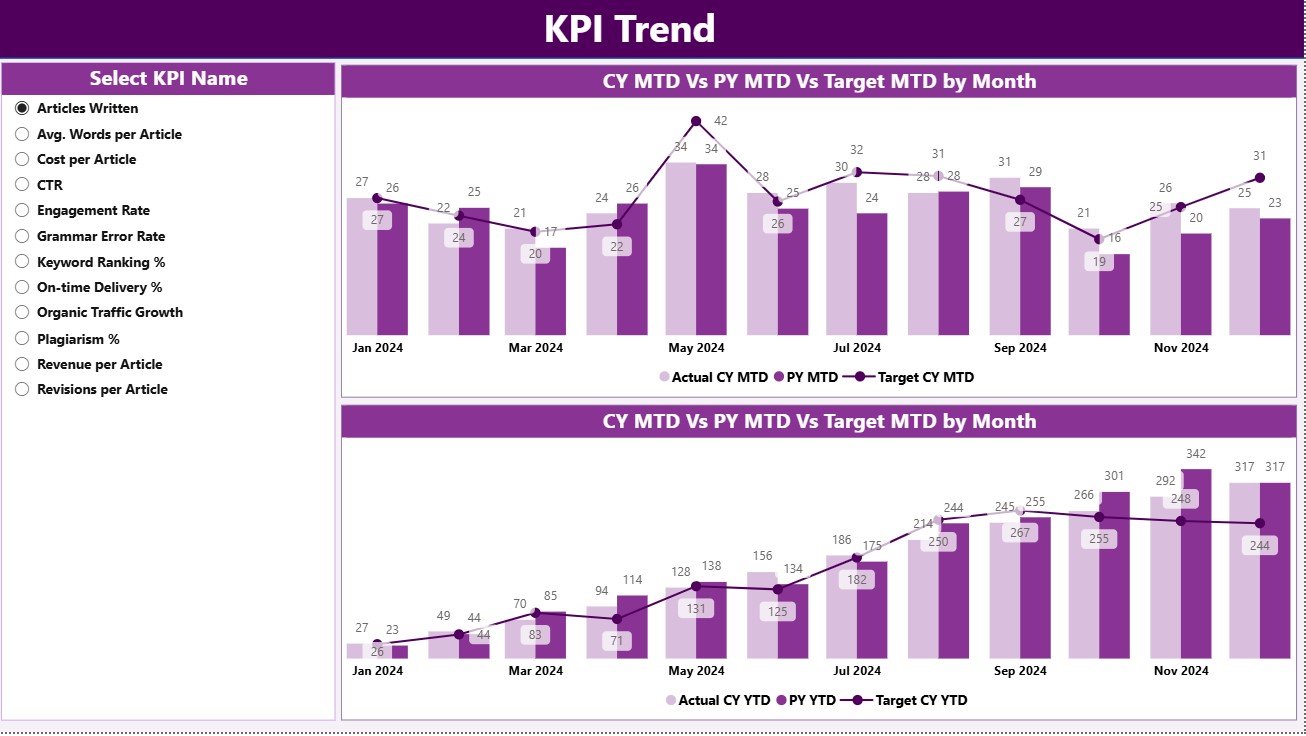
The KPI Trend page highlights performance over time, making it easier to identify progress, consistency, or areas that need intervention.
-
Combo Charts: Two powerful combo charts visualize Actual, Target, and Previous Year data for both MTD and YTD performance.
-
Dynamic Slicer: A slicer on the left side enables users to select specific KPI names for detailed trend tracking.
This page is ideal for content directors or managers who want to assess how their teams perform month after month.
3. KPI Definition Page
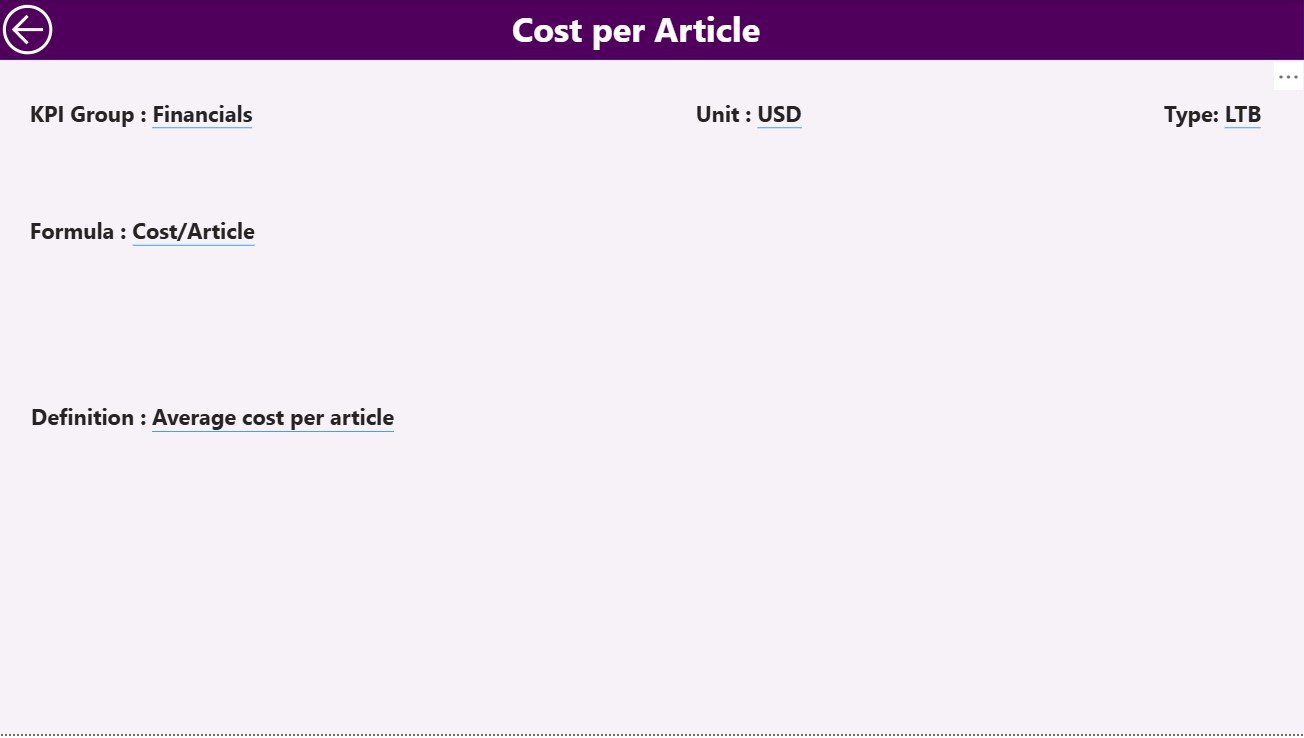
The KPI Definition page serves as a drill-through layer for detailed exploration.
From the Summary Page, users can right-click on a KPI to drill through and view its definition, formula, and calculation method.
-
Key Fields Include:
-
KPI Number
-
KPI Group
-
KPI Name
-
Unit
-
Formula
-
Definition
-
Type (LTB or UTB)
-
A convenient “Back” button in the top-left corner allows users to return instantly to the main page. This feature ensures a seamless analytical experience.
Click to Purchases Copywriting & Content Creation KPI Dashboard in Power BI
Excel Data Source Structure
The entire dashboard runs on a structured Excel workbook that feeds Power BI with accurate, up-to-date numbers. The Excel file includes three key worksheets:
1. Input_Actual Sheet
This sheet captures actual monthly performance metrics.
Fields:
-
KPI Name
-
Month (use the first day of each month)
-
MTD Value
-
YTD Value
This enables consistent data entry and ensures accurate trend analysis.
2. Input_Target Sheet
The Target sheet records the performance goals for each KPI.
Fields:
-
KPI Name
-
Month (first day of the month)
-
MTD Target
-
YTD Target
By comparing this sheet with the actual data, the dashboard calculates Target vs Actual percentages and displays performance trends.
3. KPI Definition Sheet
This reference sheet provides essential information about each KPI.
Fields:
-
KPI Number
-
KPI Group
-
KPI Name
-
Unit
-
Formula
-
Definition
-
Type (LTB / UTB)
It ensures clarity for teams managing multiple content metrics, maintaining uniform understanding across departments.
Why Use Power BI for Copywriting and Content Creation KPIs?
While Excel remains an excellent data entry and calculation tool, Power BI takes visualization and analytics to a new level.
Here’s why using Power BI for content KPIs is a smart decision:
-
Automation: Data refresh happens instantly once Excel is updated.
-
Interactivity: Slicers and filters allow instant customization of reports.
-
Visualization: KPIs come to life through cards, icons, charts, and dynamic visuals.
-
Comparison Power: Compare actuals against both target and previous year simultaneously.
-
Decision Support: Managers can make data-driven creative decisions in real time.
-
Accessibility: Share reports securely with team members and management.
Together, Excel and Power BI form a seamless ecosystem for data-driven content performance management.
Key Metrics Tracked in the Dashboard
The dashboard can measure a variety of content-specific KPIs, such as:
-
Content Volume Metrics:
-
Articles Published per Month
-
Word Count per Writer
-
-
Quality Metrics:
-
Average Readability Score
-
Error Rate per 1,000 Words
-
SEO Score
-
-
Engagement Metrics:
-
Click-Through Rate (CTR)
-
Average Session Duration
-
Bounce Rate
-
-
Productivity Metrics:
-
Average Turnaround Time per Article
-
Edits per Submission
-
Revision Ratio
-
-
Performance Metrics:
-
Target Achievement Rate
-
MTD vs YTD Comparison
-
By tracking these metrics, organizations can ensure that creative teams align their work with business goals.
Advantages of the Copywriting & Content Creation KPI Dashboard in Power BI
The benefits of using this Power BI dashboard extend across creative, strategic, and operational levels.
🎯 Strategic Advantages
-
Provides a holistic view of content performance across departments.
-
Enables better decision-making with real-time, accurate insights.
-
Aligns writing goals with overall marketing strategy.
💡 Operational Advantages
-
Reduces time spent manually compiling reports.
-
Detects performance gaps instantly using visuals and color cues.
-
Allows month-over-month trend comparisons for deeper analysis.
📈 Creative Team Advantages
-
Helps writers understand which types of content perform best.
-
Motivates teams by making goals transparent and measurable.
-
Encourages a performance-driven culture without sacrificing creativity.
📊 Data-Driven Advantages
-
Centralizes all KPI data in one place.
-
Provides measurable outcomes for creative decisions.
-
Simplifies report sharing with stakeholders.
In short, this dashboard helps organizations turn creativity into measurable success.
How to Use the Dashboard Effectively
Using the dashboard is simple and intuitive. Follow these steps:
-
Update Excel Data:
Enter actual and target values in the respective sheets. -
Refresh Power BI:
Open the Power BI file and refresh to update visuals automatically. -
Use Filters:
Select the Month or KPI Group from the slicers to view relevant data. -
Drill Through:
Right-click a KPI to view its detailed definition and calculation method. -
Analyze Trends:
Move to the KPI Trend page to observe MTD and YTD progress. -
Share Insights:
Export or publish the dashboard for team or management review.
This streamlined process ensures consistent performance monitoring throughout the content cycle.
Click to Purchases Copywriting & Content Creation KPI Dashboard in Power BI
Best Practices for Using the Copywriting & Content Creation KPI Dashboard
Implementing best practices ensures accurate data, reliable insights, and maximum value.
✅ Data Management
-
Keep data entry consistent with correct KPI names and units.
-
Update Excel sheets at the end of each month to maintain accuracy.
✅ Visualization Clarity
-
Avoid overcrowding charts — focus on key insights.
-
Use color coding (green for success, red for underperformance).
✅ KPI Relevance
-
Choose KPIs aligned with business objectives, such as engagement, conversion, and productivity.
-
Review KPI definitions quarterly to ensure continued relevance.
✅ Collaboration and Accessibility
-
Share reports with all team members to build accountability.
-
Enable drill-through access for department heads or leads.
✅ Continuous Improvement
-
Compare performance with historical data to identify trends.
-
Use insights to optimize content strategy and workflow efficiency.
By following these best practices, teams can maintain data integrity and achieve sustained improvement.
How This Dashboard Helps Creative Teams Succeed
The Copywriting & Content Creation KPI Dashboard turns creativity into measurable outcomes. Here’s how:
-
Empowers Writers: They can see how their content contributes to organizational goals.
-
Improves Quality: Identifies weak areas, such as readability or engagement, for improvement.
-
Streamlines Reporting: Managers can instantly review performance instead of analyzing multiple spreadsheets.
-
Encourages Goal-Oriented Work: Teams can focus on what truly matters — results.
This level of visibility not only improves accountability but also inspires teams to innovate within measurable parameters.
Conclusion
The Copywriting & Content Creation KPI Dashboard in Power BI empowers marketing, editorial, and creative teams to take charge of their data. It transforms raw numbers into visual insights, making performance tracking simple, intuitive, and impactful.
By combining Excel’s data structure with Power BI’s interactive visuals, the dashboard bridges creativity and analytics — ensuring that every content initiative aligns with measurable business goals.
From MTD vs YTD comparisons to detailed KPI drill-throughs, it provides everything needed to optimize content strategies, enhance productivity, and drive results.
If your organization wants to bring structure, transparency, and efficiency to content performance analysis, this dashboard is the ultimate solution.
Click to Purchases Copywriting & Content Creation KPI Dashboard in Power BI
Frequently Asked Questions (FAQs)
1. What is a Copywriting & Content Creation KPI Dashboard?
It’s a Power BI-based tool that tracks performance metrics (KPIs) for content and copywriting activities, showing both MTD and YTD results against targets.
2. Who can use this dashboard?
Content writers, copywriters, marketing teams, editors, content strategists, and managers who want to monitor and improve performance can use this dashboard.
3. Can I connect the dashboard to live data?
Yes. You can connect it to live Excel files, SharePoint folders, or cloud storage for automatic updates whenever new data is entered.
4. What are the benefits of using Power BI for content tracking?
Power BI provides dynamic visuals, interactive filters, and real-time insights, making data analysis faster, clearer, and more actionable than static spreadsheets.
5. How do I customize KPIs?
You can modify or add KPIs by updating the KPI Definition sheet in Excel. New metrics automatically appear in Power BI after data refresh.
6. What visual indicators are included?
Red ▼ and green ▲ icons show underperformance or success instantly for both MTD and YTD metrics.
7. Can I share the dashboard with my team?
Yes. You can export it as a PDF, publish it online, or share access through Power BI Service for collaborative review.
8. Does this dashboard support multi-year comparison?
Absolutely. It compares current year metrics with previous year values for both MTD and YTD, giving complete trend visibility.
9. What makes this dashboard unique?
Unlike generic templates, it is tailored for content teams — focusing on KPIs that measure creativity, engagement, and productivity.
10. How can I get started?
Simply fill in your KPI data in the provided Excel sheets, open the Power BI dashboard, and refresh. Within seconds, you’ll have a full content performance overview.
Click to Purchases Copywriting & Content Creation KPI Dashboard in Power BI
Visit our YouTube channel to learn step-by-step video tutorials
Watch the step-by-step video tutorial: