In today’s fast-moving business world, communication drives brand trust, employee engagement, and stakeholder confidence. However, many companies still manage communication budgets, campaigns, and engagement reports in scattered spreadsheets. As a result, leaders struggle to track performance. Moreover, teams fail to compare actual cost with budget in real time. Therefore, organizations need a centralized and interactive reporting system.
That is exactly where a Corporate Communications Dashboard in Excel becomes powerful.
Click to Purchases Corporate Communications Dashboard in Excel
In this detailed guide, you will learn:
-
What a Corporate Communications Dashboard in Excel is
-
Why corporate teams need it
-
Detailed explanation of all 5 pages
-
What data structure you should use
-
Key KPIs to track
-
Advantages of Corporate Communications Dashboard in Excel
-
Best Practices for the Corporate Communications Dashboard
-
Frequently Asked Questions with Answers
Let us explore everything step by step.
What Is a Corporate Communications Dashboard in Excel?
A Corporate Communications Dashboard in Excel is a ready-to-use performance tracking system designed to monitor communication budgets, campaign performance, audience engagement, and departmental communication effectiveness.
Instead of relying on static reports, this dashboard allows you to:
-
Track budget allocation
-
Monitor actual cost
-
Analyze engagement rate
-
Measure ongoing campaign percentage
-
Compare communication types and channels
-
Review monthly trends
Because Excel supports Pivot Tables, slicers, and dynamic charts, you can filter data instantly. As a result, managers gain clear insights. Furthermore, decision-makers identify cost gaps and engagement trends quickly.
Why Do Organizations Need a Corporate Communications Dashboard?
Corporate communication involves multiple departments, audience types, channels, and campaigns. However, without structured tracking:
-
Budgets exceed limits
-
Engagement drops unnoticed
-
Campaign ROI remains unclear
-
Departments overspend
-
Leadership loses visibility
Therefore, companies must track performance through measurable KPIs.
For example:
-
If Email campaigns show 18% engagement while Social Media shows 7%, leaders can reallocate budget.
-
If actual cost exceeds allocated budget by 12%, finance teams can intervene early.
-
If engagement improves month over month, teams can replicate winning strategies.
Hence, a Corporate Communications Dashboard in Excel provides clarity, control, and accountability.
What Are the Key Features of the Corporate Communications Dashboard in Excel?
This dashboard includes structured navigation and analytical pages.
Page Navigator
The Page Navigator appears on the left side. It allows users to switch between analytical pages easily. Therefore, users save time and avoid manual searching.
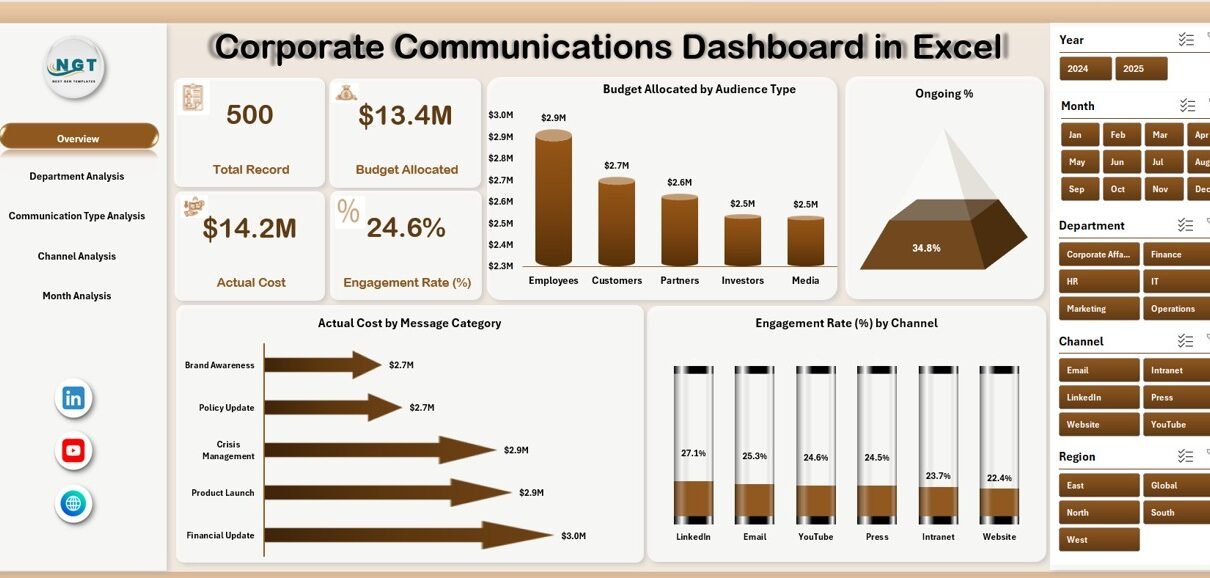
What Does the Overview Page Show?
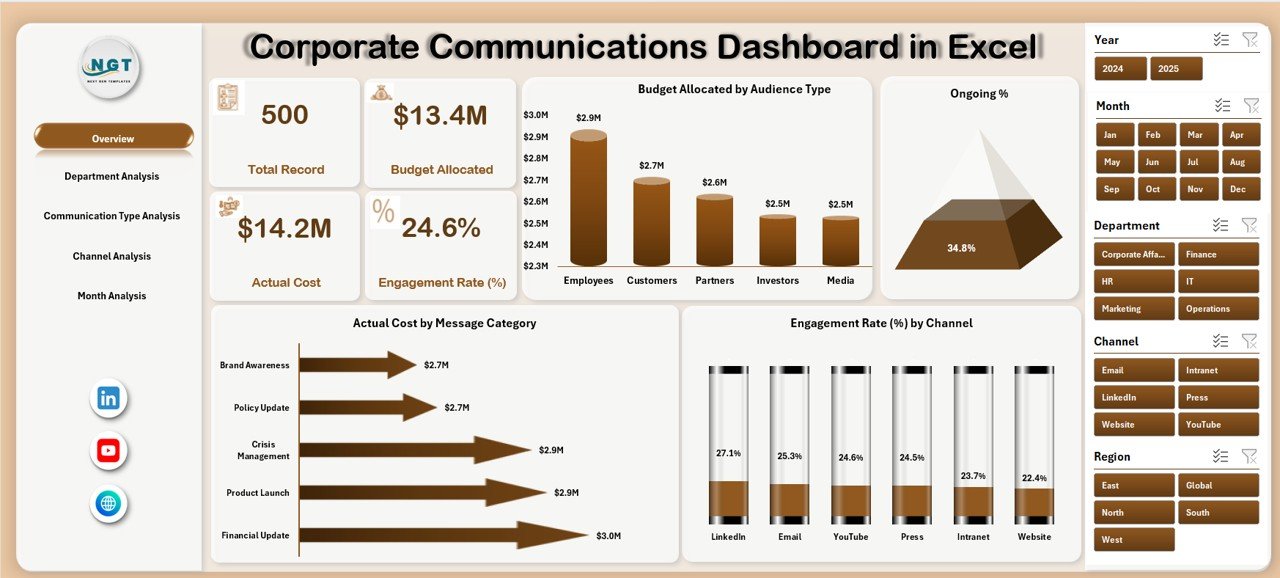
The Overview Page acts as the main summary page.
On this page, you will find:
-
Right-side slicer for filtering
-
4 KPI Cards
-
4 Analytical Charts
KPI Cards Display:
-
Total Budget Allocated
-
Total Actual Cost
-
Overall Engagement Rate
-
Ongoing Campaign %
These cards provide instant insight. As soon as you apply slicers, the numbers update automatically.
Charts on Overview Page:
-
Budget Allocation by Audience Type
-
Ongoing %
-
Actual Cost by Message Category
-
Engagement Rate by Channel
For example:
Click to Purchases Corporate Communications Dashboard in Excel
-
If Internal Communication receives 35% of budget, while External gets 65%, you see the split instantly.
-
If Engagement Rate by Channel shows Email at 22% and Social Media at 14%, you identify top-performing channels.
Therefore, the Overview page delivers a complete performance snapshot.
How Does Department Analysis Help Leaders?
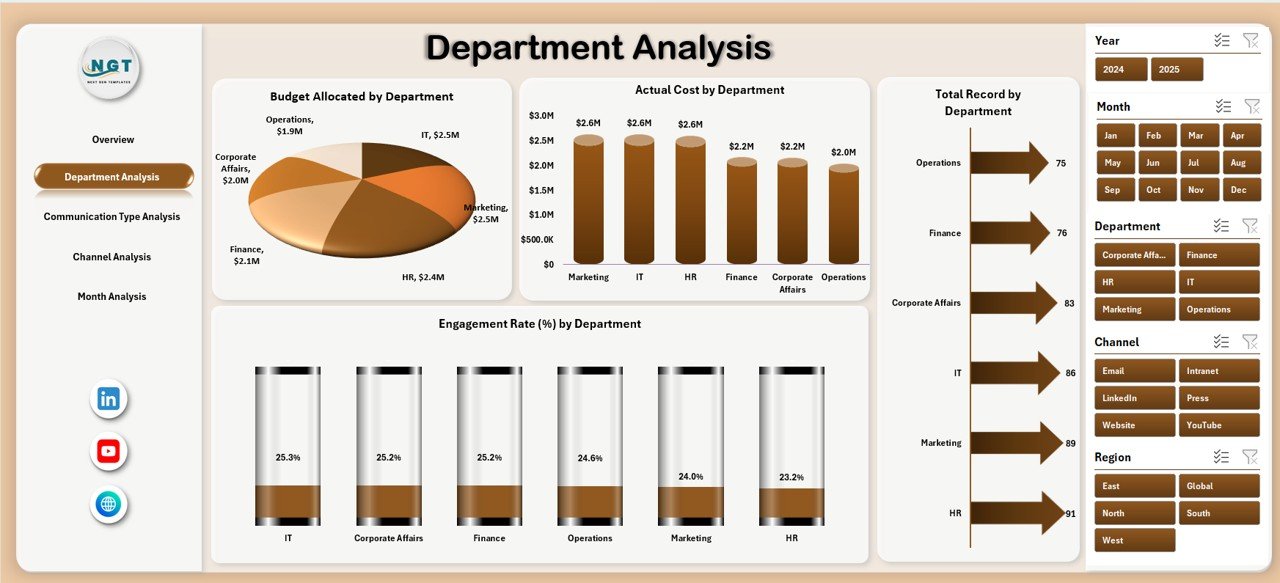
The Department Analysis Page provides department-wise breakdown.
This page includes:
-
Right-side slicer
-
4 Pivot Charts
Charts:
-
Budget Allocation by Department
-
Actual Cost by Department
-
Engagement Rate by Department
-
Total Records by Department
For example:
-
HR may allocate $25,000 budget but spend $27,500.
-
Marketing may show 19% engagement while Corporate Affairs shows 11%.
Because of this analysis, leadership can compare performance across departments. Moreover, they can identify overspending or low engagement instantly.
What Insights Does Communication Type Analysis Provide?
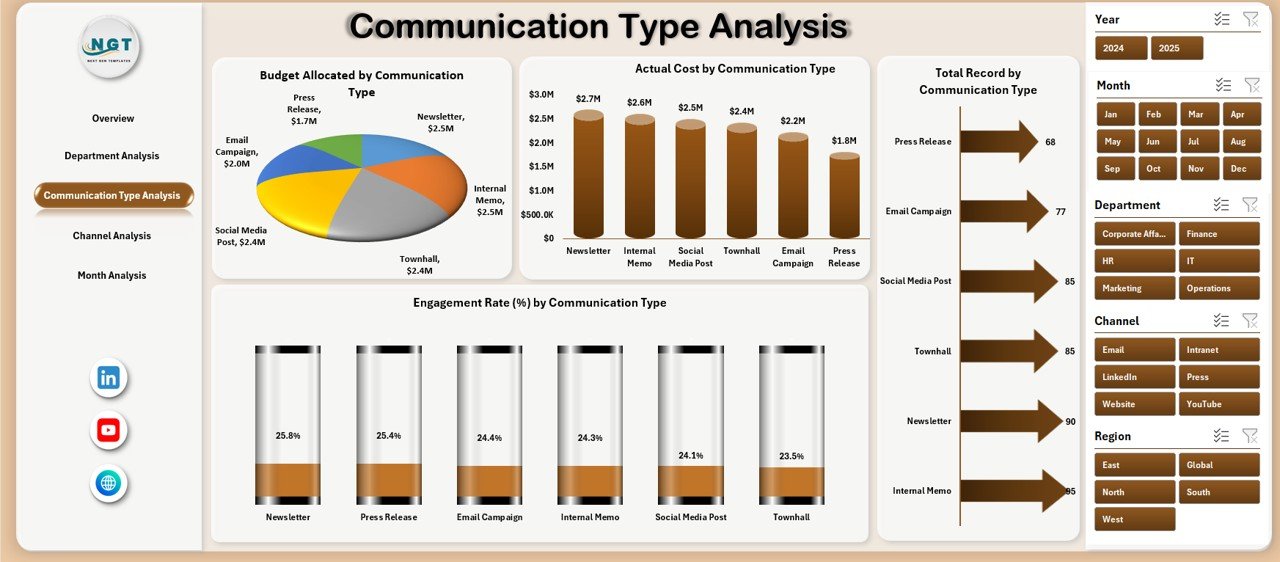
Corporate communication includes various types such as:
-
Press Release
-
Internal Memo
-
Newsletter
-
Event Communication
-
Social Media Campaign
The Communication Type Analysis Page shows performance by communication type.
Charts Included:
-
Budget Allocation by Communication Type
-
Actual Cost by Communication Type
-
Engagement Rate by Communication Type
-
Total Records by Communication Type
For instance:
-
Newsletters may drive 24% engagement.
-
Press releases may show only 8% engagement.
-
Events may consume 40% of the budget.
Therefore, teams can adjust strategy based on real results.
Why Is Channel Analysis Important?
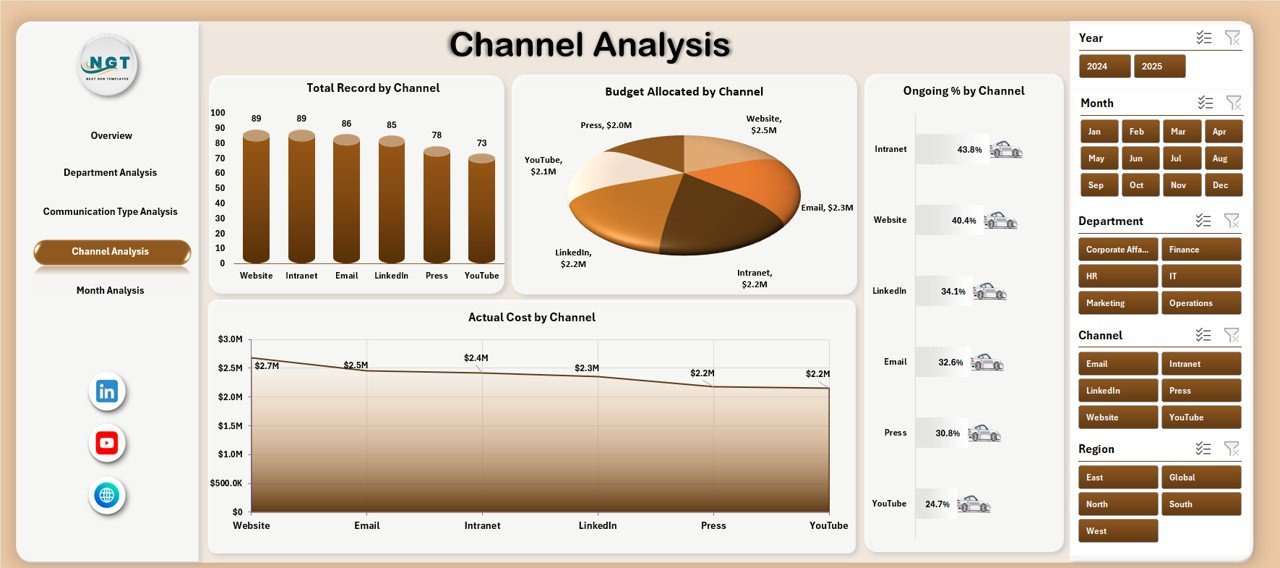
Every communication channel performs differently. Therefore, the Channel Analysis Page focuses on:
-
Budget Allocation by Channel
-
Actual Cost by Channel
-
Ongoing % by Channel
-
Total Records by Channel
Channels may include:
-
Email
-
Website
-
LinkedIn
-
Facebook
-
Print Media
-
Events
If Email generates higher engagement at lower cost, then leaders can shift budget accordingly. As a result, ROI improves significantly.
How Does Month Analysis Support Trend Tracking?
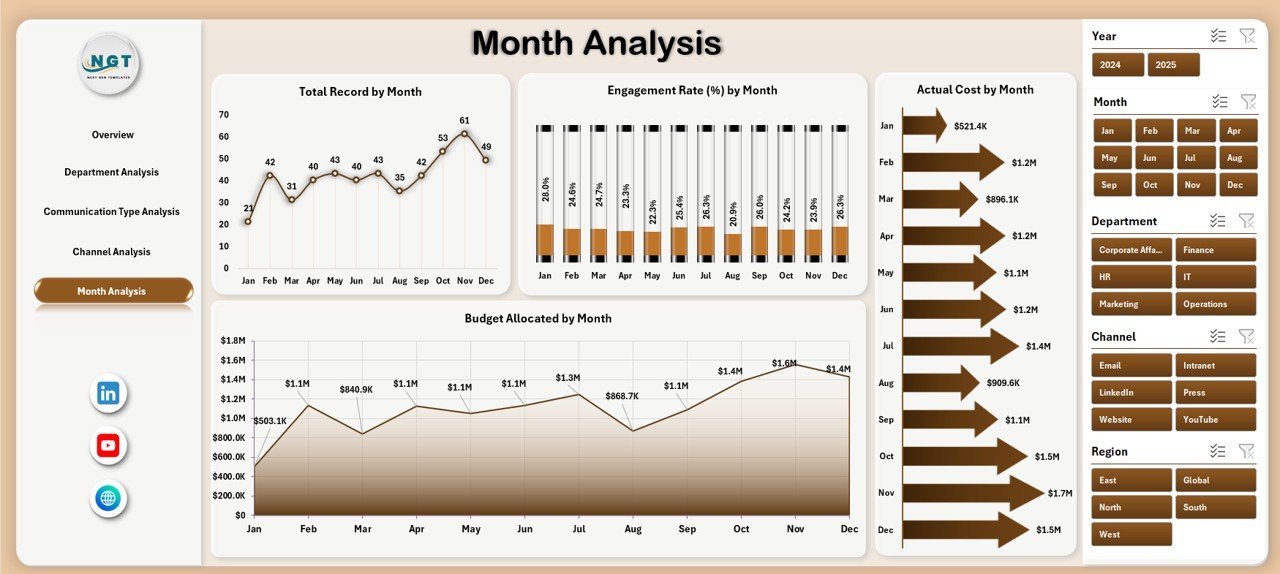
The Month Analysis Page tracks performance trends.
Charts Included:
-
Budget Allocation by Month
-
Actual Cost by Month
-
Engagement Rate % by Month
-
Total Records by Month
For example:
-
Engagement may increase from 12% in January to 21% in June.
-
Budget may spike in Q4 due to annual campaigns.
Therefore, month-wise tracking helps teams forecast better.
What Data Structure Should You Use?
Click to Purchases Corporate Communications Dashboard in Excel
To build this dashboard effectively, you need a structured Data Sheet.
Recommended Columns:
-
Date
-
Month
-
Department
-
Communication Type
-
Channel
-
Audience Type
-
Budget Allocation
-
Actual Cost
-
Engagement Rate %
-
Campaign Status (Ongoing / Completed)
-
Message Category
With this structure, Pivot Tables can easily generate charts for all five pages.
Additionally, you may use a Support Sheet to:
-
Store KPI definitions
-
Define engagement formulas
-
Maintain audience classifications
-
Create dropdown lists
What KPIs Should You Track in Corporate Communications?
Here are essential KPIs:
-
Budget Utilization %
-
Cost Variance
-
Engagement Rate
-
Campaign Completion Rate
-
Audience Reach
-
Channel Performance Score
-
Departmental Cost Efficiency
-
Communication ROI
For example:
Budget Utilization % = Actual Cost ÷ Budget Allocation × 100
If utilization exceeds 100%, spending surpasses allocation.
Advantages of Corporate Communications Dashboard in Excel
Now let us explore the key benefits.
1. Real-Time Performance Tracking
Because Excel updates instantly, managers can filter data anytime. Therefore, decision-making becomes faster.
2. Budget Control
You compare allocated vs actual cost quickly. As a result, finance teams reduce overspending.
3. Better Engagement Monitoring
Since engagement rate updates dynamically, teams identify high-performing channels immediately.
4. Department Accountability
Each department sees its own performance. Consequently, accountability increases.
5. Easy Customization
Excel allows you to modify charts, add KPIs, and expand categories easily.
6. Cost-Effective Solution
Unlike expensive BI tools, Excel requires no additional software cost.
Best Practices for the Corporate Communications Dashboard
To maximize value, follow these best practices.
1. Maintain Clean Data
Always remove duplicates. Keep consistent naming. Avoid blank cells.
2. Update Data Monthly
Enter new campaign data regularly. Therefore, trends remain accurate.
3. Use Slicers Wisely
Do not overload filters. Keep slicers clear and meaningful.
4. Monitor Cost Variance
Review cost variance every month. If variance exceeds 10%, investigate.
5. Track Engagement by Channel
Always compare engagement across channels before reallocating budget.
6. Review Trends Quarterly
Quarterly reviews help identify seasonal patterns.
How Can You Build This Dashboard in Excel?
Follow these steps:
-
Create a structured Data Sheet.
-
Convert data into Excel Table.
-
Insert Pivot Tables.
-
Create Pivot Charts.
-
Add slicers for Month and Department.
-
Design KPI Cards using formulas.
-
Create navigation buttons.
-
Organize charts into 5 separate pages.
Because Excel supports interactive features, you can create a professional dashboard without coding.
How Does This Dashboard Improve Decision-Making?
When leaders see data visually:
-
They act faster.
-
They allocate budget smartly.
-
They eliminate ineffective campaigns.
-
They increase engagement strategically.
For example:
If Social Media engagement falls 5% month-over-month, teams adjust content immediately. Therefore, performance improves proactively.
Who Can Use This Corporate Communications Dashboard?
-
Corporate Communication Teams
-
Marketing Departments
-
HR Communication Teams
-
Public Relations Managers
-
Corporate Affairs Teams
-
Leadership Teams
Small businesses and large enterprises both benefit from this dashboard.
Conclusion: Why Should You Implement a Corporate Communications Dashboard in Excel?
Corporate communication drives reputation and engagement. However, without structured tracking, performance suffers. Therefore, organizations must adopt a centralized monitoring solution.
The Corporate Communications Dashboard in Excel provides:
-
Clear visibility
-
Budget control
-
Engagement insights
-
Department comparison
-
Monthly tracking
Moreover, it offers flexibility and affordability. Consequently, it becomes a powerful tool for modern organizations.
If you want to improve transparency, optimize communication budget, and increase engagement, this dashboard delivers measurable results.
Frequently Asked Questions with Answers
1. What is a Corporate Communications Dashboard in Excel?
It is an interactive Excel-based reporting tool that tracks communication budgets, engagement rates, and campaign performance.
2. Can I customize the dashboard?
Yes. You can add new KPIs, departments, channels, and charts easily.
3. Do I need advanced Excel skills?
No. Basic knowledge of Pivot Tables and charts works perfectly.
4. How often should I update the dashboard?
You should update it monthly. However, weekly updates improve accuracy.
5. Can small businesses use this dashboard?
Yes. Small businesses benefit because Excel requires no extra software cost.
6. What is the most important KPI in corporate communication?
Engagement Rate remains critical because it measures audience response.
7. Does the dashboard support multiple departments?
Yes. You can track unlimited departments using structured data.
Visit our YouTube channel to learn step-by-step video tutorials