Organizing corporate events requires attention to detail, efficient resource management, and accurate reporting. Whether you are arranging conferences, seminars, trade shows, or team-building activities, every event involves planning, budgeting, attendance tracking, and post-event analysis. Managing all these aspects manually can be stressful and error-prone. This is where a Corporate Event Planning Report in Excel becomes a valuable tool.
This ready-to-use Excel-based report template helps businesses streamline event planning, track performance, analyze attendance, and measure cost efficiency. In this article, we will explore the structure of the template, its features, benefits, best practices, and frequently asked questions.
Click to Purchases Corporate Event Planning Report in Excel
What is a Corporate Event Planning Report in Excel?
A Corporate Event Planning Report in Excel is a structured reporting system designed to help businesses and event managers manage event-related data in one place. It includes interactive dashboards, slicers, charts, and tables that allow users to analyze event outcomes effectively.
Instead of juggling multiple spreadsheets or relying on manual calculations, this template provides a centralized platform to:
-
Track expected vs. actual attendees.
-
Measure event costs and cost per attendee.
-
Collect and analyze attendee feedback.
-
Compare organizer and venue performance.
-
Review monthly attendance trends.
The result is better decision-making, optimized resources, and improved event quality.
Key Features of the Corporate Event Planning Report
The Corporate Event Planning Report in Excel includes multiple pages, each serving a specific purpose. Here’s a breakdown:
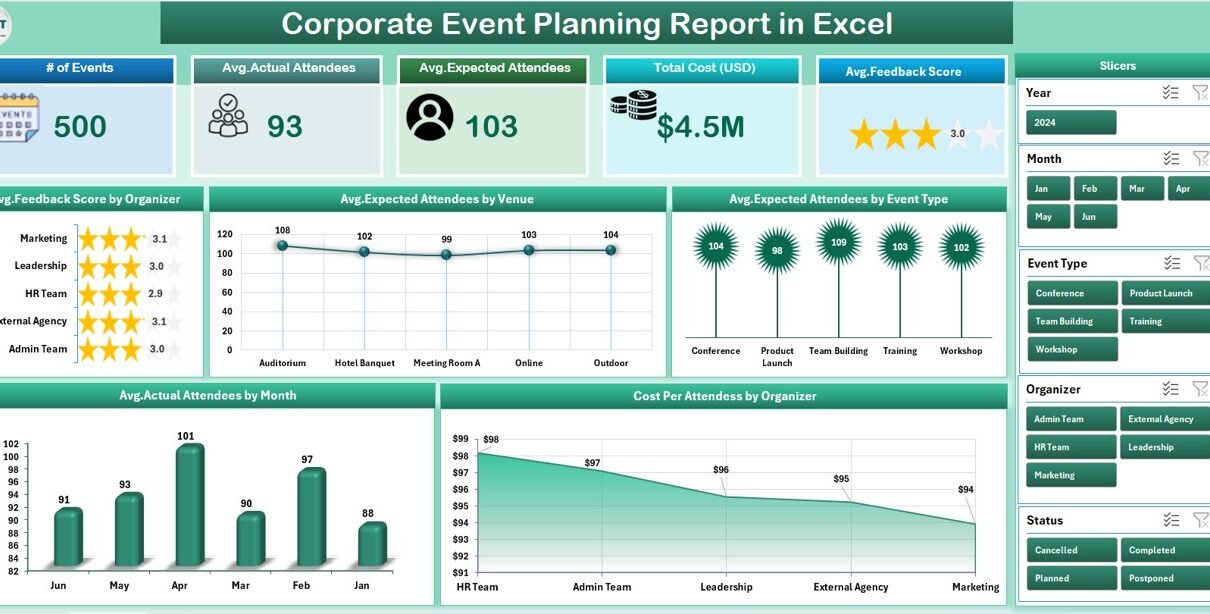
Summary Page
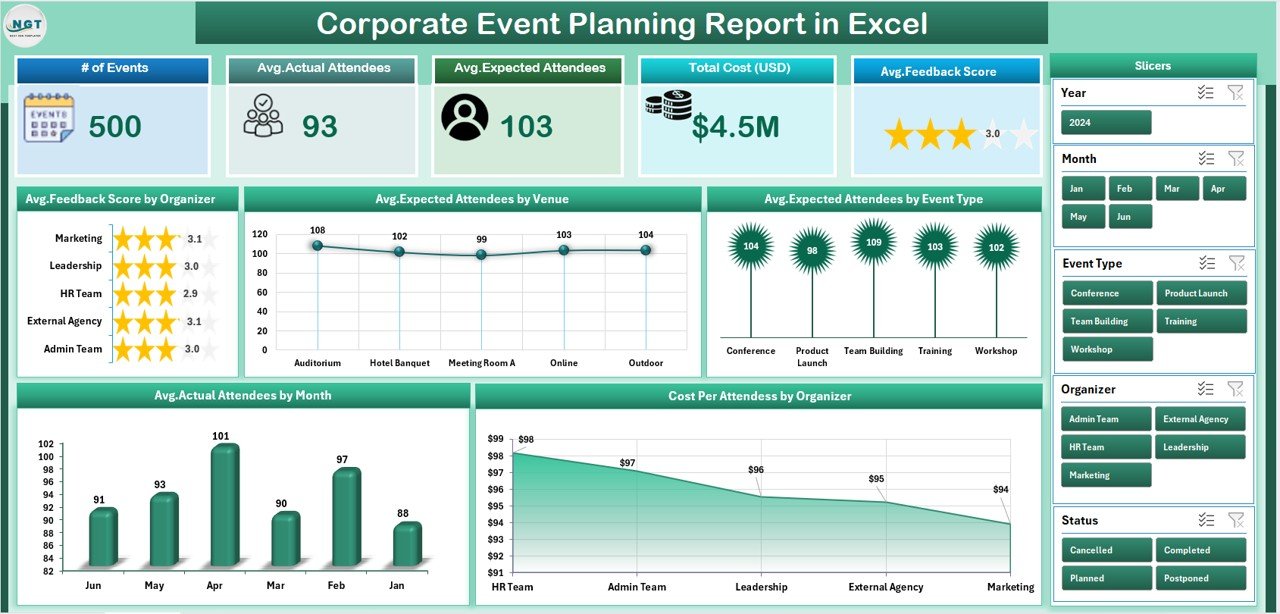
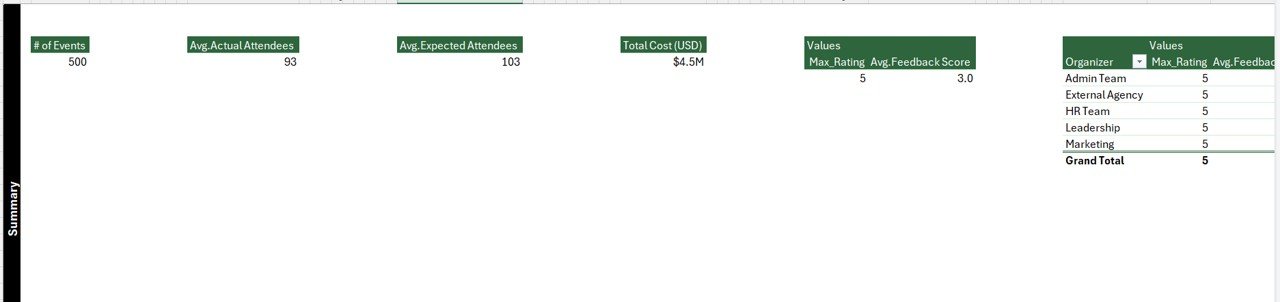
This is the main dashboard of the report. It provides an at-a-glance view of key performance indicators (KPIs).
-
Cards at the Top: Display quick stats like total events, overall cost, average attendance, feedback score, and organizers involved.
-
Right-Side Slicer: Helps users filter results by organizer, event type, venue, or month.
Charts Included:
- Average Feedback Score by Organizer.
- Average Expected Attendees by Venue.
- Average Attendance by Event Type.
- Monthly Trends of Actual Attendance.
- Cost per Attendee by Organizer.
This section gives management an instant snapshot of how events are performing.
Report Page
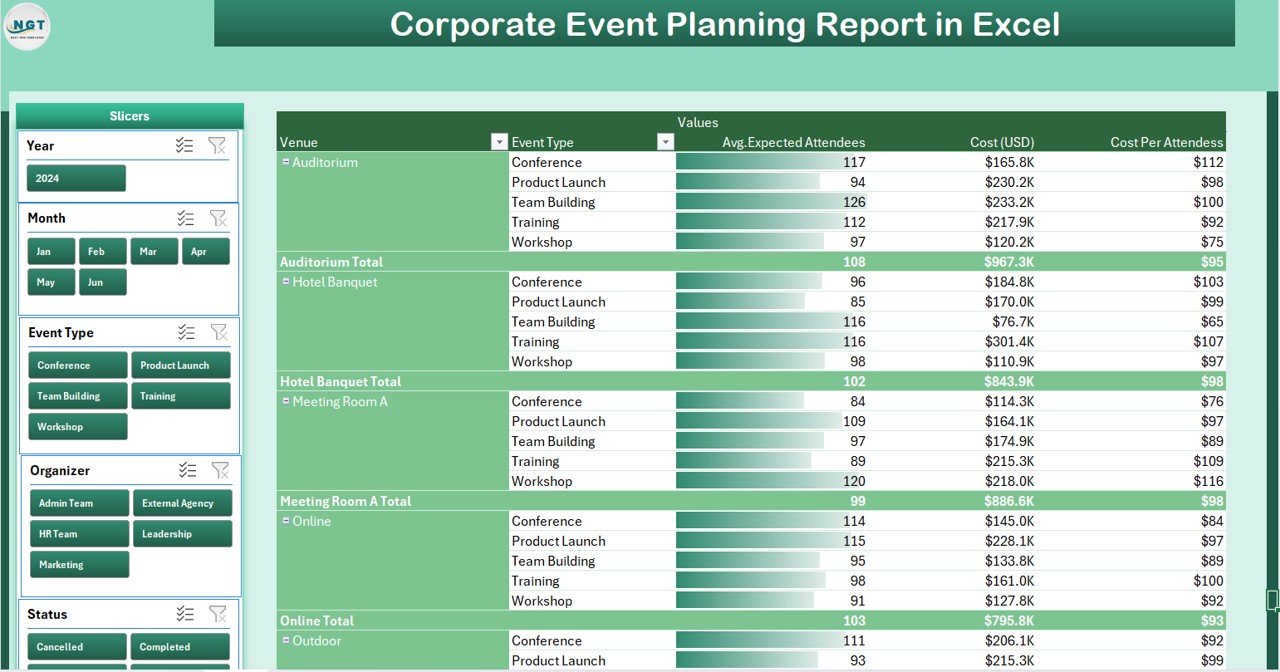
The report page provides detailed information in tabular form.
-
Left-Side Slicer: Allows quick filtering of records.
-
Information Table: Displays granular details about each event, including date, type, venue, organizer, cost, expected attendees, actual attendees, and feedback score.
This page ensures managers have access to detailed event data for review or presentation purposes.
Data Sheet
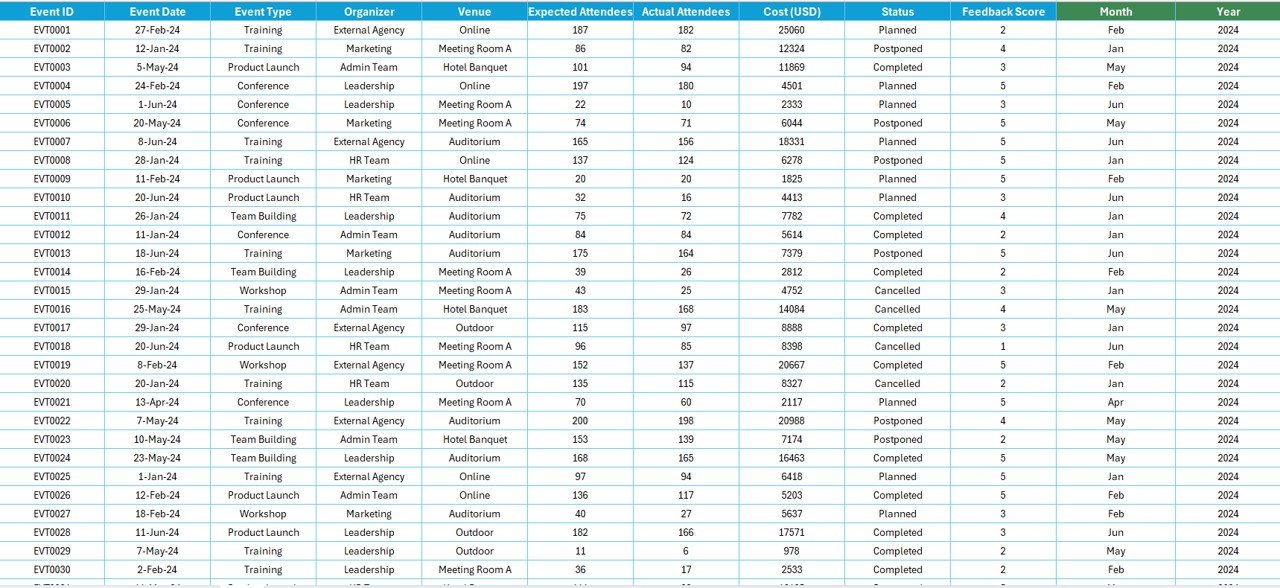
The Data Sheet acts as the backbone of the report.
-
Stores all event-related entries, such as event type, date, venue, organizer, costs, expected numbers, actual attendance, and feedback.
-
Data is structured in rows and columns for easy pivot table and chart integration.
-
Users can add, update, or delete records to keep the report updated.
Support Sheet
The support sheet contains lists for dropdowns and data validation.
-
Stores unique lists of organizers, venues, event types, and feedback categories.
-
Improves data accuracy and consistency by avoiding manual typing errors.
-
Ensures smooth filtering across slicers and charts.
Why Should Businesses Use a Corporate Event Planning Report in Excel?
Managing corporate events requires tracking multiple metrics simultaneously. A ready-to-use Excel report helps in many ways:
-
Centralized Data Management – All event data stored in one template.
-
Time Efficiency – Automated calculations and charts reduce reporting time.
-
Better Decision-Making – Management can analyze attendance, costs, and satisfaction at a glance.
-
Cost Monitoring – Tracks event expenses and calculates cost per attendee.
-
Performance Tracking – Evaluates organizer and venue effectiveness.
-
User-Friendly Interface – Interactive slicers and dashboards make navigation simple.
Click to Purchases Corporate Event Planning Report in Excel
Advantages of Corporate Event Planning Report in Excel
Using this template brings multiple advantages to corporate teams and event managers:
📊 Comprehensive Analysis – Get detailed insights into attendance, feedback, and cost efficiency.
⏱️ Saves Time – Automates reporting that otherwise requires hours of manual work.
💰 Cost Control – Identifies expensive events and helps optimize budgets.
🎯 Improved Accuracy – Reduces manual entry errors with data validation and structured sheets.
🌍 Scalable – Can handle small meetings or large conferences with ease.
📈 Data-Driven Decisions – Helps businesses focus on improving future events.
Opportunities for Improvement in Corporate Event Planning
Even with an efficient Excel-based report, organizations can make further improvements in event planning:
🔄 Integrating Real-Time Data – Connect the report with live feedback collection tools.
📱 Mobile-Friendly Versions – Allow event managers to access reports on the go.
🔗 Integration with CRM or ERP – Combine event data with marketing and sales platforms for better ROI tracking.
🤝 Collaborative Access – Share the report across teams using cloud storage solutions like OneDrive or Google Drive.
📌 Automation – Use macros or Power Query to reduce manual data entry.
Best Practices for Using the Corporate Event Planning Report
To get the maximum benefit from this template, follow these best practices:
-
Keep Data Updated – Enter actual attendance and feedback immediately after each event.
-
Use Consistent Naming Conventions – Ensure uniformity in organizer, venue, and event type names.
-
Leverage Filters and Slicers – Always apply filters before analyzing results to avoid misleading conclusions.
-
Review Trends Monthly – Use monthly charts to evaluate long-term patterns in attendance and cost.
-
Conduct Post-Event Reviews – Use the report to present findings to stakeholders and suggest improvements.
-
Backup Data Regularly – Keep a copy of the data sheet to avoid accidental loss.
How to Create a Corporate Event Planning Report in Excel?
You can create this type of report in Excel by following these steps:
-
Prepare Data Sheet – Collect event-related data like date, type, organizer, venue, costs, expected attendees, and feedback.
-
Create Pivot Tables – Build pivot tables for attendance, cost per attendee, and feedback scores.
-
Design Charts – Insert charts like bar graphs, line charts, and pie charts to visualize performance.
-
Add Summary Dashboard – Combine KPIs, cards, and slicers for quick insights.
-
Use Conditional Formatting – Highlight high and low performers for easy tracking.
-
Set Up Support Sheet – Maintain dropdown lists for consistency.
This ensures the report is structured, interactive, and easy to navigate.
Who Can Benefit from a Corporate Event Planning Report?
This template is not limited to event managers. Multiple roles in an organization can benefit from it:
-
Event Planners – For managing event logistics.
-
HR Teams – For planning internal employee events and training sessions.
-
Marketing Departments – For managing promotional events and client meetings.
-
Finance Teams – For tracking event-related costs.
-
Senior Management – For reviewing performance and making budget decisions.
Conclusion
The Corporate Event Planning Report in Excel is a powerful tool that simplifies how businesses manage and analyze events. It centralizes data, provides interactive dashboards, and highlights key metrics like attendance, costs, and feedback. With this ready-to-use template, organizations can save time, reduce errors, and improve decision-making.
By following best practices, integrating with other tools, and keeping the report updated, businesses can maximize the effectiveness of their event planning process.
Frequently Asked Questions (FAQs)
1. What is the main purpose of a Corporate Event Planning Report in Excel?
The report helps businesses track attendance, costs, feedback, and overall performance of corporate events in one place.
2. Can I customize the report for my company’s specific needs?
Yes, you can modify the data sheet, add KPIs, or create new charts as per your organization’s requirements.
3. How does this report save time for event managers?
The built-in formulas, pivot tables, and dashboards automate calculations and analysis, reducing manual effort.
4. Do I need advanced Excel skills to use this report?
No, the template is beginner-friendly. However, knowledge of pivot tables and charts helps in customization.
5. Can this template track multiple events across different years?
Yes, by adding year fields in the data sheet and using slicers, you can track performance across years.
6. Is this report suitable for small businesses?
Absolutely. Small businesses can use it to manage limited events without needing expensive event management software.
7. Can I share this report with my team?
Yes, you can share the Excel file via email, cloud storage, or collaboration platforms like OneDrive and Google Drive.
8. How do I measure event success using this report?
Event success can be measured using KPIs like actual attendance, cost per attendee, and feedback scores available in the dashboard.
Visit our YouTube channel to learn step-by-step video tutorials


