In today’s business landscape, Corporate Social Responsibility (CSR) is no longer optional—it’s a necessity. Companies worldwide are expected to contribute positively to society, reduce their environmental impact, and operate transparently. However, managing CSR activities without data-driven tools can lead to inefficiencies and missed opportunities. This is where a Corporate Social Responsibility Dashboard in Power BI proves its value.
This powerful dashboard transforms complex CSR data into visual insights. Whether you’re tracking budgets, program impact, or location-specific results, this tool helps you stay on top of your corporate goals and community obligations.
What is a Corporate Social Responsibility Dashboard in Power BI?
A Corporate Social Responsibility Dashboard in Power BI is a dynamic, interactive reporting tool that captures, analyzes, and visualizes CSR activities. By pulling data from Excel or other sources into Power BI, organizations can monitor CSR performance in real-time. It offers insights into:
-
Budget vs. actual spend
-
Beneficiary reach
-
Departmental contributions
-
Program impact
-
Efficiency metrics
All this information is presented in a user-friendly, visual format using slicers, charts, and performance cards.
Why Do You Need a CSR Dashboard?
Managing CSR without data insights is like driving blindfolded. Here’s why businesses should use a CSR dashboard:
✅ Track spending and budget allocations
✅ Measure program outcomes and reach
✅ Increase transparency for stakeholders
✅ Improve decision-making with real-time data
✅ Identify bottlenecks or low-performing programs
Click to Purchases Corporate Social Responsibility Dashboard in Power BI
📊 Key Features of the CSR Dashboard in Power BI
This ready-to-use Power BI dashboard includes five core pages, each designed to simplify CSR monitoring and reporting.
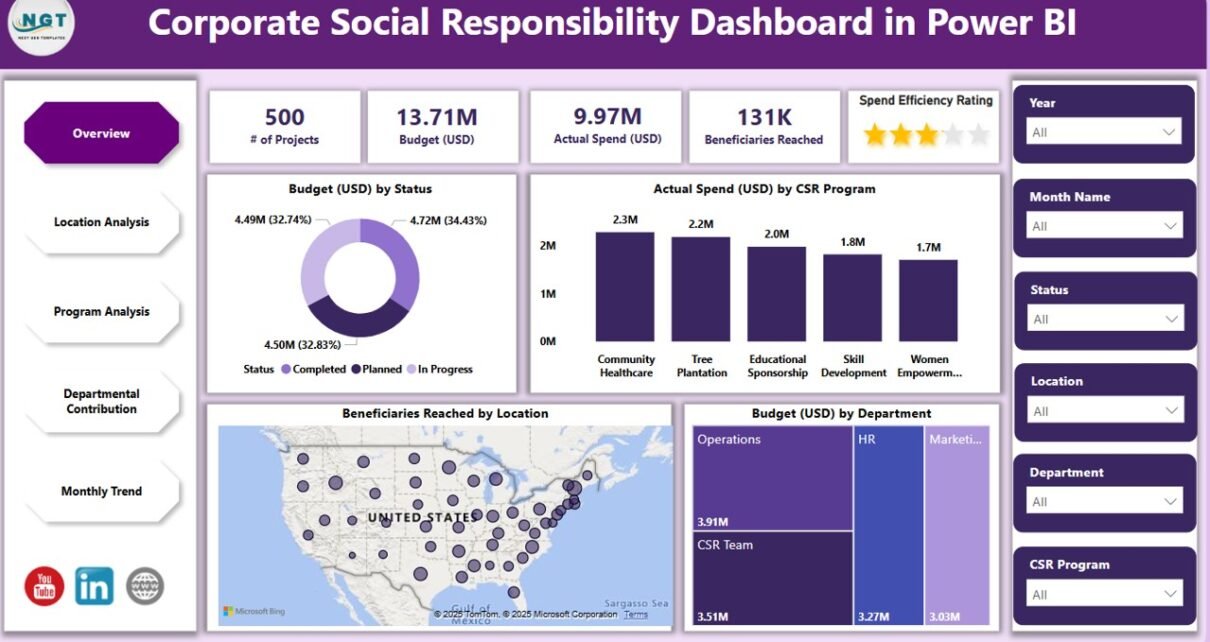
Overview Page: Your CSR Snapshot
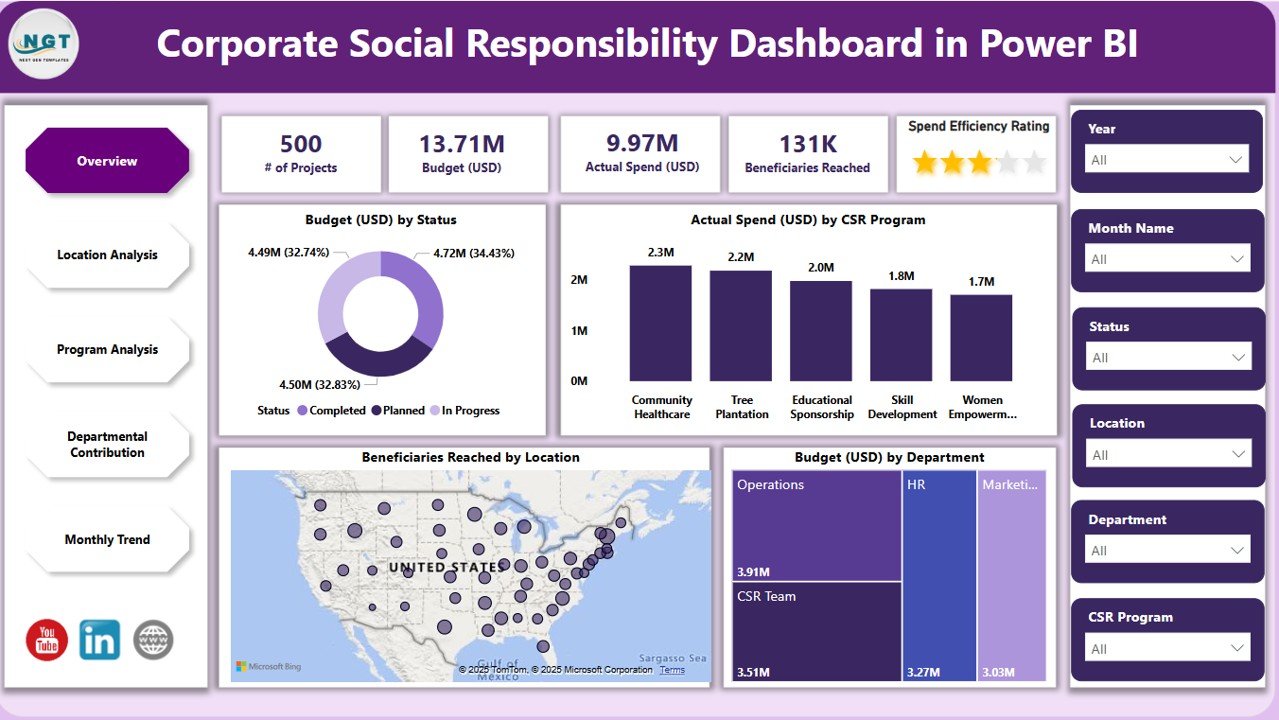
This is the central hub of the dashboard. It provides a quick glance at all major CSR performance metrics using:
-
6 slicers (filters for data exploration)
-
5 summary cards to show key numbers
4 insightful charts, including:
- Budget (USD) by Status
- Actual Spend (USD) by CSR Program
- Beneficiaries Reached by Location
- Budget (USD) by Department
This page answers high-level questions like:
-
Are we on track with our CSR budget?
-
Which programs and departments are the most resource-intensive?
-
Where are we making the most impact?
Location Analysis Page: Know Where You Make a Difference
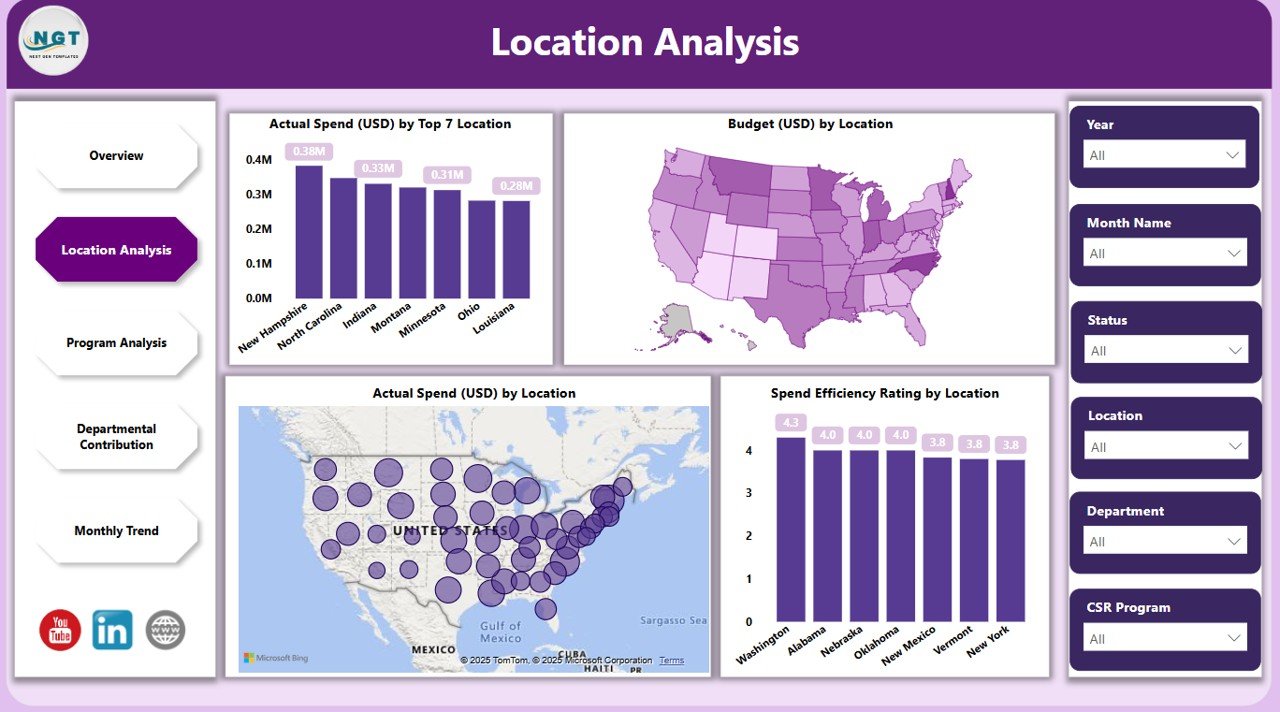
Location matters in CSR—because different regions have different needs. This page includes:
-
6 slicers for filtering
4 visual charts, such as:
- Actual Spend (USD) by Top 7 Locations
- Budget (USD) by Location
- Actual Spend (USD) by Location
- Spend Efficiency Rating by Location
You can quickly see:
-
Which locations receive the most funds
-
Where spending is the most efficient
-
How many beneficiaries have been reached per location
Program Analysis Page: Compare Program Performance
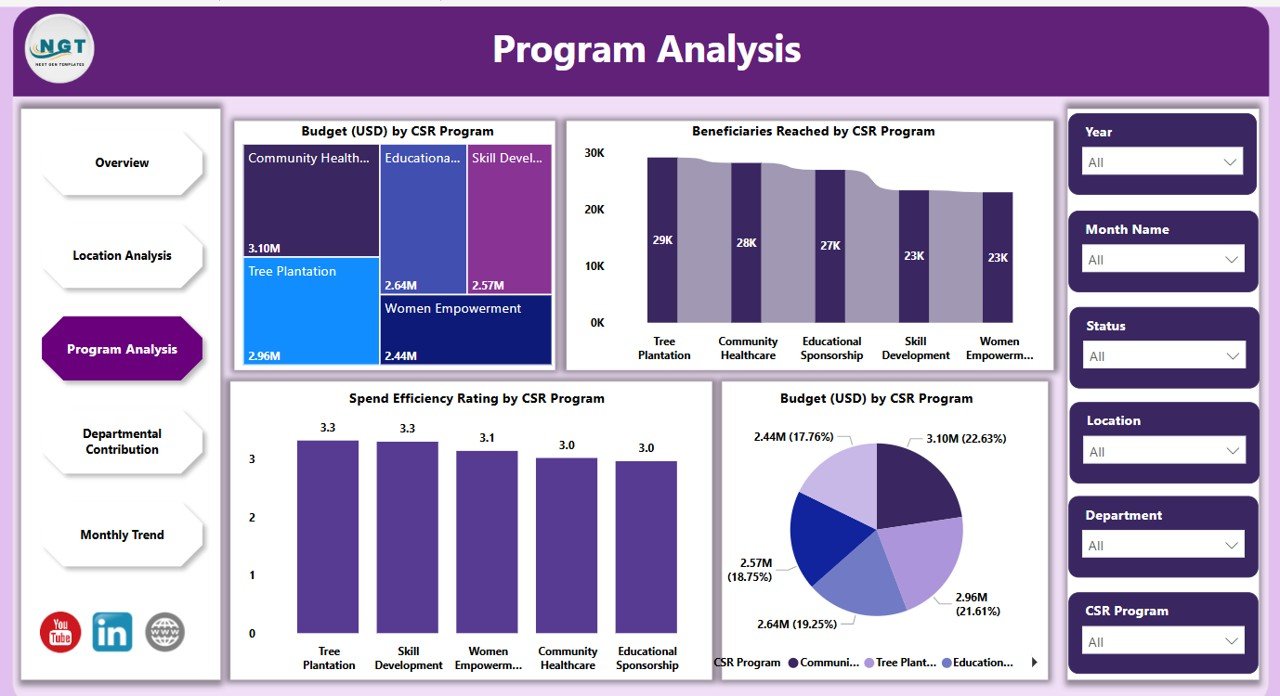
Every CSR program serves a different purpose. This page helps you evaluate their performance. It features:
-
6 slicers to analyze across dimensions
4 core charts:
- Budget (USD) by Program
- Beneficiaries Reached by CSR Program
- Spend Efficiency Rating by Program
- Actual Spend (USD) by CSR Program
This section answers:
-
Which programs deliver the highest impact?
-
Are we over or under-spending on certain initiatives?
-
Which programs have the best return on investment?
Departmental Contribution Page: Who’s Driving the Change?
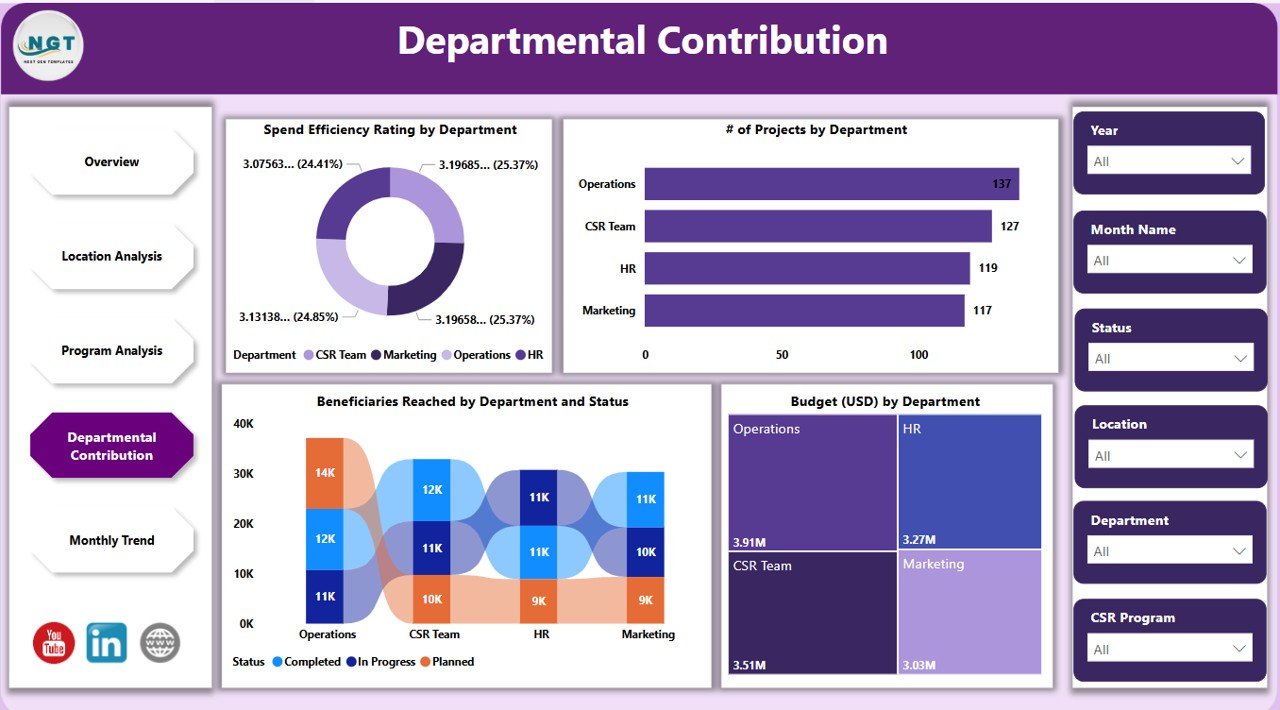
CSR is a collective effort across departments. This page highlights:
-
6 slicers
4 department-level insights:
- Spend Efficiency Rating by Department
- Number of Projects by Department
- Beneficiaries Reached by Department
- Status and Budget (USD) by Department
Click to Purchases Corporate Social Responsibility Dashboard in Power BI
Key insights include:
-
Which departments are leading CSR initiatives?
-
Are departments staying within budget?
-
How many projects each department manages
Monthly Trend Page: Monitor Progress Over Time
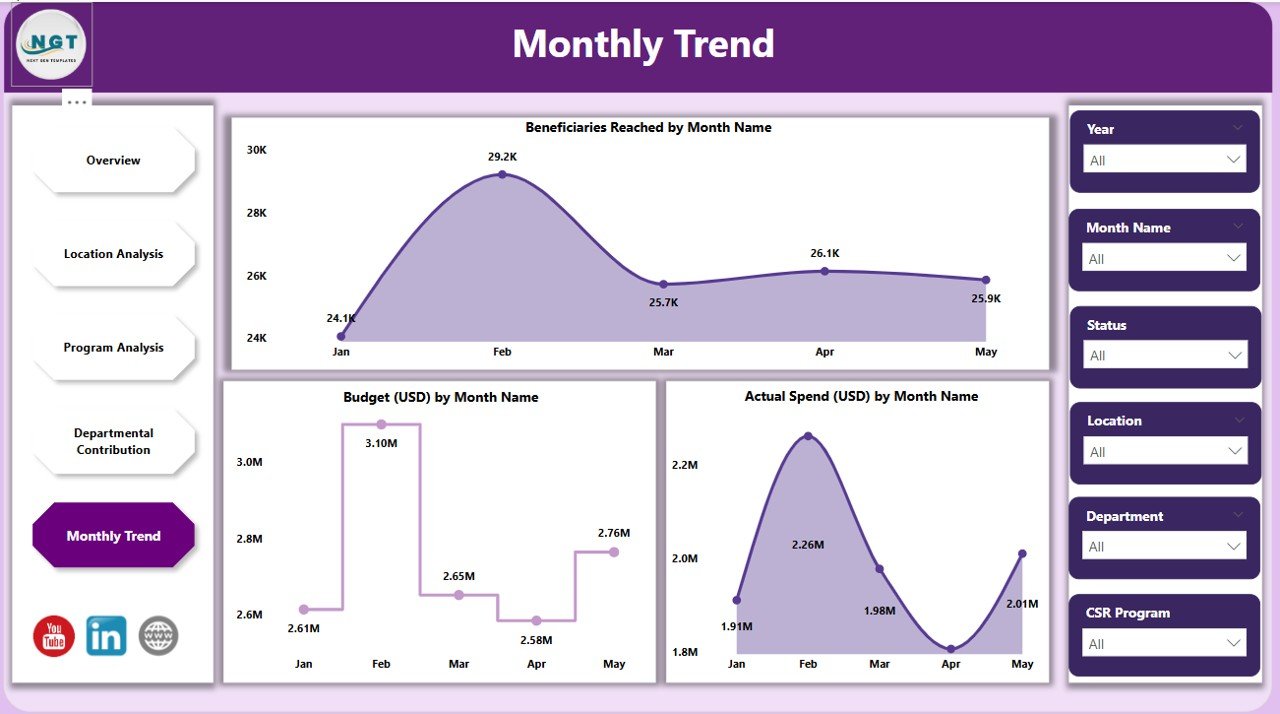
CSR doesn’t happen in a day—it’s an ongoing process. This page shows trends over time using:
-
6 slicers
3 trend-focused charts:
- Beneficiaries Reached by Month
- Budget (USD) by Month
- Actual Spend (USD) by Month
This view helps with:
-
Monthly performance tracking
-
Seasonal budgeting
-
Forecasting future initiatives
Advantages of Using a CSR Dashboard
Here’s how the Corporate Social Responsibility Dashboard in Power BI empowers your organization:
1. Real-Time Visibility
See your CSR data live—know what’s happening right now, not last quarter.
2. Improved Accountability
Track spending, results, and responsible departments. No more finger-pointing.
3. Better Decision-Making
Make quick, data-backed choices about what to fund, where to cut costs, or which programs to scale.
4. Transparency for Stakeholders
Easily share dashboard insights with internal teams, executives, and even the public.
5. Efficiency Tracking
Use spend efficiency metrics to ensure every dollar delivers maximum value.
Best Practices for Using a CSR Dashboard in Power BI
Click to Purchases Corporate Social Responsibility Dashboard in Power BI
To get the most out of your CSR Dashboard, follow these expert tips:
1. Maintain Clean Source Data
Start with well-structured Excel files. Use consistent naming and formatting for better visuals.
2. Use Slicers Effectively
Apply slicers for year, region, or department. This allows targeted analysis in seconds.
3. Update Data Regularly
Keep the data source updated to reflect real-time performance.
4. Set Benchmarks
Add target lines or KPIs for easy comparison between actual and expected performance.
5. Train Team Members
Ensure users know how to interact with the dashboard. Conduct regular workshops or sessions.
6. Incorporate Feedback
Let users suggest improvements to dashboard layout or metrics.
How Does Power BI Enhance CSR Reporting?
Power BI provides a scalable and interactive platform that transforms raw CSR data into actionable insights. With features like:
-
Drag-and-drop visualizations
-
Natural language queries (Q&A)
-
Real-time dashboard refresh
-
Customizable visuals
Power BI makes CSR data more engaging and informative. CSR managers no longer need to rely on spreadsheets alone.
How Can CSR Teams Use This Dashboard?
CSR teams can use the dashboard in multiple ways:
-
Executives can view overall progress and funding efficiency
-
Department Heads can track their own contributions and outcomes
-
Field Managers can analyze beneficiary outreach by region
-
Finance Teams can monitor budget usage and variances
-
PR Teams can use it to showcase CSR performance in reports
Conclusion
CSR is not just a corporate obligation—it’s an opportunity to build trust, improve lives, and make a lasting impact. However, to manage CSR successfully, you need the right tools. The Corporate Social Responsibility Dashboard in Power BI brings clarity, insight, and control to your CSR efforts.
With five dynamic pages—Overview, Location Analysis, Program Analysis, Departmental Contribution, and Monthly Trend—you gain a complete picture of your CSR activities. From budget tracking to program impact, it covers it all.
Don’t just track CSR—optimize it, analyze it, and improve it with Power BI.
❓ Frequently Asked Questions (FAQs)
Click to Purchases Corporate Social Responsibility Dashboard in Power BI
Q1: What data source is used in the CSR Dashboard?
Answer: This dashboard connects to an Excel file that contains structured data about CSR activities, budgets, departments, programs, and more.
Q2: Can I customize this dashboard?
Answer: Yes, the dashboard is fully customizable in Power BI. You can change visuals, add KPIs, or connect to a new data source.
Q3: Who should use this dashboard?
Answer: CSR managers, finance teams, PR professionals, department heads, and senior executives can all benefit from this dashboard.
Q4: How often should I update the data?
Answer: Ideally, update it monthly or after major CSR campaigns or activities for the most accurate insights.
Q5: Is technical knowledge required to use this dashboard?
Answer: Basic Power BI navigation skills are enough. The dashboard is built to be user-friendly and intuitive.
Q6: Can this dashboard support multiple years of data?
Answer: Absolutely! With filters and slicers, you can view performance year-wise, month-wise, or even by specific time frames.
Visit our YouTube channel to learn step-by-step video tutorials
Click to Purchases Corporate Social Responsibility Dashboard in Power BI