Credit card companies operate in a highly competitive and data-driven environment. Every day, organizations process thousands of transactions, monitor customer behavior, manage approval rates, analyze fraud risks, and track revenue streams. Therefore, decision-makers must access clear and accurate insights quickly.
However, many financial teams still depend on scattered spreadsheets and manual reporting. As a result, analyzing performance becomes slow and complex. Managers often struggle to understand customer satisfaction, approval trends, and transaction performance in real time.
Because of these challenges, companies increasingly adopt intelligent dashboards. A Credit Card Companies Dashboard in Excel helps organizations transform raw transaction data into meaningful visual insights. Moreover, it allows managers to monitor performance, identify trends, and make faster decisions.
Click to Purchases Credit Card Companies Dashboard in Excel
In this comprehensive guide, you will learn everything about the Credit Card Companies Dashboard in Excel, including its structure, features, advantages, best practices, and real-world benefits.
What Is a Credit Card Companies Dashboard in Excel?
A Credit Card Companies Dashboard in Excel is an interactive analytical tool designed to track credit card operations using charts, KPIs, and dynamic filters.
Instead of reviewing multiple reports, users can analyze all important metrics from a single dashboard interface. Consequently, finance teams save time while improving decision accuracy.
The dashboard typically tracks:
-
Transaction volume
-
Approval rates
-
Customer satisfaction scores
-
Revenue streams
-
Customer segments
-
Regional performance
-
Monthly trends
Because Excel supports pivot tables, slicers, and automation, organizations can create powerful dashboards without expensive software.
Why Should Credit Card Companies Use Excel Dashboards?
Organizations require fast and reliable insights. Although enterprise BI tools exist, Excel remains one of the most accessible solutions.
Key Reasons Include:
-
Easy implementation without technical expertise
-
Cost-effective analytics solution
-
Real-time performance tracking
-
Interactive filtering using slicers
-
Flexible customization options
Furthermore, Excel dashboards allow teams to share insights easily across departments.
Click to Purchases Credit Card Companies Dashboard in Excel
Key Features of the Credit Card Companies Dashboard in Excel
This ready-to-use dashboard includes structured navigation and multiple analytical pages that provide deep operational insights.
Page Navigator
The dashboard contains a Page Navigator located on the left side. This feature allows users to move quickly between analytical pages. Therefore, users can analyze different business dimensions without confusion.
Dashboard Structure: Five Analytical Pages Explained
The Excel dashboard includes five powerful pages designed to analyze credit card performance from multiple perspectives.
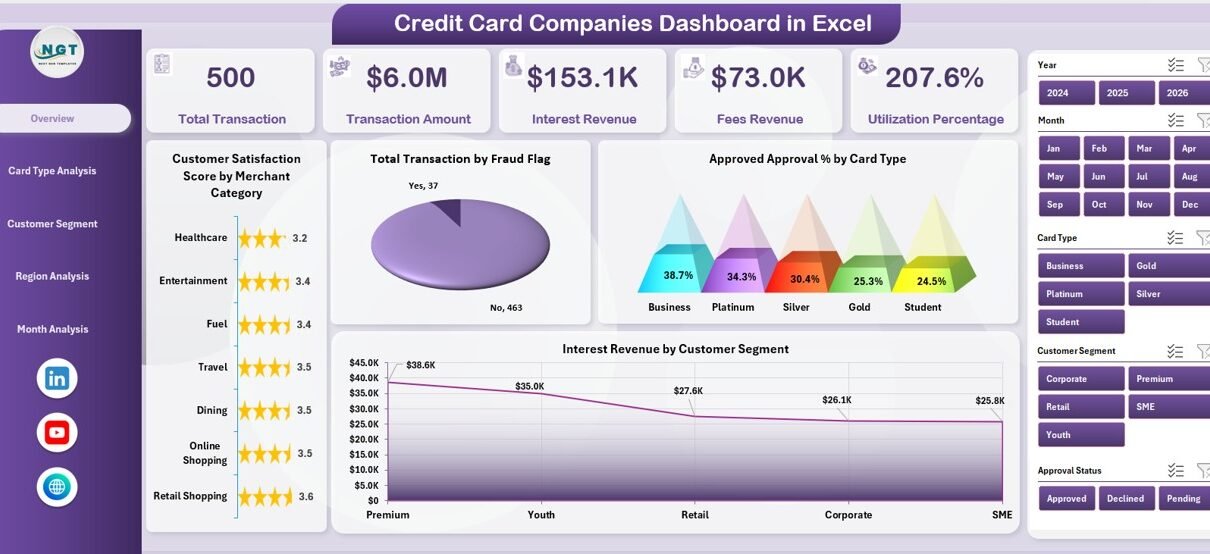
1. Overview Page – What Does the Main Dashboard Show?
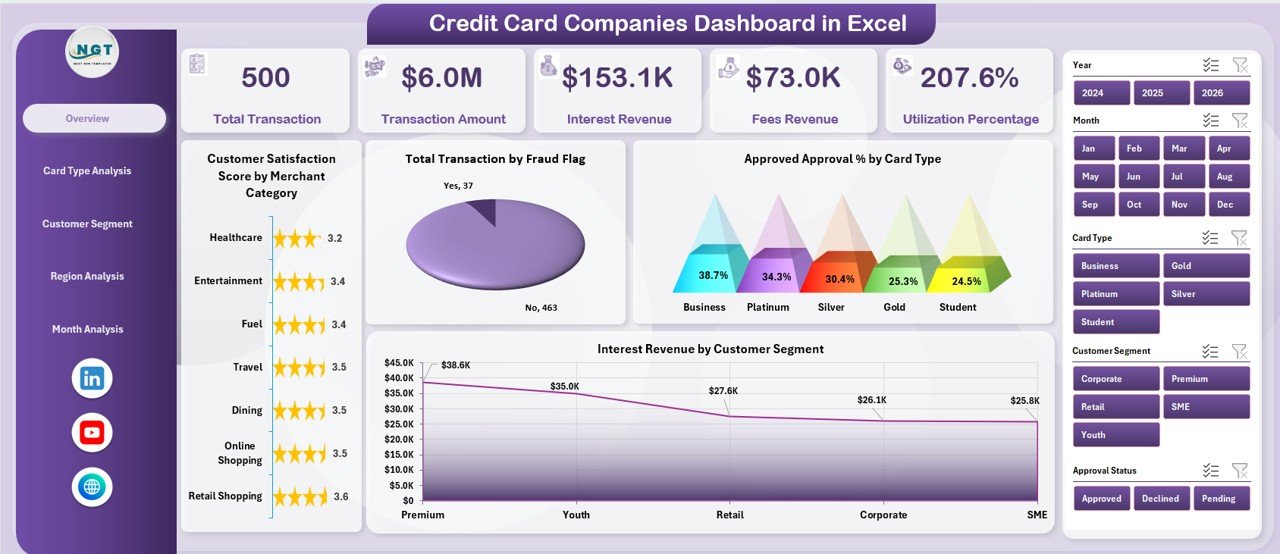
The Overview Page acts as the central performance summary.
Key Elements
-
Right-side slicer for dynamic filtering
-
KPI Cards showing major metrics
-
Interactive charts for performance tracking
KPI Cards Included
-
Customer Satisfaction Insights
-
Transaction Performance Indicators
-
Approval Performance Metrics
-
Revenue Highlights
Charts Available
-
Customer Satisfaction Score by Merchant Category
-
Total Transactions by Fraud Flag
-
Approved Approval % by Card Type
-
Interest Revenue by Customer Segment
Because this page summarizes major KPIs, executives can quickly understand business health.
2. Card Type Analysis – How Do Different Cards Perform?
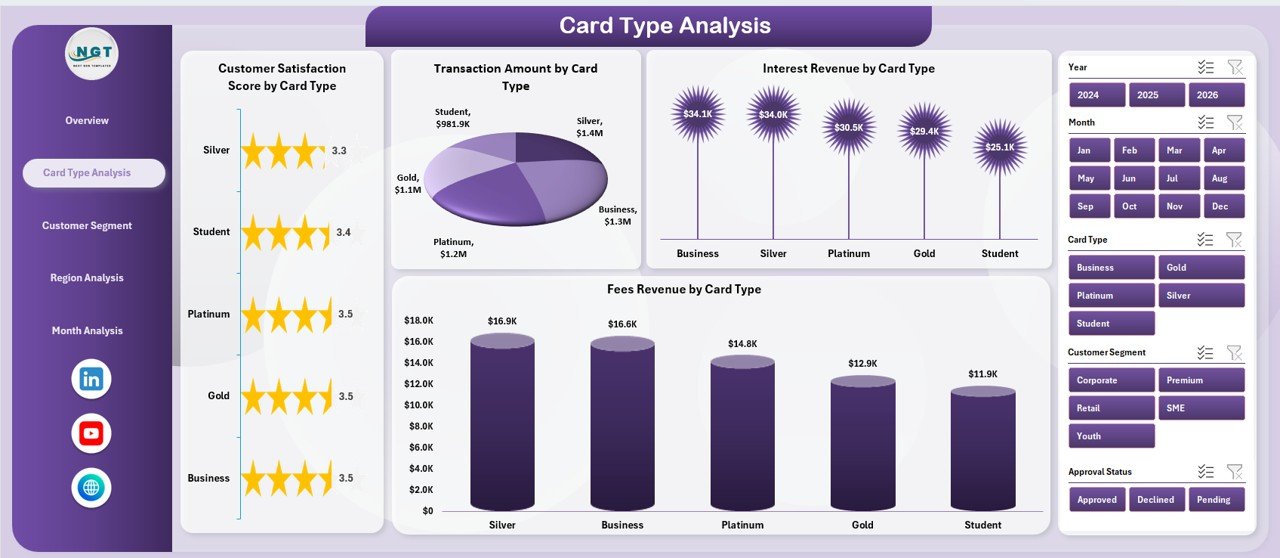
Credit card companies offer multiple card types such as standard, gold, and premium cards. Therefore, analyzing card performance becomes essential.
Charts Included
-
Customer Satisfaction Score by Card Type
-
Transaction Amount by Card Type
-
Interest Revenue by Card Type
-
Fees Revenue by Card Type
This analysis helps organizations identify which card categories generate maximum revenue and customer satisfaction.
Click to Purchases Credit Card Companies Dashboard in Excel
3. Customer Segment Analysis – Which Customers Drive Growth?
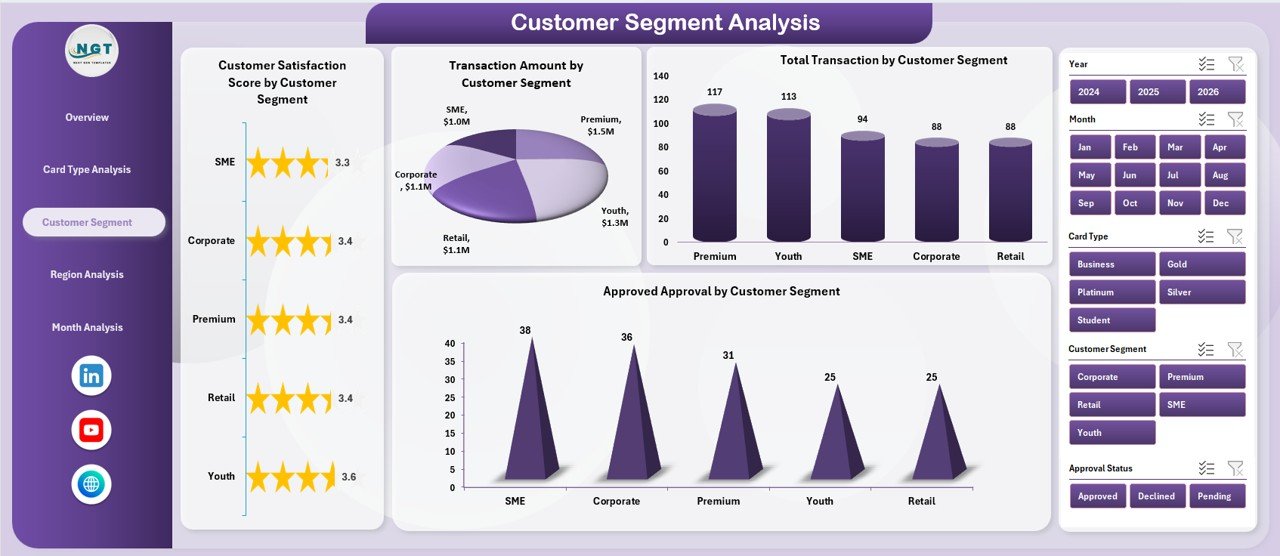
Customer segmentation allows companies to understand behavior patterns. As a result, organizations can create targeted marketing strategies.
Charts Included
-
Customer Satisfaction Score by Customer Segment
-
Transaction Amount by Customer Segment
-
Total Transactions by Customer Segment
-
Approved Approval by Customer Segment
Managers can easily determine which customer groups contribute most to profitability.
4. Region Analysis – Where Does Performance Vary?
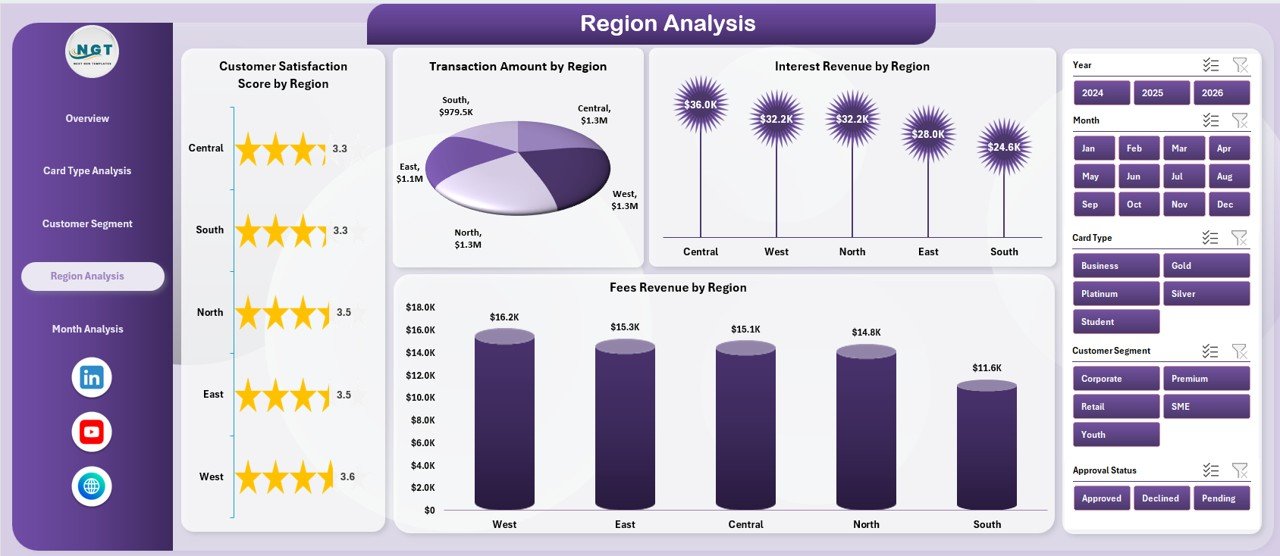
Geographical performance analysis plays a crucial role in financial planning.
Charts Included
-
Customer Satisfaction Score by Region
-
Transaction Amount by Region
-
Interest Revenue by Region
-
Fees Revenue by Region
Because regional trends differ, companies can allocate resources strategically.
5. Month Analysis – How Does Performance Change Over Time?
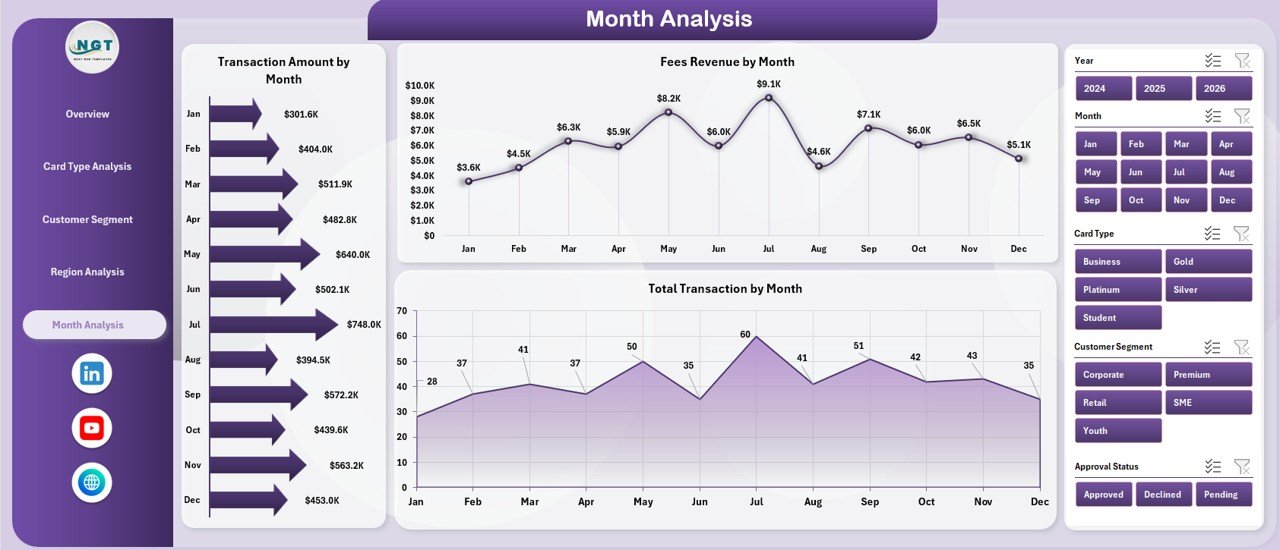
Monthly analysis helps companies identify trends and seasonal patterns.
Charts Included
-
Transaction Amount by Month
-
Total Transactions by Month
-
Fees Revenue by Month
Therefore, decision-makers can forecast revenue and plan promotional campaigns effectively.
Support Sheet and Data Sheet – Why Are They Important?
Behind every dashboard lies structured data.
Data Sheet
The Data Sheet stores raw transactional data such as:
-
Customer segment
-
Card type
-
Region
-
Transaction amount
-
Approval status
-
Revenue details
Support Sheet
Click to Purchases Credit Card Companies Dashboard in Excel
The Support Sheet manages calculations, pivot tables, and intermediate formulas. Consequently, dashboard visuals update automatically when data changes.
How Does the Credit Card Dashboard Improve Decision-Making?
A well-designed dashboard simplifies complex financial operations.
It Helps By:
-
Providing real-time visibility into performance
-
Reducing manual reporting effort
-
Improving strategic planning
-
Enhancing risk monitoring
-
Supporting faster executive decisions
Moreover, teams can quickly identify declining metrics and take corrective actions.
Advantages of Credit Card Companies Dashboard in Excel
Using a structured dashboard delivers several operational benefits.
✅ Centralized Data Monitoring
All important KPIs appear in one place. Therefore, teams avoid switching between multiple reports.
✅ Faster Analysis
Interactive slicers allow instant filtering. As a result, analysis becomes quicker.
✅ Improved Customer Insights
Companies understand customer satisfaction and spending behavior more effectively.
✅ Better Revenue Tracking
Interest and fee revenues remain visible at all times.
✅ Enhanced Operational Efficiency
Automation reduces manual workload significantly.
How Can Businesses Use This Dashboard in Real Life?
Organizations across the financial sector can benefit from this dashboard.
Common Use Cases
-
Credit card issuing banks
-
Financial analytics teams
-
Risk management departments
-
Customer experience teams
-
Revenue monitoring teams
For example, a bank can analyze declining approval rates instantly and adjust credit policies accordingly.
Step-by-Step Workflow of the Dashboard
Understanding workflow helps users maximize dashboard value.
-
Upload transaction data into the Data Sheet.
-
Refresh pivot tables.
-
Apply slicers to filter analysis.
-
Review KPI cards.
-
Analyze charts across pages.
-
Identify trends and take action.
Because the dashboard updates dynamically, users always view the latest insights.
Best Practices for the Credit Card Companies Dashboard in Excel
Following best practices ensures long-term dashboard success.
✔ Maintain Clean Data
Always remove duplicate or incomplete records.
✔ Use Standard Naming Conventions
Consistent field names improve analysis accuracy.
✔ Update Data Regularly
Frequent updates ensure reliable insights.
✔ Limit Manual Edits
Allow formulas and pivot tables to handle calculations.
✔ Use Meaningful Visuals
Charts should communicate insights clearly.
✔ Monitor KPI Definitions
Ensure all metrics follow consistent formulas.
Common Challenges and How to Solve Them
Even powerful dashboards face challenges. However, proper planning solves most issues.
Challenge: Slow Performance
Solution: Reduce unnecessary formulas and optimize pivot tables.
Challenge: Data Errors
Solution: Apply validation rules in the data sheet.
Challenge: Misinterpretation of Metrics
Solution: Add KPI definitions in support sheets.
Tips to Make Your Credit Card Dashboard More Powerful
You can enhance dashboard effectiveness using advanced Excel features.
-
Add conditional formatting indicators
-
Use dynamic charts
-
Include trend comparisons
-
Add year-over-year analysis
-
Create automated refresh buttons
These improvements increase usability and professionalism.
Future of Credit Card Analytics Using Excel
Click to Purchases Credit Card Companies Dashboard in Excel
Financial analytics continues to evolve. However, Excel dashboards remain relevant because they integrate easily with modern tools.
Organizations increasingly combine Excel with:
-
Power BI integration
-
Automated data imports
-
Cloud storage solutions
-
AI-driven analytics
Consequently, Excel dashboards continue to play a vital role in financial reporting.
Conclusion: Why Should You Use a Credit Card Companies Dashboard in Excel?
Credit card companies manage complex operations that require continuous monitoring. Without structured analytics, organizations struggle to track performance effectively.
The Credit Card Companies Dashboard in Excel provides a practical and powerful solution. It centralizes KPIs, simplifies analysis, and improves decision-making. Moreover, its interactive design allows teams to explore data from multiple perspectives.
Because the dashboard combines usability with analytical depth, it becomes an essential tool for financial professionals. Organizations that adopt dashboard-driven reporting gain better visibility, stronger control, and improved profitability.
Frequently Asked Questions (FAQs)
1. What is a Credit Card Companies Dashboard in Excel?
It is an interactive Excel-based analytical tool that tracks transactions, approvals, revenue, and customer performance using charts and KPIs.
2. Who can use this dashboard?
Banks, financial institutions, analysts, and credit card management teams can use it effectively.
3. Does the dashboard update automatically?
Yes. When users update the data sheet and refresh pivot tables, charts update automatically.
4. Can beginners use this dashboard?
Yes. The dashboard uses simple navigation and slicers, so beginners can operate it easily.
5. What data is required to run the dashboard?
You need transaction data, customer segments, card types, approval status, revenue details, and regional information.
6. Why is Excel suitable for financial dashboards?
Excel provides flexibility, automation, and powerful visualization features without requiring expensive software.
7. Can the dashboard be customized?
Yes. Users can modify charts, KPIs, and layouts according to business needs.
Visit our YouTube channel to learn step-by-step video tutorials