Managing a credit union today requires more than traditional reports and static spreadsheets. Credit unions must track member satisfaction, monitor loan performance, manage delinquency risk, analyze branch efficiency, and compare product performance—all in real time. However, when data sits in multiple files, decision-making slows down.
That is exactly where a Credit Unions Dashboard in Excel becomes a powerful solution.
In this detailed guide, you will learn what a Credit Unions Dashboard in Excel is, why it matters, how it works, its key features, advantages, best practices, and frequently asked questions. Moreover, you will understand how this ready-to-use Excel dashboard helps credit unions turn raw data into actionable insights—without complex tools or high costs.
Click to Purchases Credit Unions Dashboard in Excel
What Is a Credit Unions Dashboard in Excel?
A Credit Unions Dashboard in Excel is a centralized, visual reporting tool designed to monitor and analyze key credit union performance metrics in one place. Instead of reviewing multiple reports, credit union leaders can use this dashboard to track KPIs, compare trends, and identify risks instantly.
Most importantly, Excel dashboards remain popular because they are easy to use, cost-effective, and highly customizable.
Why Do Credit Unions Need a Dashboard in Excel?
Credit unions operate in a competitive financial environment. Therefore, they must make faster and smarter decisions. A well-designed Excel dashboard helps credit unions:
-
Track member satisfaction consistently
-
Monitor loan and account balances
-
Analyze interest rates and EMIs
-
Identify delinquency risks early
-
Compare branch, product, city, and monthly performance
As a result, leadership teams gain clarity and confidence in every decision.
How Does a Credit Unions Dashboard in Excel Work?
A Credit Unions Dashboard in Excel works by connecting structured data from a Data Sheet to interactive dashboards using formulas, pivot tables, slicers, and charts.
First, users update the raw data in the data sheet.
Next, the dashboard automatically refreshes all visuals.
Finally, decision-makers review insights using filters and slicers.
Because Excel handles calculations dynamically, users do not need advanced technical skills.
What Are the Key Features of the Credit Unions Dashboard in Excel?
This ready-to-use Credit Unions Dashboard in Excel comes with a clean structure and intuitive navigation. Let us explore each feature in detail.
How Does the Page Navigator Improve Usability?
The Page Navigator, located on the left side, allows users to move seamlessly between analytical pages.
Why Is the Page Navigator Important?
-
It reduces manual scrolling
-
It improves user experience
-
It saves time during reviews and meetings
-
It ensures quick access to insights
As a result, even non-technical users can explore the dashboard confidently.
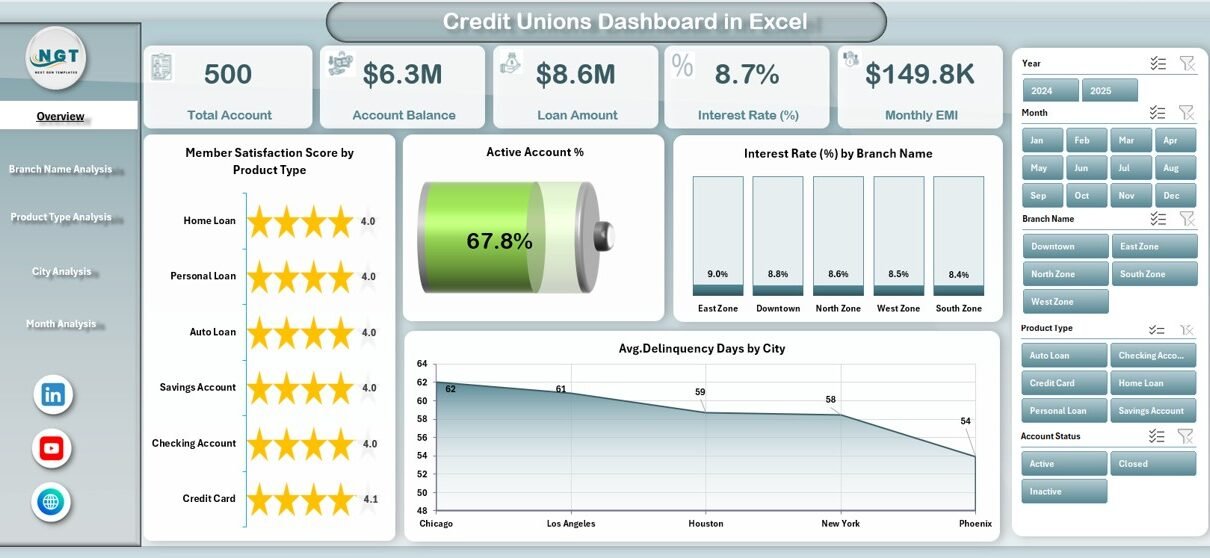
How Does the Overview Page Help Credit Union Leaders?
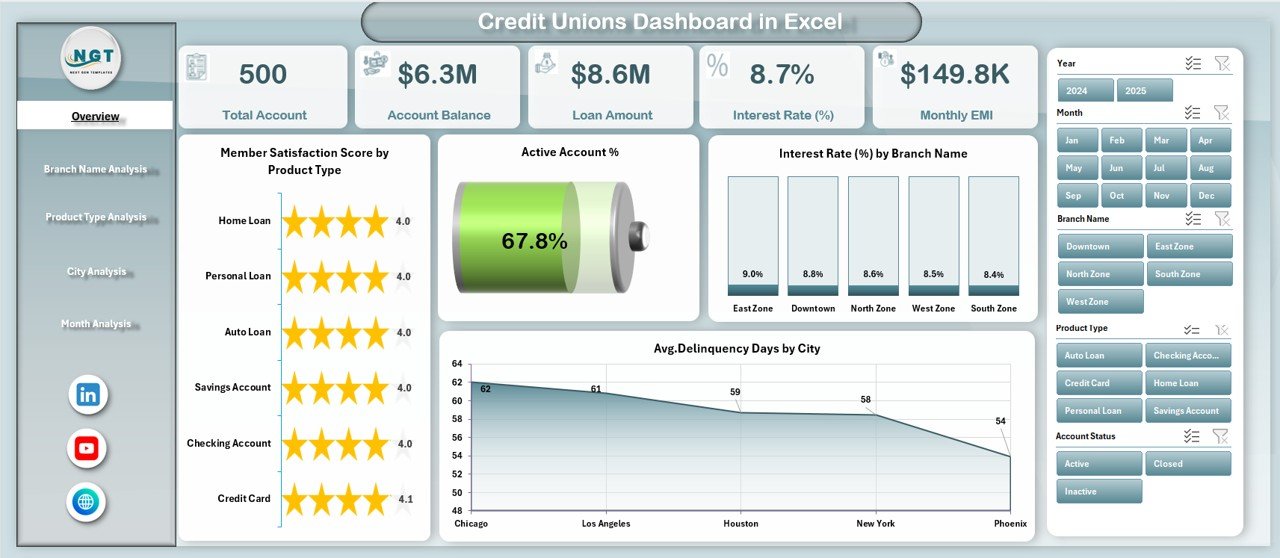
The Overview Page serves as the control center of the dashboard. It provides a high-level snapshot of credit union performance.
Key Elements of the Overview Page
-
Right-side slicer for dynamic filtering
-
4 KPI cards for quick performance checks
-
4 interactive charts for trend analysis
Charts Included on the Overview Page
-
Member Satisfaction Score by Product Type
-
Active Account %
-
Interest Rate % by Branch Name
-
Average Delinquency Days by City
Because this page summarizes key insights, leaders can quickly understand overall performance before diving deeper.
How Does Branch Name Analysis Improve Operational Decisions?
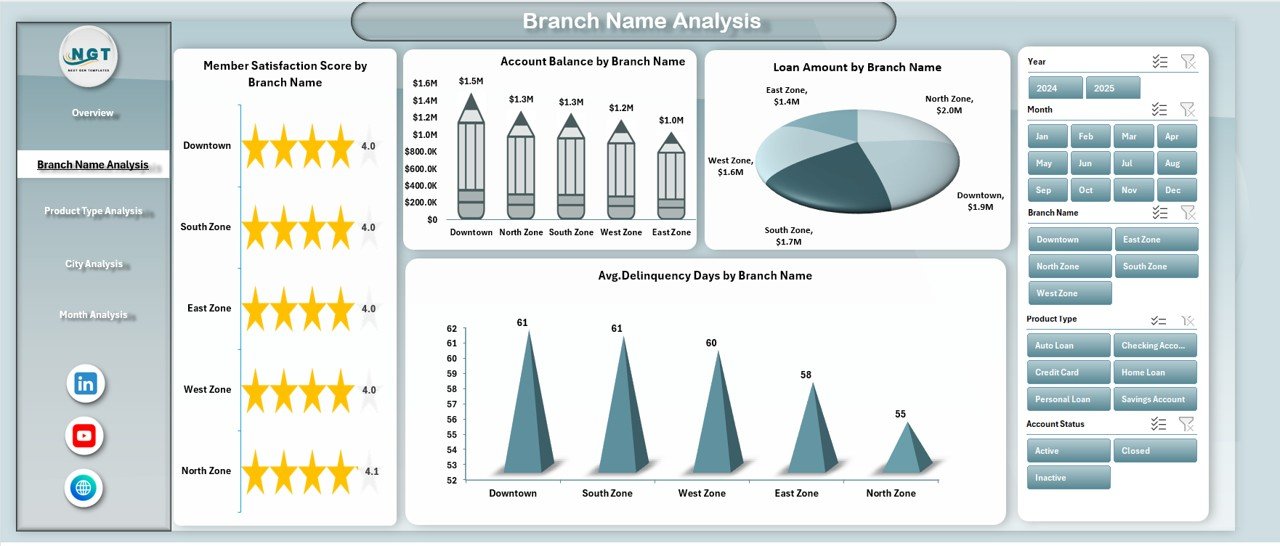
The Branch Name Analysis Page focuses on branch-level performance.
Why Is Branch Analysis Important?
Every branch performs differently. Therefore, credit unions must identify:
-
High-performing branches
-
Branches with delinquency risks
-
Loan concentration issues
-
Member satisfaction gaps
Charts Available on the Branch Name Analysis Page
-
Member Satisfaction Score by Branch Name
-
Account Balance by Branch Name
-
Loan Amount by Branch Name
-
Average Delinquency Days by Branch Name
Because slicers filter data instantly, managers can compare branches side by side and take corrective actions quickly.
How Does Product Type Analysis Help Optimize Financial Products?
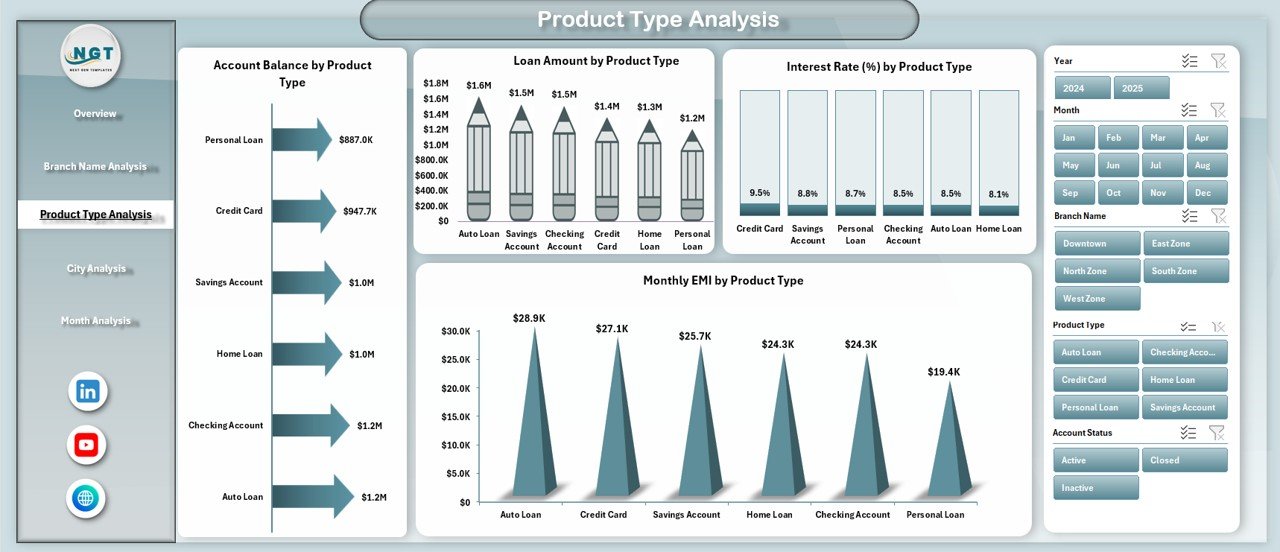
The Product Type Analysis Page evaluates the performance of different financial products.
Why Should Credit Unions Analyze Product Types?
Product-level insights help credit unions:
-
Improve product profitability
-
Adjust interest rates
-
Optimize EMI structures
-
Focus on high-demand offerings
Charts Included in Product Type Analysis
-
Account Balance by Product Type
-
Loan Amount by Product Type
-
Interest Rate % by Product Type
-
Monthly EMI by Product Type
Because product trends change frequently, this page helps credit unions stay competitive.
Click to Purchases Credit Unions Dashboard in Excel
How Does City Analysis Support Regional Strategy?
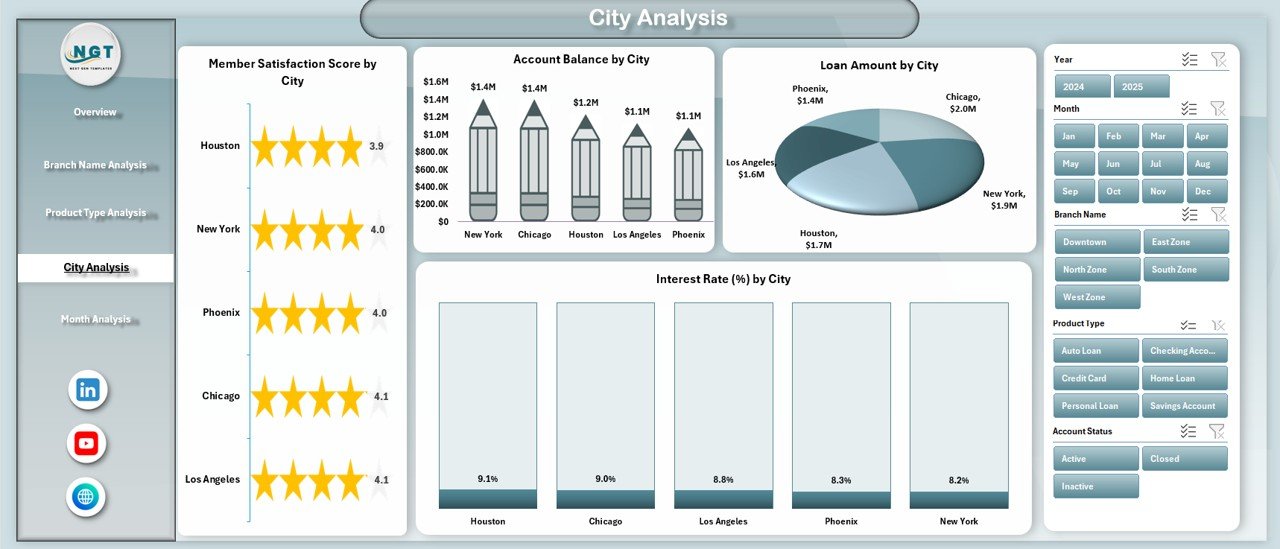
The City Analysis Page breaks down performance by geographic location.
Why Is City-Wise Analysis Important?
Different cities show different behaviors. Therefore, city-wise insights help credit unions:
-
Understand regional demand
-
Track city-specific delinquency risks
-
Customize marketing and lending strategies
Charts Available on the City Analysis Page
-
Member Satisfaction Score by City
-
Account Balance by City
-
Loan Amount by City
-
Interest Rate % by City
As a result, leadership teams can make region-specific decisions confidently.
How Does Month Analysis Help Track Trends Over Time?
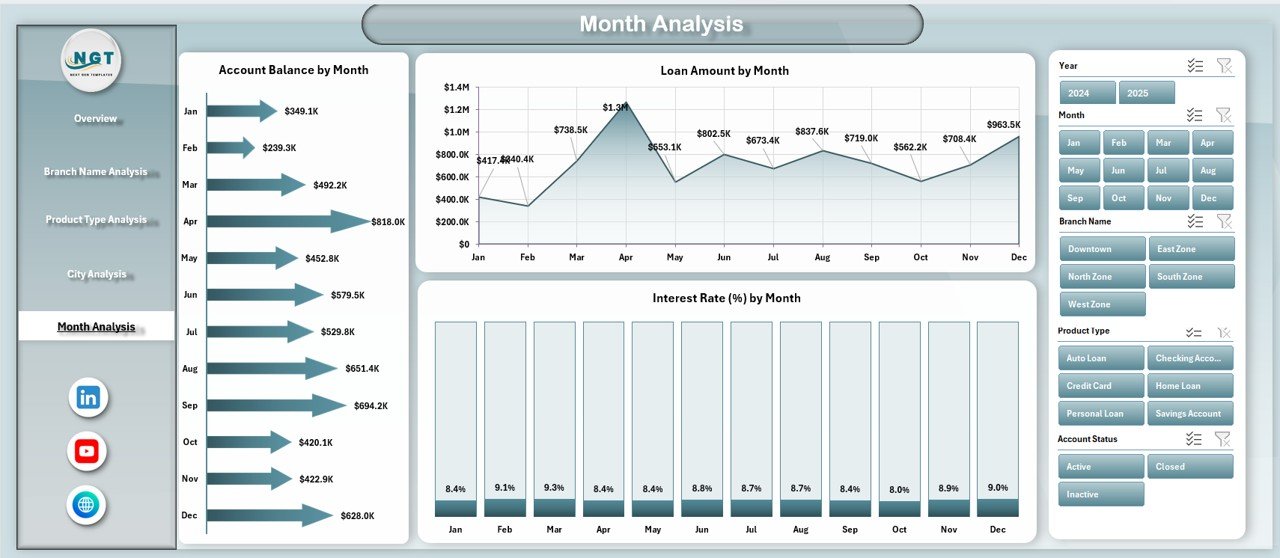
The Month Analysis Page focuses on time-based performance.
Why Is Monthly Analysis Critical?
Monthly trends help credit unions:
-
Track growth momentum
-
Identify seasonal patterns
-
Monitor interest rate movements
-
Forecast future performance
Charts Included in Month Analysis
-
Account Balance by Month
-
Loan Amount by Month
-
Interest Rate % by Month
Because trends matter more than single data points, this page supports long-term planning.
What Is the Role of the Data Sheet and Support Sheet?
Data Sheet
The Data Sheet stores all raw transactional and master data used by the dashboard. Users update this sheet regularly to refresh insights.
Support Sheet
The Support Sheet manages helper tables, formulas, and calculations that power slicers and charts.
Together, these sheets ensure accuracy, scalability, and automation.
Advantages of Credit Unions Dashboard in Excel
A Credit Unions Dashboard in Excel offers several strategic advantages.
Why Should Credit Unions Use This Dashboard?
-
✅ Centralized performance tracking
-
✅ Faster decision-making
-
✅ Improved member satisfaction monitoring
-
✅ Better risk and delinquency control
-
✅ Cost-effective alternative to BI tools
-
✅ Easy customization and scalability
-
✅ No advanced technical skills required
Because Excel remains familiar, adoption becomes faster across teams.
Who Can Benefit from a Credit Unions Dashboard in Excel?
Click to Purchases Credit Unions Dashboard in Excel
This dashboard supports multiple stakeholders.
Key Beneficiaries
-
Credit union executives
-
Branch managers
-
Finance and loan officers
-
Risk and compliance teams
-
Operations and strategy teams
Each role gains relevant insights without complexity.
How Can Credit Unions Use This Dashboard Daily?
Credit unions can integrate this dashboard into daily operations.
Practical Use Cases
-
Daily performance reviews
-
Monthly management meetings
-
Branch performance evaluations
-
Product profitability reviews
-
Risk and delinquency monitoring
Because data updates automatically, users always work with the latest numbers.
Best Practices for the Credit Unions Dashboard in Excel
To get maximum value, credit unions should follow best practices.
How Can You Use the Dashboard Effectively?
-
🔹 Update the data sheet regularly
-
🔹 Maintain consistent data formats
-
🔹 Use slicers for focused analysis
-
🔹 Review trends instead of isolated numbers
-
🔹 Train users on dashboard navigation
-
🔹 Protect formulas and support sheets
-
🔹 Archive historical data monthly
By following these practices, credit unions ensure long-term success.
How Does This Dashboard Support Strategic Growth?
A Credit Unions Dashboard in Excel does more than reporting. It supports strategic growth by:
-
Identifying high-value members
-
Highlighting profitable products
-
Reducing delinquency exposure
-
Improving branch efficiency
-
Strengthening member relationships
Because data-driven strategies outperform intuition, this dashboard becomes a growth enabler.
Click to Purchases Credit Unions Dashboard in Excel
Conclusion: Why Is a Credit Unions Dashboard in Excel a Smart Investment?
A Credit Unions Dashboard in Excel transforms how credit unions analyze performance. Instead of juggling reports, teams gain a single source of truth.
This ready-to-use dashboard delivers clarity, speed, and confidence. Moreover, it empowers decision-makers to act proactively, reduce risks, and enhance member satisfaction.
In a competitive financial landscape, data-driven insights make the difference. Therefore, investing in a structured Excel dashboard is not just smart—it is essential.
Frequently Asked Questions (FAQs)
What is a Credit Unions Dashboard in Excel?
A Credit Unions Dashboard in Excel is a visual reporting tool that tracks KPIs like member satisfaction, loans, balances, interest rates, and delinquency using interactive charts and slicers.
Can non-technical users use this dashboard?
Yes. The dashboard uses Excel features that most users already know. Therefore, no advanced technical skills are required.
How often should credit unions update the data?
Credit unions should update the data sheet daily or monthly, depending on reporting needs. Regular updates ensure accurate insights.
Can this dashboard handle large datasets?
Yes. With proper structure and optimization, Excel dashboards can handle thousands of records efficiently.
Can credit unions customize the dashboard?
Absolutely. Users can add KPIs, charts, or pages based on their operational needs.
Is this dashboard suitable for small and large credit unions?
Yes. The dashboard scales easily, making it suitable for both small and large credit unions.
Does this dashboard replace BI tools?
While BI tools offer advanced analytics, this Excel dashboard provides a cost-effective, flexible, and user-friendly alternative for many credit unions.
Visit our YouTube channel to learn step-by-step video tutorials