Customer onboarding is one of the most critical processes in any business. When a new customer signs up, the way you introduce them to your product or service determines whether they continue the journey or churn early. A structured onboarding process ensures customers understand the value of your offering, stay engaged, and become long-term loyal clients.
However, tracking onboarding progress without a system is difficult. That’s where a Customer Onboarding Report in Excel comes into play. It provides a simple yet powerful way to monitor every stage of onboarding, measure success rates, and identify bottlenecks. With dashboards, charts, and data tables, businesses can quickly analyze how well customers move from registration to completion.
In this guide, we will explore:
Click to Purchases Customer Onboarding Report in Excel
-
The structure of a Customer Onboarding Report in Excel
-
The benefits of using Excel for onboarding analytics
-
Practical use cases
-
Best practices to improve onboarding tracking
-
Frequently asked questions
What Is a Customer Onboarding Report in Excel?
A Customer Onboarding Report in Excel is a pre-designed template that helps organizations measure how effectively new customers are guided through the onboarding journey. Instead of scattered data, the report centralizes customer onboarding information in one Excel file, allowing easy tracking and visualization.
This template typically includes:
-
Summary dashboards with cards and charts
-
Detailed reports with filters (slicers)
-
Data sheets for raw input
-
Support sheets for reference values
It is especially useful for sales teams, customer success managers, and onboarding specialists who need to measure success and improve customer experience.
Key Features of the Customer Onboarding Report in Excel
The report is structured into three primary pages plus a supporting sheet. Each page has unique features that simplify analysis:
Summary Page

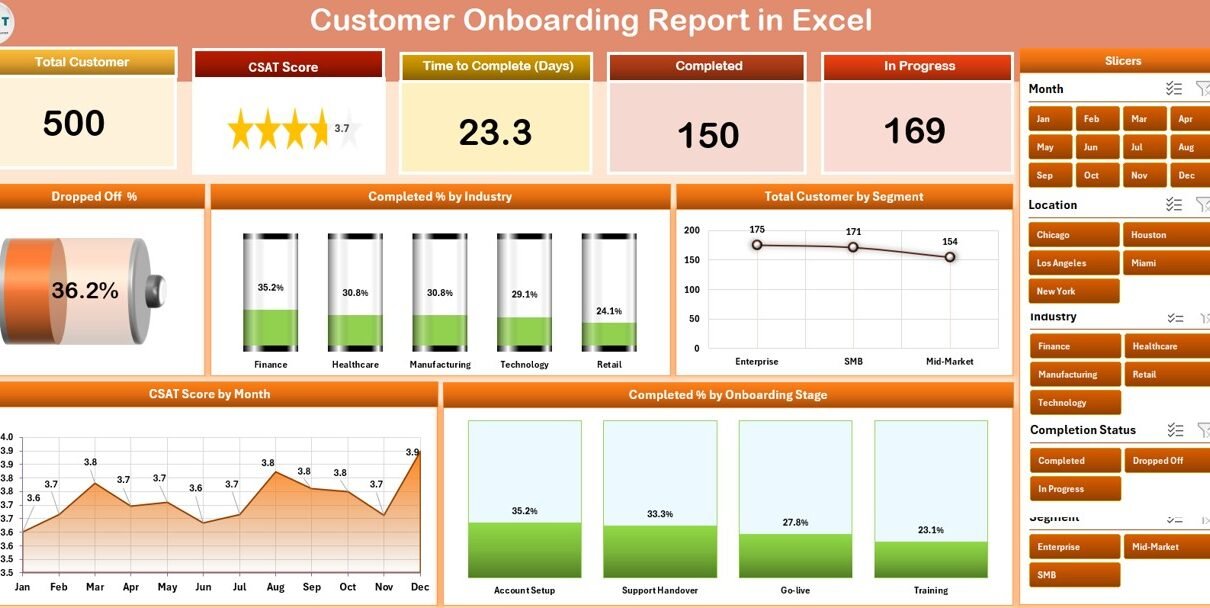
The Summary Page acts as the main dashboard. It includes:
-
Top 5 KPI Cards: Quick insights into key metrics such as total customers, drop-off rate, completion %, CSAT score, and active onboarding customers.
-
Right-side Slicer: Lets you filter by date, industry, or segment.
Charts for visualization:
- Dropped Off rate
- Completed % by Industry
- Total Customers by Segment
- CSAT Score (Customer Satisfaction) by Month
- Completed % by Onboarding Stage
This page allows managers to get a snapshot of onboarding health at a glance.
Report Page

The Report Page provides detailed information with slicers and data tables.
-
Left-side Slicer: Enables filtering by customer segment, industry, or onboarding stage.
-
Information Table: Displays granular data such as customer name, segment, current onboarding step, completion %, assigned manager, and remarks.
This page helps teams zoom into customer-level details.
Click to Purchases Customer Onboarding Report in Excel
Data Sheet

The Data Sheet stores raw data such as:
-
Customer ID
-
Name
-
Industry
-
Segment
-
Onboarding Start Date
-
Current Stage
-
Completion %
-
CSAT Score
All calculations and dashboards are powered by this sheet, making it the backbone of the report.
Support Sheet

The Support Sheet contains reference values, lookup lists, and dropdown data. Examples include:
-
Onboarding stages list
-
Industry codes
-
Segment values
-
Standard metrics and formulas
This ensures consistency and automation across the report.
Why Use Excel for Customer Onboarding Reports?
Excel remains one of the most flexible and widely used reporting tools worldwide. Even though advanced BI tools like Power BI exist, many businesses prefer Excel because:
✅ User-friendly: Most employees already know how to use Excel.
✅ Customizable: Easy to adjust reports without coding.
✅ Affordable: No additional licensing costs for small teams.
✅ Data Integration: Can import data from CRM, ERP, or spreadsheets.
✅ Scalable: Handles both small and medium-sized datasets.
Advantages of Customer Onboarding Report in Excel
Implementing this report can transform the onboarding experience. Key benefits include:
📊 Clear Visibility: Track customer progress across stages.
⏱️ Time Savings: Automated dashboards reduce manual reporting.
🎯 Better Decision-Making: Identify bottlenecks and allocate resources effectively.
🧩 Custom Segmentation: Analyze onboarding success by industry, region, or customer type.
📉 Churn Reduction: Spot at-risk customers early and intervene.
😊 Improved Customer Experience: Higher satisfaction through proactive support.
How to Use the Customer Onboarding Report in Excel
Using this template is straightforward:
-
Input Data in Data Sheet
Enter customer details such as name, industry, start date, stage, and completion %. -
Check Summary Page
Review key KPIs and onboarding trends. -
Analyze Report Page
Use slicers to filter specific industries, regions, or customer types. -
Take Action
Identify customers stuck in a stage, low CSAT scores, or high drop-off segments.
Best Practices for Customer Onboarding Report in Excel
To get maximum value from this report, follow these best practices:
🔹 Update Data Regularly: Keep the data sheet updated to reflect real-time progress.
🔹 Define Clear Stages: Standardize onboarding stages (e.g., registration, setup, training, first success).
🔹 Monitor KPIs Weekly: Track completion % and drop-off trends consistently.
🔹 Automate Imports: Use Excel connections to CRM or ERP systems for automatic updates.
🔹 Focus on At-Risk Customers: Pay special attention to customers with low CSAT or high drop-off.
🔹 Customize for Your Business: Add industry-specific KPIs like time-to-first-value or NPS.
Opportunities for Improvement
While the Excel-based onboarding report is powerful, businesses can take it further by:
-
Integrating with CRM tools for real-time updates.
-
Expanding KPIs to include time-to-value, renewal rates, and upsell conversions.
-
Using Power BI or Tableau for advanced analytics and scalability.
-
Adding automation macros in Excel to reduce manual effort.
Click to Purchases Customer Onboarding Report in Excel
Real-World Use Cases
Here are some scenarios where businesses can use this onboarding report:
-
SaaS Companies: Measure how quickly new users reach their first success.
-
Banks and Financial Services: Track account opening and KYC completion stages.
-
Healthcare Providers: Onboard patients to digital health portals.
-
Education Platforms: Track student registrations, course access, and completion.
-
Consulting Firms: Monitor onboarding of enterprise clients with custom projects.
Conclusion
A Customer Onboarding Report in Excel is more than just a spreadsheet. It is a complete monitoring tool that helps businesses reduce churn, improve customer satisfaction, and accelerate revenue growth. By using dashboards, slicers, and structured data sheets, organizations can transform their onboarding process into a smooth and data-driven journey.
Frequently Asked Questions (FAQs)
1. What is a Customer Onboarding Report in Excel?
It is a prebuilt Excel template that tracks customer progress, onboarding stages, drop-off rates, and satisfaction scores.
2. Why is onboarding reporting important?
Because it helps businesses reduce churn, improve customer experience, and ensure customers find value quickly.
3. Who can use this report?
Customer success managers, sales teams, onboarding specialists, and executives who want onboarding visibility.
4. Can I customize the template?
Yes, Excel allows you to add or remove KPIs, change stages, and update dashboards to suit your needs.
5. How often should I update the report?
Ideally, update it weekly or automate data imports from CRM for real-time accuracy.
6. What are the top KPIs to track in onboarding?
Common KPIs include completion %, drop-off rate, time-to-first-value, CSAT score, and churn rate.
7. Can this template integrate with CRM systems?
Yes, through Excel’s data connection features, you can link it with tools like Salesforce or HubSpot.
Visit our YouTube channel to learn step-by-step video tutorials