Customer relationships drive the success of every business. But managing those relationships manually can quickly become overwhelming. That’s where a Customer Relationship Management (CRM) Dashboard in Excel makes a real difference.
This ready-to-use CRM dashboard empowers businesses to track deals, monitor performance, analyze lead sources, and make informed decisions—all within a familiar Excel environment. In this comprehensive guide, you’ll explore everything you need to know about this tool, its benefits, best practices, and tips for implementation.
Click to Purchases Customer Relationship Management Dashboard in Excel
What is a Customer Relationship Management Dashboard in Excel?
A Customer Relationship Management Dashboard in Excel is a visual, interactive tool that helps you manage and track key CRM activities. Built entirely in Excel, it transforms raw sales and customer data into meaningful charts, tables, and performance metrics.
Whether you’re a sales manager, account executive, or business owner, this dashboard gives you a bird’s-eye view of your customer pipeline—without needing any expensive CRM software.
Why Should You Use an Excel-Based CRM Dashboard?
Let’s face it—CRM software can be expensive and difficult to customize. Excel, on the other hand, is:
-
Affordable and widely used
-
Easy to customize and integrate
-
Compatible with most data sources
-
User-friendly for all team members
By leveraging Excel, you can create a CRM solution tailored exactly to your business needs.
Click to Purchases Customer Relationship Management Dashboard in Excel
Key Features of the CRM Dashboard
This ready-to-use Excel CRM dashboard includes five powerful pages and two support sheets. Each page helps you visualize performance from a different angle.
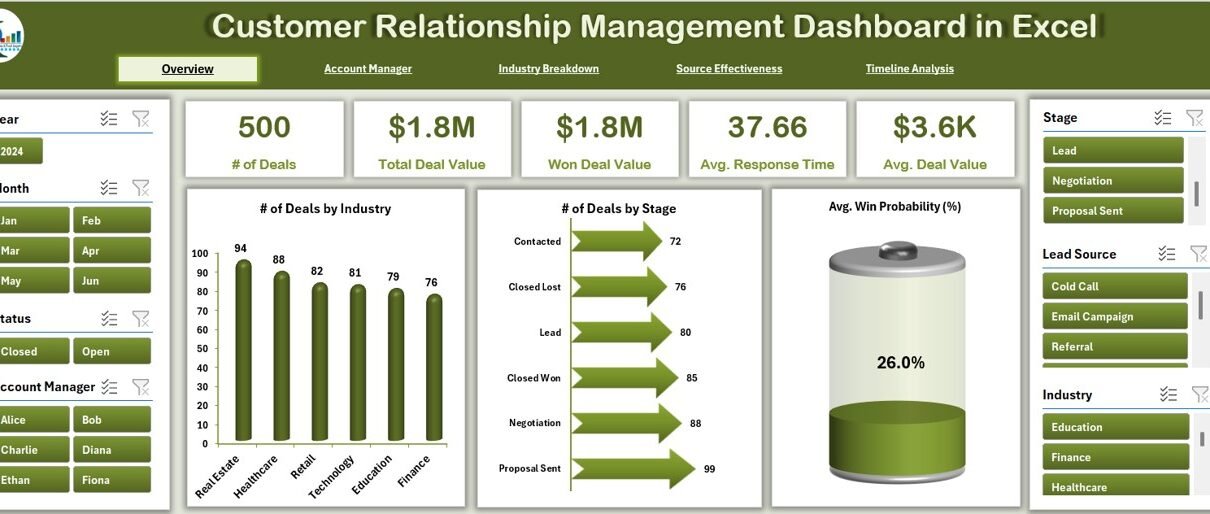
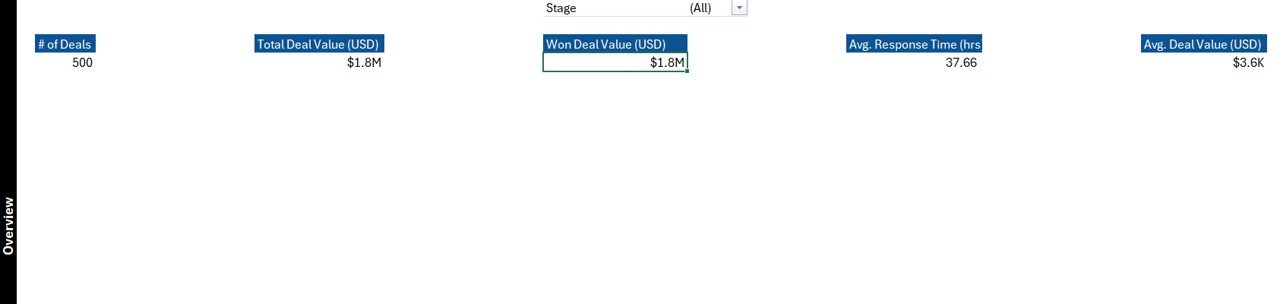
Overview Page
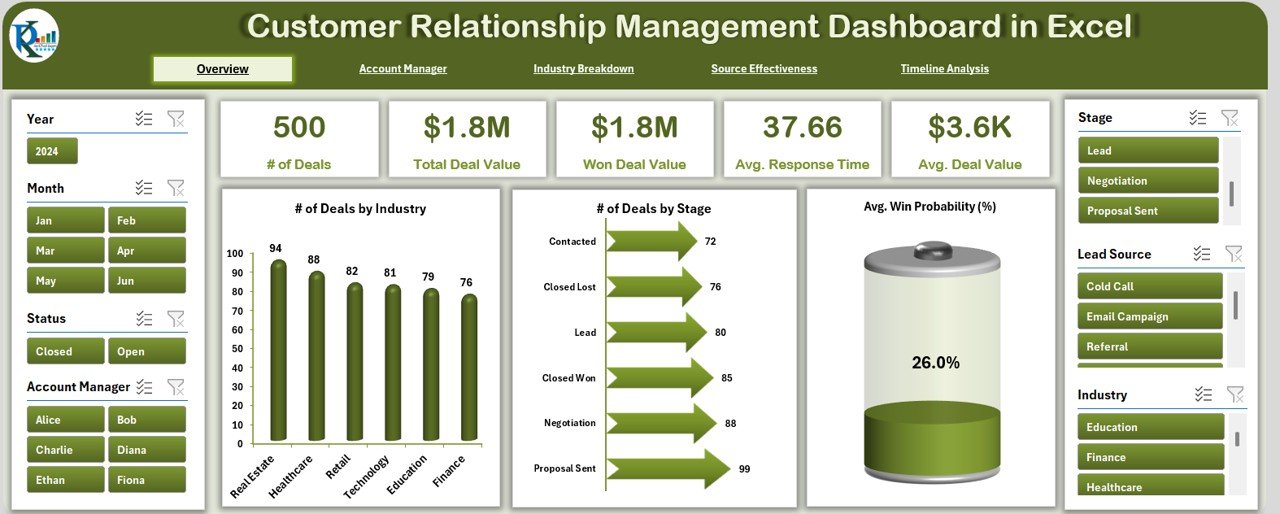
This is your command center. It provides a high-level summary of all CRM metrics.
📍 Left and right-side slicers for filtering by time, manager, or lead source
🧾 5 Key metric cards to show total deals, deal value, win rate, and more
📊 Visuals:
- Number of Deals by Month
- Total Deal Value (USD) by Month
- Average Win Probability (%) by Month
Account Manager Analysis
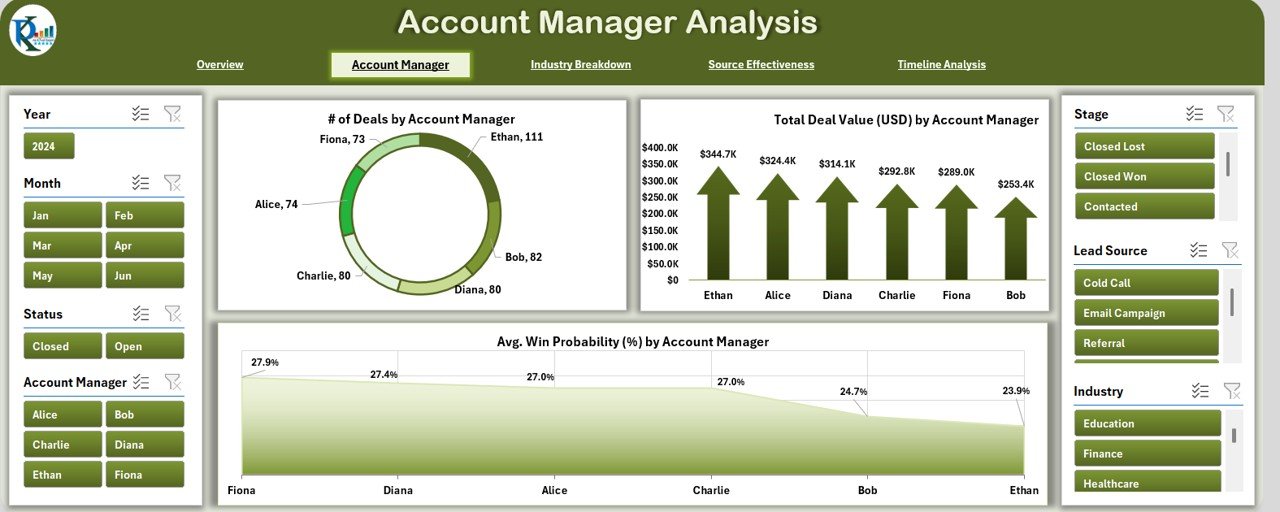
Drill down into how each account manager is performing.
Click to Purchases Customer Relationship Management Dashboard in Excel
-
🎯 Slicers for easy filtering
📊 Visuals:
- Number of Deals by Account Manager
- Total Deal Value (USD) by Account Manager
- Average Win Probability (%) by Account Manager
This page is great for performance reviews and incentive planning.
Industry Analysis
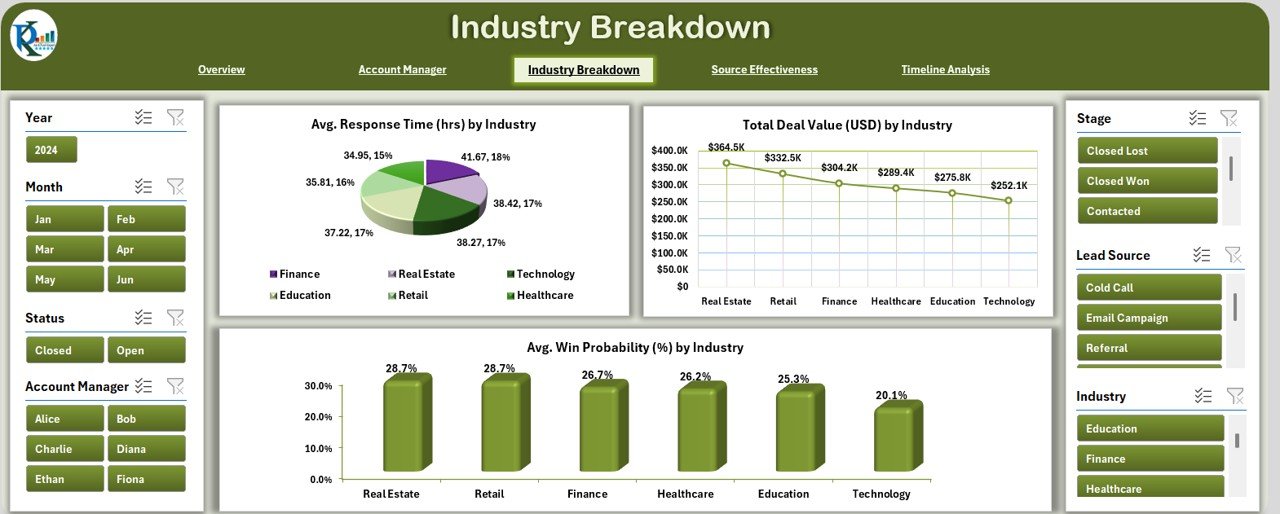
Understand which industries bring in the most valuable leads.
Click to Purchases Customer Relationship Management Dashboard in Excel
📊 Charts include:
- Average Response Time (hrs) by Industry
- Total Deal Value (USD) by Industry
- Average Win Probability (%) by Industry
Use this page to focus your sales strategy on high-value sectors.
Source Effectiveness
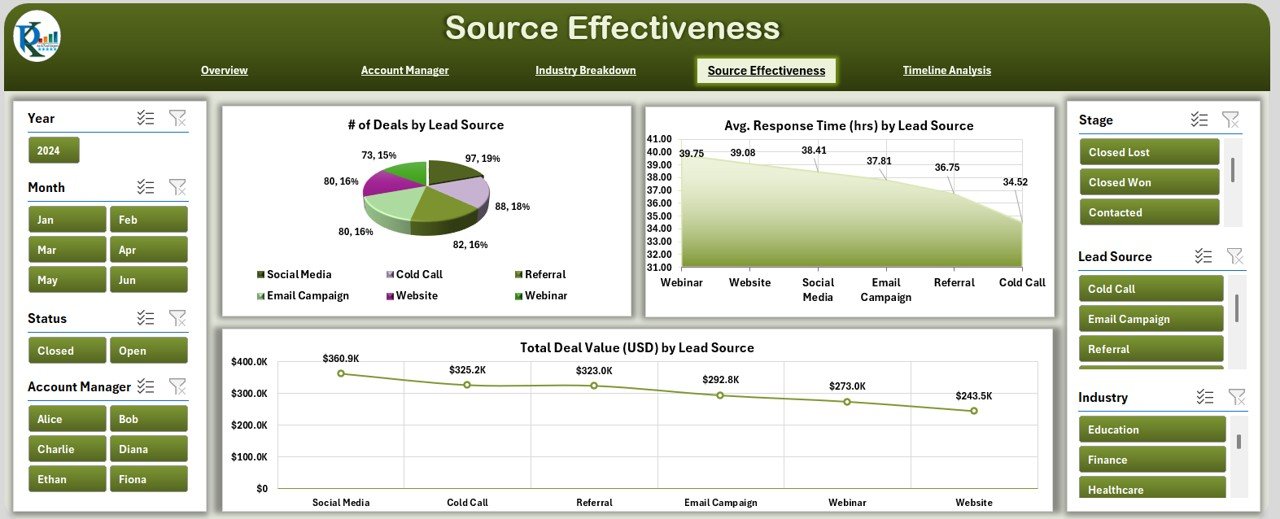
Not all leads are equal. This page uncovers which sources convert best.
📈 Charts include:
- Number of Deals by Lead Source
- Average Response Time (hrs) by Lead Source
- Total Deal Value (USD) by Lead Source
Perfect for marketing teams optimizing their campaign channels.
Timeline Analysis
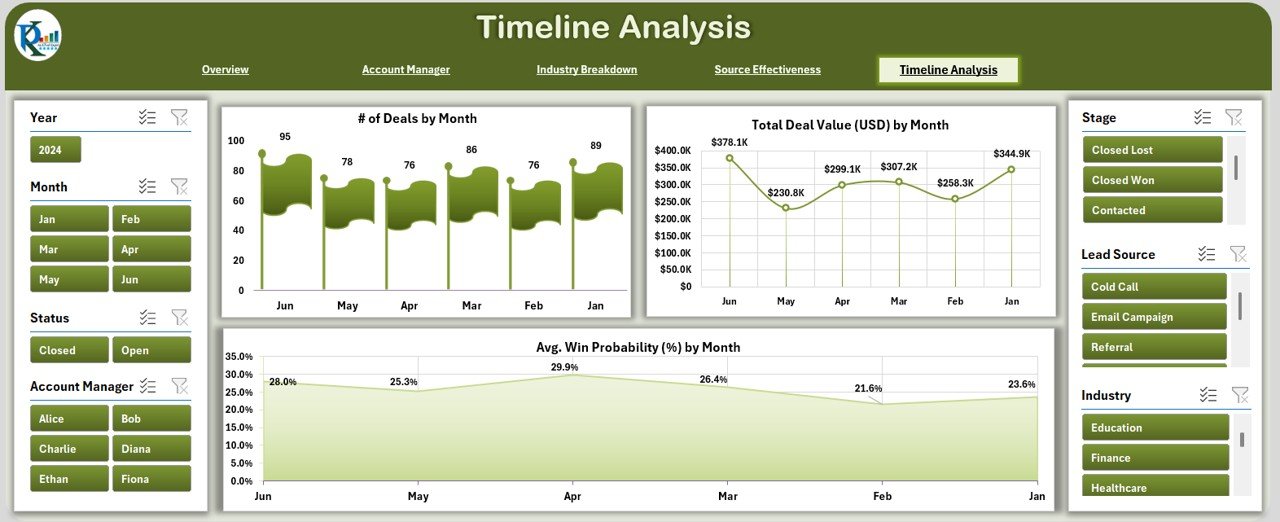
Track performance trends over time with:
-
Number of Deals by Month
-
Average Deal Value (USD) by Month
-
Average Win Probability (%) by Month
Use this section for forecasting, seasonal planning, and growth tracking.
Data Sheet: The Backbone of the Dashboard
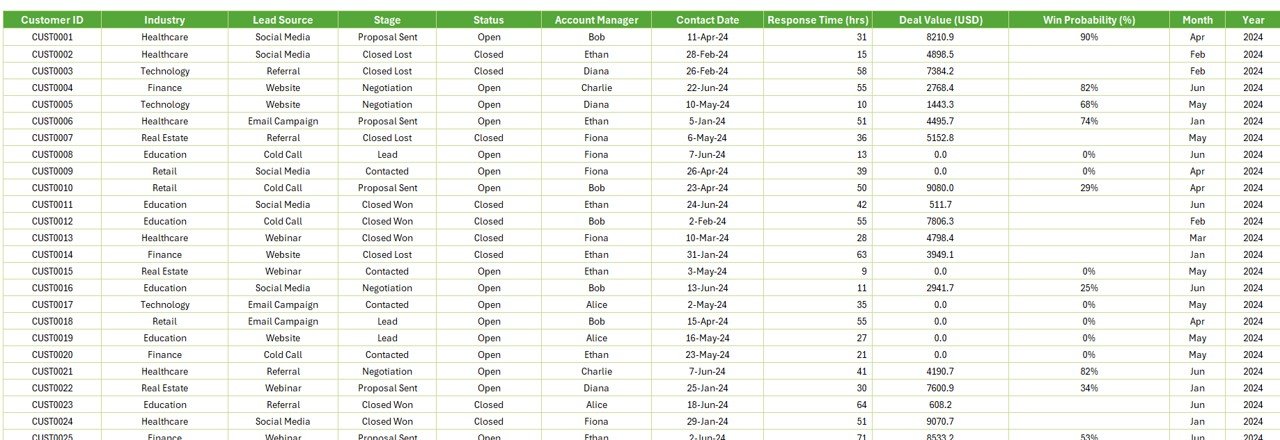
This is where you’ll input and update raw data. The columns include:
Click to Purchases Customer Relationship Management Dashboard in Excel
-
Customer ID
-
Industry
-
Lead Source
-
Stage
-
Status
-
Account Manager
-
Contact Date
-
Response Time (hrs)
-
Deal Value (USD)
-
Win Probability (%)
-
Month
-
Year
The dashboard updates dynamically based on these entries.
Support Sheet: Keep It Organized
This sheet holds reference data for drop-down lists like:
-
Industry names
-
Account manager names
-
Lead sources
It keeps your inputs standardized and error-free.
Advantages of Using a CRM Dashboard in Excel
Here’s why this dashboard is a game-changer:
✅ Easy Customization
You can tweak colors, add KPIs, or change the structure based on your specific business model.
✅ No Learning Curve
Everyone knows how to use Excel! Your team can get started immediately—no long training required.
✅ Cost-Effective
No subscription, no hidden fees. You own it.
✅ Powerful Analysis
Slicers, pivot charts, and metrics all in one place to make better decisions.
Best Practices for Using the CRM Dashboard
To make the most of your dashboard, follow these best practices:
1. Update Data Regularly
Ensure that your data sheet stays updated weekly or daily depending on activity.
2. Use Drop-down Lists
Avoid manual entry errors by using dropdowns in the support sheet for fields like status or manager name.
3. Track Response Times
Faster response times often lead to higher conversions. Keep an eye on this metric for each lead source.
4. Set Performance Goals
Use the dashboard to set realistic monthly or quarterly targets for your team.
5. Share with Stakeholders
Present visual insights during meetings using the dashboard—Excel is easily shareable and printable.
How This Dashboard Helps Your Sales Team
Your sales team can benefit in several ways:
-
Motivation through performance tracking
-
Improved focus on high-potential leads
-
Smarter allocation of resources
-
Real-time understanding of what’s working and what’s not
And because the dashboard updates instantly when data changes, the team stays aligned and proactive.
How Secure Is Your Excel CRM Dashboard?
Since Excel files are saved locally or on cloud drives like OneDrive or Google Drive, you can control access using:
-
Password protection
-
Restricted sharing permissions
-
Read-only versions for external stakeholders
This gives you a good balance of accessibility and data control.
Who Should Use This Dashboard?
This dashboard works perfectly for:
-
Small Business Owners
-
Sales Teams
-
Freelancers managing client pipelines
-
Marketing Managers
-
Startups without CRM budgets
Whether you want to boost conversions, manage accounts better, or just stay organized, this Excel CRM Dashboard gets the job done.
Customization Ideas to Enhance Your Dashboard
Here are a few ways to upgrade your CRM dashboard further:
-
Add a Deal Stage Funnel Chart
-
Include Revenue Forecast vs Actual chart
-
Track Customer Retention Rate over time
-
Highlight High Value Deals using conditional formatting
-
Create User Entry Forms using VBA for easy input
These additions make your dashboard even more powerful and user-friendly.
Conclusion
A Customer Relationship Management Dashboard in Excel bridges the gap between expensive CRM tools and basic spreadsheets. It offers a professional, customizable, and easy-to-use system that empowers your team to make data-driven decisions.
From tracking leads to analyzing response time, from evaluating sources to reviewing account manager performance—this dashboard handles it all.
If you’re ready to streamline your customer relationship strategy and take control of your sales data, this Excel dashboard is the perfect solution.
Frequently Asked Questions (FAQs)
1. Can I use this dashboard for large datasets?
Yes! Excel handles thousands of records using pivot tables efficiently. Just make sure your system has enough memory.
2. Is it possible to connect this dashboard to Google Sheets or Power BI?
You can export the Excel data to other tools or link Excel with Power BI using its data connectors.
3. How often should I update the data sheet?
We recommend updating the data sheet daily or at least weekly to keep your dashboard accurate.
4. Can I track follow-ups or reminders in this dashboard?
Yes, you can add extra columns for follow-up dates or use VBA to create reminder popups.
5. Is Excel CRM suitable for remote teams?
Absolutely. Save the file on a shared cloud drive like OneDrive or Google Drive and allow team members to collaborate.
Visit our YouTube channel to learn step-by-step video tutorials
Click to Purchases Customer Relationship Management Dashboard in Excel