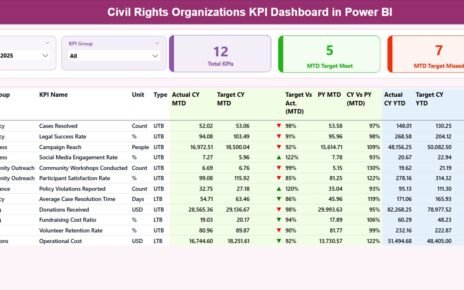
Civil rights organizations fight for justice, equality, and human dignity every single day. However, passion alone does not create measurable
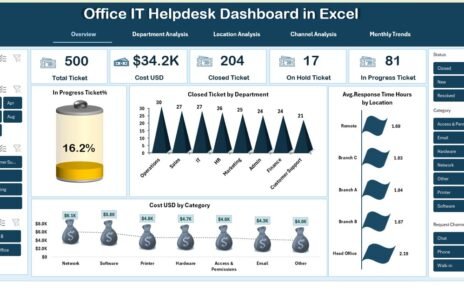
Every modern workplace depends on a smooth IT support process. Employees need quick solutions, fast response times, and complete visibility
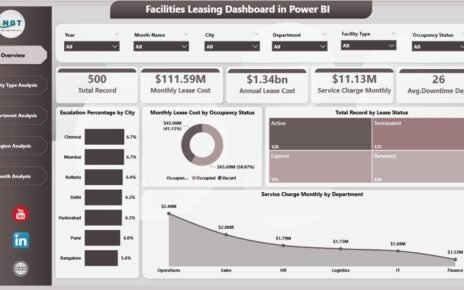
Managing facility leases across multiple locations often becomes complicated. Many organizations still depend on scattered spreadsheets and manual tracking. As