Managing Défense & Military KPI Dashboard in Excel operations requires precision, accountability, and constant monitoring of performance. Leaders must track personnel readiness, mission success rates, resource allocation, and compliance with strategic goals. Without a structured system, valuable insights can get lost, leading to delayed decisions and reduced efficiency.
This is where the Defense & Military KPI Dashboard in Excel becomes an essential tool. It transforms raw numbers into clear, visual insights that help commanders, administrators, and analysts monitor progress, identify issues early, and make data-driven decisions. Built entirely in Excel, this dashboard provides a cost-effective and customizable solution for defense organizations of all sizes.
In this article, we will explore the features, structure, advantages, best practices, and real-world applications of this ready-to-use KPI dashboard.
Click to Purchases Défense & Military KPI Dashboard in Excel
What Is a Defense & Military KPI Dashboard in Excel?
A Defense & Military KPI Dashboard in Excel is a pre-built analytics template that consolidates all key performance indicators (KPIs) into one file. Instead of tracking data manually in multiple sheets or relying on complex software, teams can use this Excel dashboard to:
-
Monitor mission readiness and operational efficiency
-
Compare actual performance against targets
-
Track historical data and identify trends
-
Improve transparency and accountability
-
Support strategic decision-making at every level
By centralizing metrics such as troop strength, mission completion rate, logistics readiness, and budget utilization, the dashboard ensures that leaders always have the right information at the right time.
Key Features of the Defense & Military KPI Dashboard
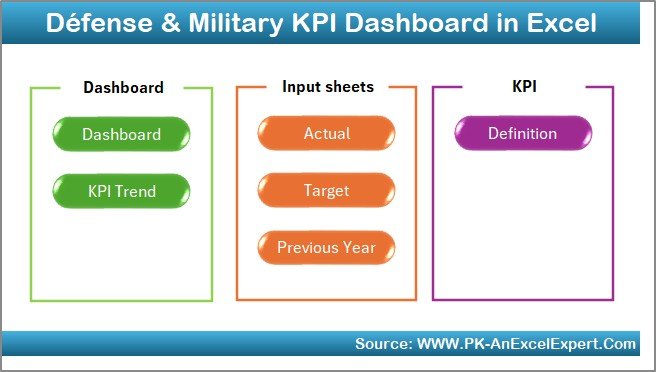
The dashboard is structured across seven worksheets, each designed for a unique purpose. Let’s explore them in detail.
Home Sheet
-
Acts as the index page
-
Includes six buttons for quick navigation to other sheets
-
Saves time by avoiding manual scrolling through tabs
-
Provides a professional look with a clean interface
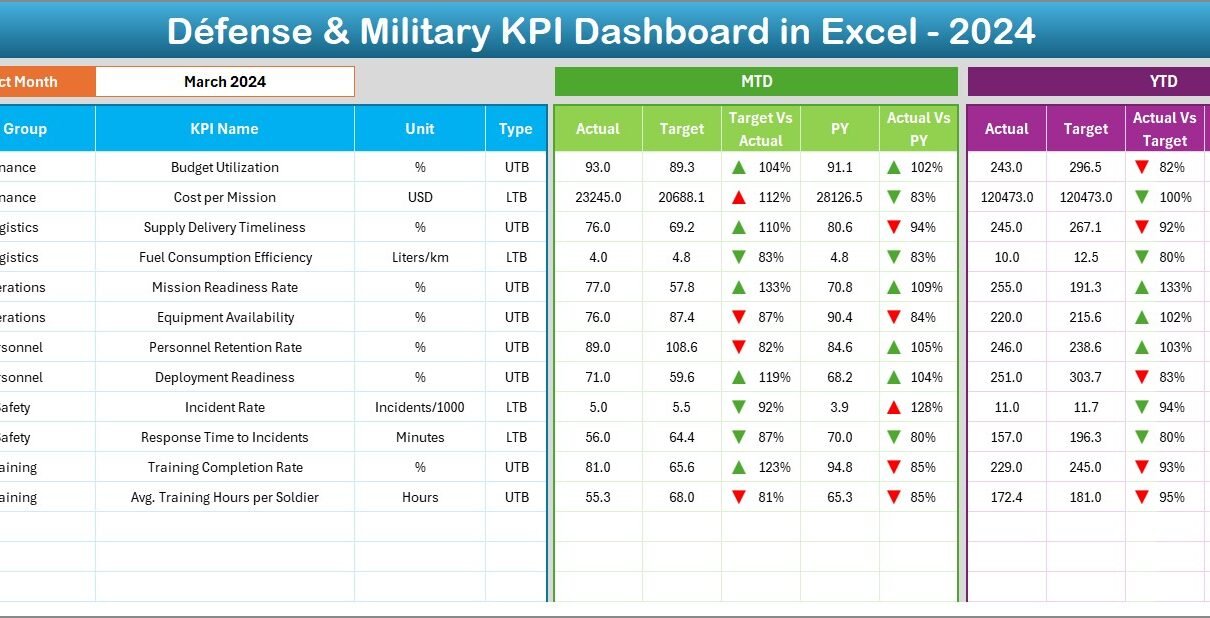
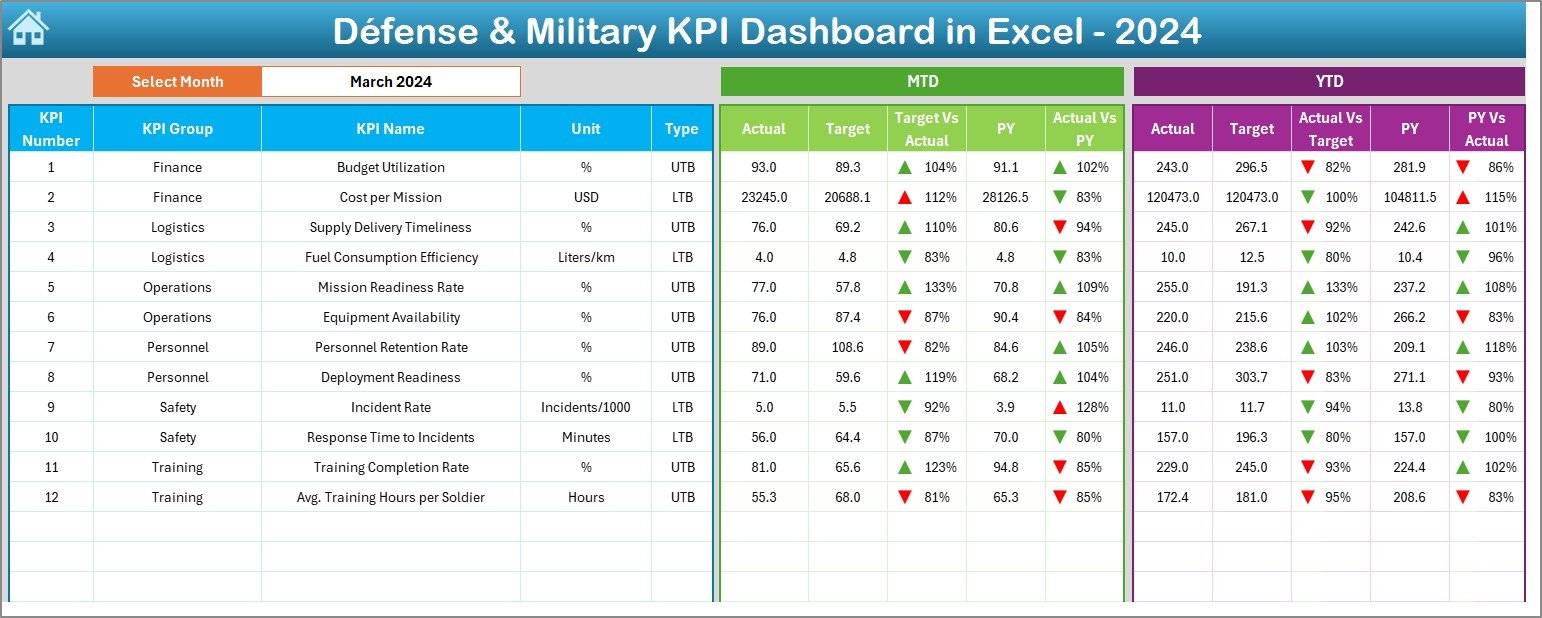
Dashboard Sheet Tab
-
The main control center of the template
-
Month selection is available in cell D3
-
Displays MTD (Month-to-Date) and YTD (Year-to-Date) actuals, targets, and previous year numbers
-
Uses conditional formatting arrows (up/down) to indicate performance trends
-
Provides instant visibility on whether the team is on track or falling behind
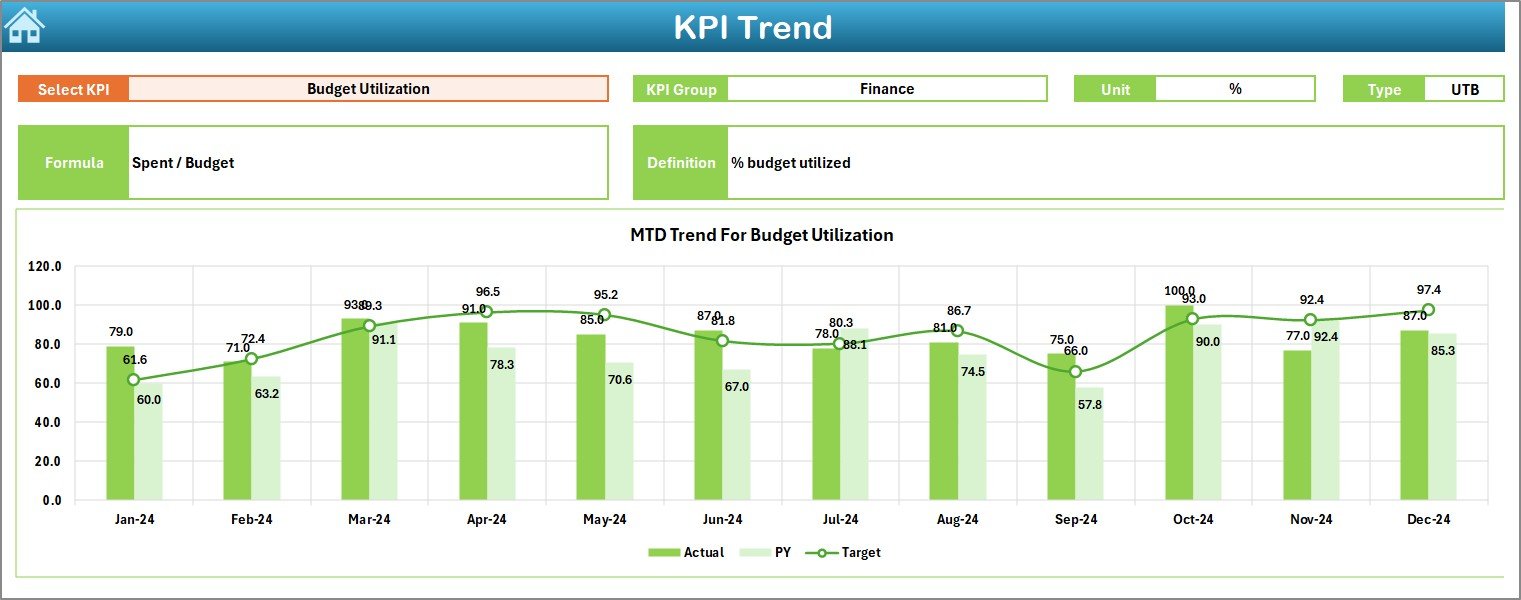
KPI Trend Sheet Tab
-
Allows users to select any KPI from a dropdown in cell C3
-
Shows KPI Group, Unit, Type (LTB = Lower the Better, UTB = Upper the Better), Formula, and Definition
-
Displays both MTD and YTD trend charts for actual, target, and previous year data
-
Helps identify patterns such as seasonal fluctuations or consistent underperformance
Click to Purchases Défense & Military KPI Dashboard in Excel
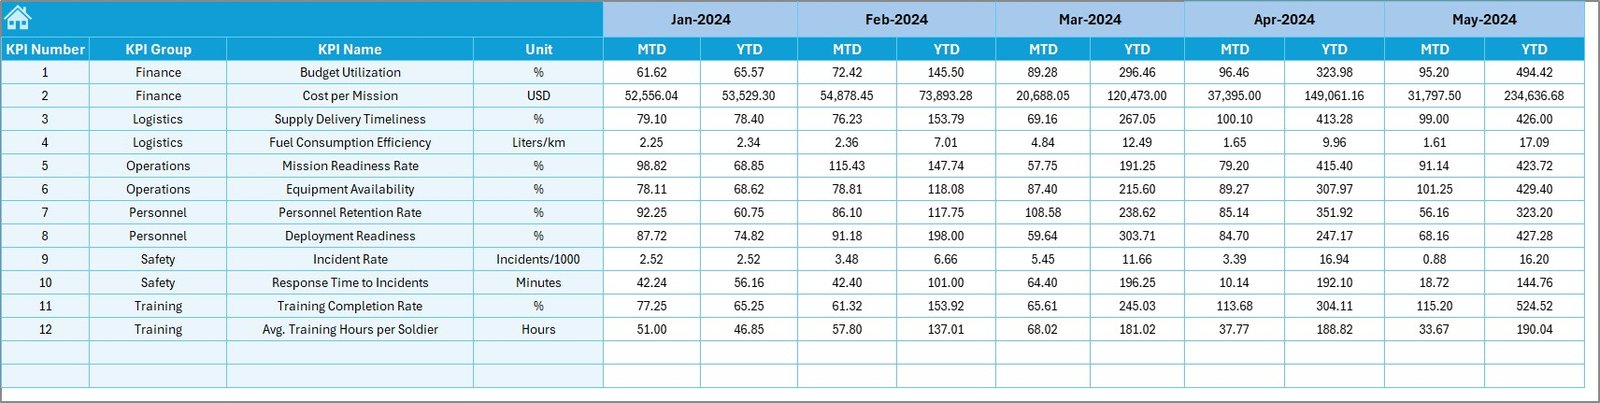
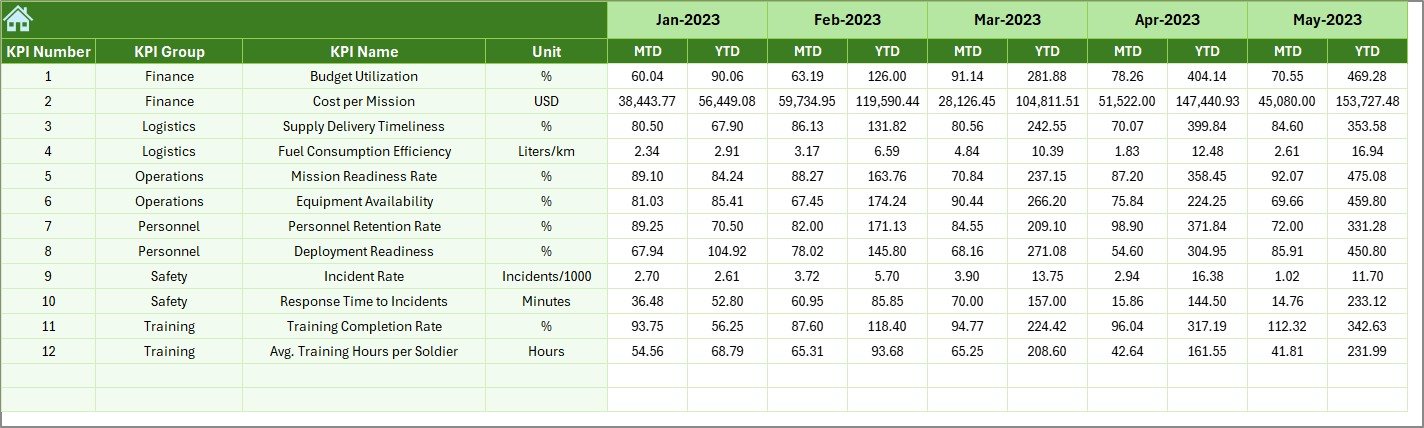
Actual Numbers Input Sheet
-
Designed for data entry
-
Users enter monthly actual values for MTD and YTD
-
Month reference is set in cell E1 for flexibility
-
Ensures smooth functioning of the dashboard by feeding accurate input data
Target Sheet Tab
-
Stores monthly target values for all KPIs
-
Includes both MTD and YTD targets
-
Creates a benchmark to measure real performance against planned goals
Previous Year Numbers Sheet Tab
-
Captures historical data from the last year
-
Allows comparison between current and previous performance
-
Essential for spotting long-term progress and consistency
KPI Definition Sheet Tab
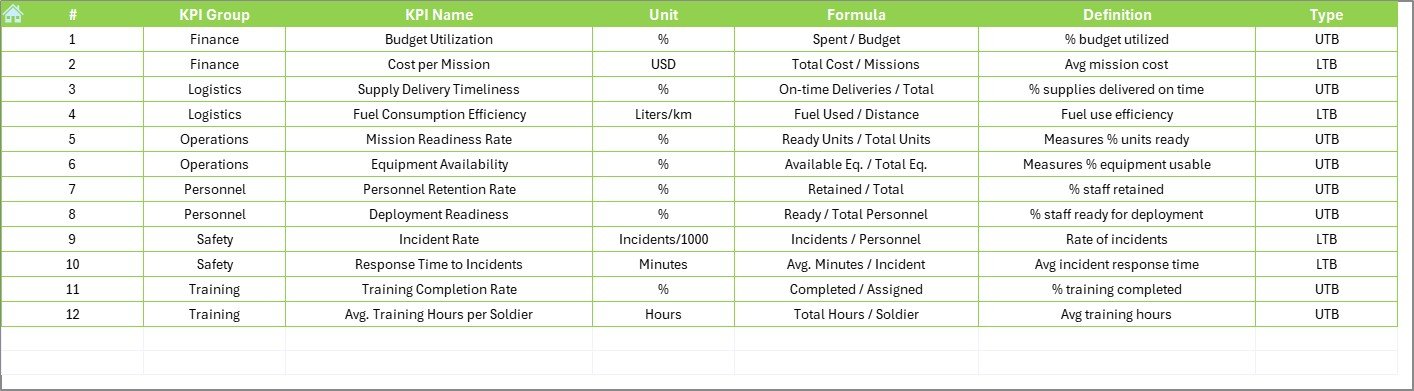
-
Acts as the reference library for KPIs
-
Stores KPI Name, Group, Unit, Formula, and Definition
-
Ensures clarity and standardization across teams
-
Helps new users understand what each KPI measures and why it matters
Why Use Excel for Defense & Military Dashboards?
Many organizations consider specialized software for analytics. However, Excel remains a strong choice because:
-
Accessibility: Almost everyone in the defense and administrative sector already has Excel.
-
Ease of Use: Teams can start using the template without extensive training.
-
Customization: KPIs, formulas, and charts can be easily modified as per organizational needs.
-
Cost Efficiency: No need for expensive licenses or technical support.
-
Compatibility: Works seamlessly with other data sources like CSV, Access, or SQL exports.
Advantages of Defense & Military KPI Dashboard in Excel
This dashboard offers several benefits to military planners, administrators, and analysts:
1. Centralized Data Tracking
All KPIs are captured in one file, eliminating scattered reports and reducing confusion.
2. Real-Time Decision Support
Leaders can check whether units are meeting readiness goals or budget targets without waiting for lengthy reports.
3. Improved Accountability
Performance indicators highlight areas where goals are missed, creating opportunities for corrective action.
4. Trend Analysis
Charts and historical data reveal whether performance issues are one-time or recurring.
5. Flexibility
KPIs can be easily added or modified as military operations evolve.
6. Cost Savings
Excel eliminates the need for additional IT infrastructure, making this solution highly economical.
Best Practices for the Defense & Military KPI Dashboard
To get the most from this dashboard, follow these best practices:
-
Define KPIs Clearly: Use the KPI Definition sheet to maintain transparency.
-
Ensure Data Accuracy: Always validate actual and target numbers before inputting.
-
Use Consistent Units: Keep measurement units (hours, %, counts) standardized across KPIs.
-
Update Regularly: Refresh actual data monthly to keep the dashboard relevant.
-
Leverage Visual Cues: Use the conditional arrows and trend charts to spot issues instantly.
-
Secure Sensitive Data: Protect files with passwords and limit access to authorized personnel.
-
Back Up Historical Data: Store copies of each year’s file to build a long-term performance library.
Examples of KPIs You Can Track
Here are some common defense and military KPIs that fit well in this dashboard:
-
Troop Readiness (%) – Percentage of personnel fit for deployment (UTB)
-
Mission Success Rate (%) – Completed missions vs. planned missions (UTB)
-
Logistics Readiness Index – Availability of vehicles, equipment, and supplies (UTB)
-
Training Completion Rate (%) – Troops trained vs. scheduled (UTB)
-
Budget Utilization (%) – Actual spend vs. allocated budget (LTB or UTB depending on goal)
-
Equipment Downtime (hrs) – Average time equipment is unavailable (LTB)
-
Accident Frequency Rate – Safety indicator to reduce operational risks (LTB)
How to Use the Dashboard Effectively
- Start with Definitions: Enter KPI details in the KPI Definition sheet.
- Set Targets: Fill in the monthly targets in the Target Sheet.
- Enter Previous Year Data: Add last year’s numbers for comparison.
- Input Actuals: Update the Actual Numbers Input sheet each month.
- Analyze Trends: Use the Dashboard and KPI Trend sheets for insights.
- Review Regularly: Schedule monthly or quarterly review meetings to discuss results.
Opportunities for Improvement
Even though this dashboard is powerful, users can enhance it further:
-
Add pivot tables for deeper drill-downs.
-
Integrate with Power Query to automate data imports.
-
Use Excel slicers for interactive filtering.
-
Apply color-coded heatmaps to highlight risk areas.
-
Extend the dashboard to track multi-year performance.
Conclusion
The Defense & Military KPI Dashboard in Excel offers a simple yet effective way to manage complex operations. By centralizing key metrics, comparing actuals against targets, and providing trend insights, it empowers leaders to make informed, timely decisions. Best of all, it leverages Excel — a tool that is already accessible, familiar, and flexible.
This dashboard is not just about tracking numbers; it’s about enhancing readiness, accountability, and mission success. Whether you manage troops, logistics, or defense budgets, this tool provides clarity and direction in an increasingly complex world.
Frequently Asked Questions (FAQs)
1. What are Defense & Military KPIs?
They are measurable values that track the performance of military operations, including readiness, mission success, training, logistics, and budget usage.
2. Why should I use Excel instead of specialized software?
Excel is cost-effective, accessible, and highly customizable. While specialized tools are powerful, Excel dashboards are easier to implement and maintain for most organizations.
3. How often should I update the dashboard?
You should update it monthly to track MTD and YTD values. However, high-priority KPIs (like readiness or incident rates) may need weekly updates.
4. Can I add new KPIs to the dashboard?
Yes. The KPI Definition sheet makes it easy to add, define, and track new KPIs as your organization’s priorities change.
5. How do conditional arrows work in the dashboard?
They use Excel’s conditional formatting. If the actual is better than the target, a green upward arrow appears. If it falls short, a red downward arrow appears.
6. Is this dashboard secure for sensitive data?
Yes, but you must apply Excel’s password protection and restrict access. For highly classified data, store files in secure systems.
7. Can this dashboard handle large data sets?
Yes, but performance depends on your Excel version and system capacity. For very large datasets, integrating Excel with Power BI may be more efficient.
8. Who can benefit from this dashboard?
Defense administrators, military analysts, logistics officers, training coordinators, and senior leadership teams can all benefit.
Visit our YouTube channel to learn step-by-step video tutorials