Department stores operate in one of the most competitive sectors of modern retail. Customers expect excellent service, fresh inventory, fast checkout, clear pricing, and a consistent shopping experience. Because of this, retail managers must track dozens of key performance indicators every month. However, traditional manual reporting makes this difficult. Numbers get scattered across files, formulas break, and decision-makers lose valuable time.
A Department Stores KPI Dashboard in Excel solves this problem quickly and effectively. It gives clear visibility into sales performance, footfall, customer satisfaction, stock movement, and operational KPIs — all in one place. As a result, retail teams understand their performance instantly and take action based on real data rather than guesswork.
This article explains everything you need to know about the Department Stores KPI Dashboard in Excel. You will learn how it works, what each sheet contains, why retailers use it, and how it improves decision-making. You will also explore best practices, advantages, and frequently asked questions.
Click to Purchases Department Stores KPI Dashboard in Excel
What Is a Department Stores KPI Dashboard in Excel?
A Department Stores KPI Dashboard in Excel is a ready-to-use reporting tool that tracks all important KPIs of a department store’s operations. It collects data from multiple sources and presents it through smart visualizations, conditional formatting arrows, trend analysis charts, and KPI tables.
Because retail businesses depend on real-time insights, this dashboard helps store managers, data analysts, and leadership teams make quick decisions. It eliminates manual reporting and provides automated MTD (Month-to-Date) and YTD (Year-to-Date) performance insights.
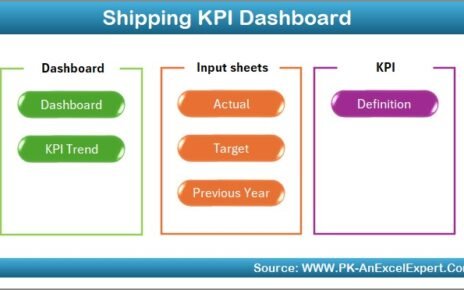
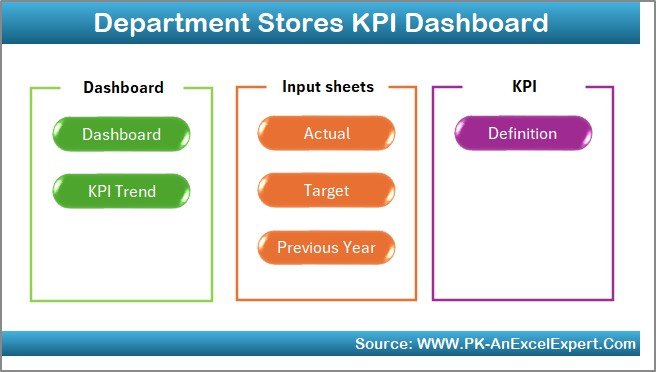
The dashboard includes seven worksheets, each designed for a specific purpose:
-
Home Page
-
Dashboard
-
KPI Trend
-
Actual Numbers Input
-
Target Sheet
-
Previous Year Numbers
-
KPI Definition
Together, these sheets make the entire reporting system powerful, flexible, and easy to maintain.
Why Do Department Stores Need a KPI Dashboard?
Retail environments change every day. Promotions, customer demand, seasonal trends, and competition all influence store performance. Because department stores have many categories — clothing, electronics, household items, cosmetics, accessories, and more — performance tracking becomes complex.
A KPI dashboard helps because it:
-
Shows MTD and YTD performance instantly
-
Compares actuals with targets
-
Highlights KPIs that fall below expectations
-
Tracks previous year performance
-
Simplifies decision-making
-
Visualizes trends across months
-
Improves store operations by identifying gaps
-
Helps teams stay aligned with business goals
When store managers understand what works and what needs improvement, they make smarter decisions.
Key Features of the Department Stores KPI Dashboard in Excel
Let’s explore the seven worksheets included in this dashboard and understand how they work together.
1. Home Sheet – Navigation Made Easy
The Home sheet acts as the dashboard’s main index page. It contains six buttons, each linked to a specific sheet. When users click a button, they instantly jump to the selected page. Because large Excel files can be difficult to navigate, this smart navigation feature improves user experience.
This sheet also provides clarity for new users and keeps the entire workbook easy to use during presentations.
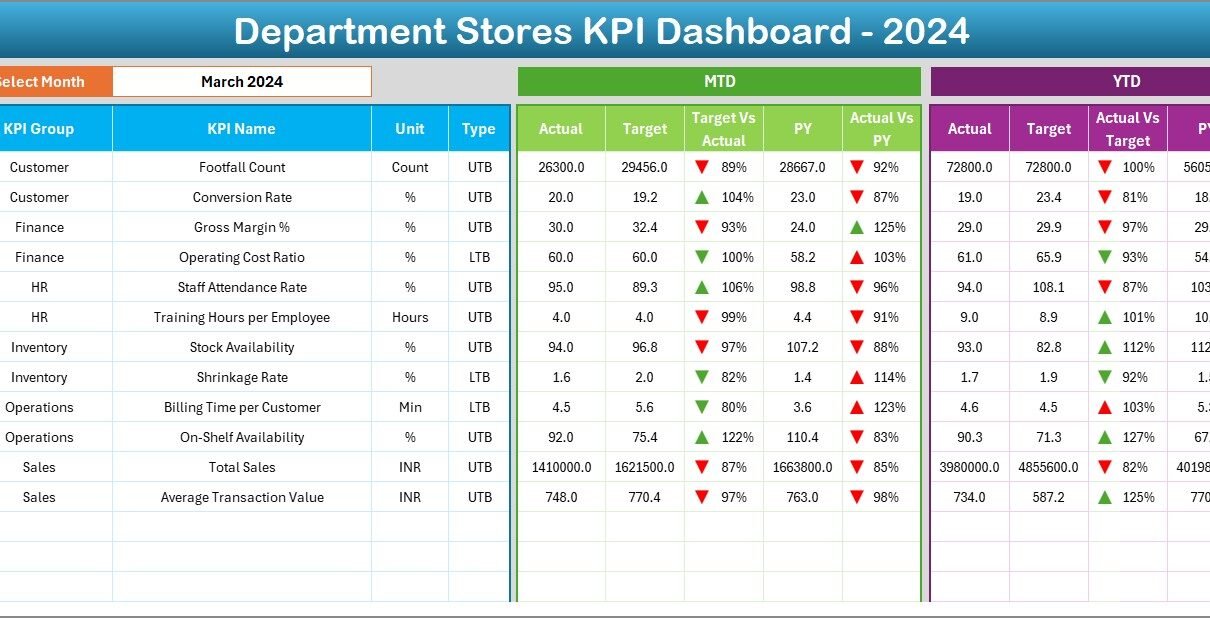
2. Dashboard Sheet – The Core Performance Overview

The Dashboard sheet is where you will find all major KPIs in a clean and interactive format. This is the main working area of the entire dashboard.
✔ Monthly Selection
On cell D3, users can choose a month from a drop-down. The entire dashboard updates instantly based on that month’s performance. This makes the dashboard dynamic and easy to refresh.
✔ MTD (Month-to-Date) KPI Cards and Metrics
For each KPI, the dashboard displays:
-
MTD Actual
-
MTD Target
-
MTD Previous Year
-
Target vs Actual %
-
CY vs PY %
-
Conditional Formatting Arrows (▲ ▼)
Green arrows indicate positive performance, while red arrows signal concerns. This color-coded visualization helps store leaders grasp performance instantly.
✔ YTD (Year-to-Date) KPI Cards and Metrics
For long-term analysis, the dashboard also displays YTD metrics:
-
YTD Actual
-
YTD Target
-
YTD Previous Year
-
Target vs Actual (YTD)
-
CY vs PY (YTD)
-
Conditional formatting arrows
YTD numbers help decision-makers understand the bigger picture beyond monthly variations.
Click to Purchases Department Stores KPI Dashboard in Excel
3. KPI Trend Sheet – Understanding Performance Patterns
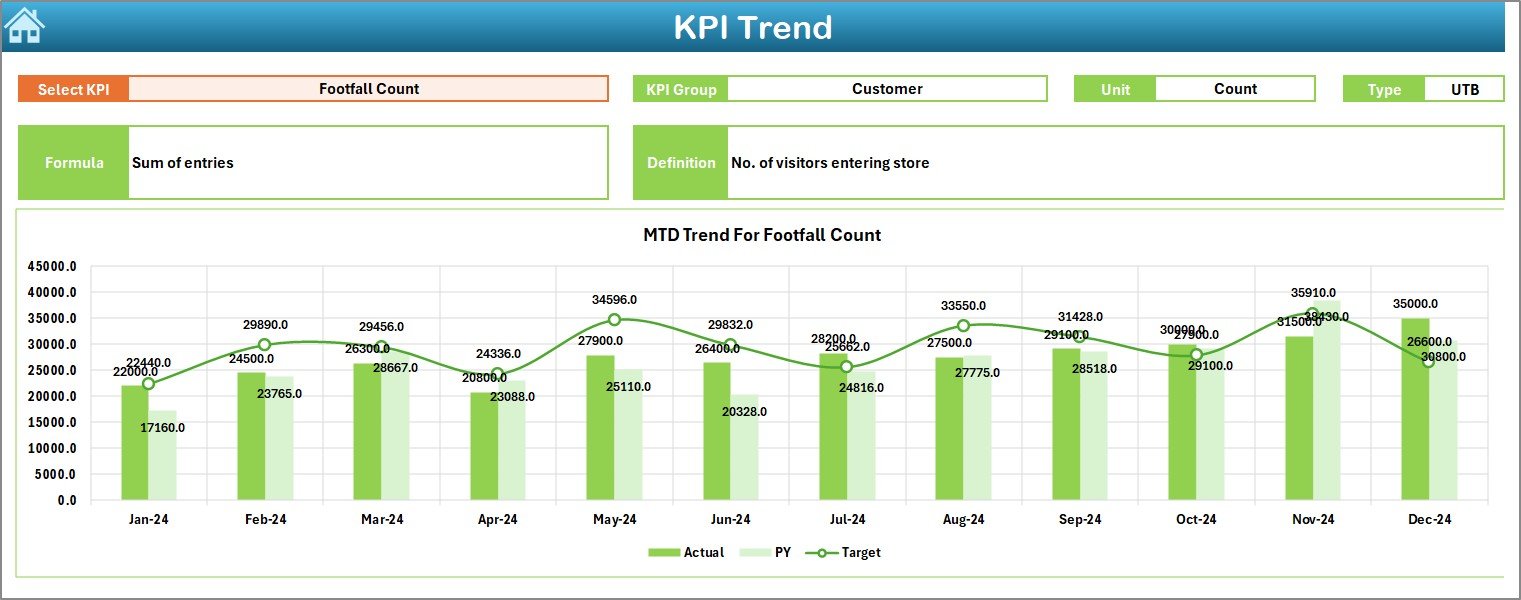
Retail trends shift quickly. The KPI Trend sheet helps identify patterns by allowing the user to select any KPI from a drop-down menu (cell C3).
Once a KPI is selected, the sheet displays:
✔ KPI Group
✔ Unit of Measurement
✔ KPI Type (LTB or UTB)
✔ Formula Used
✔ KPI Definition
This provides clarity and transparency for every metric.
✔ MTD and YTD Trend Charts
Two trend charts show:
-
Current Year Actual
-
Target
-
Previous Year Actual
Trends help store managers understand whether performance is improving, declining, or stabilizing. Because trends reveal hidden patterns, they support better forecasting and planning.
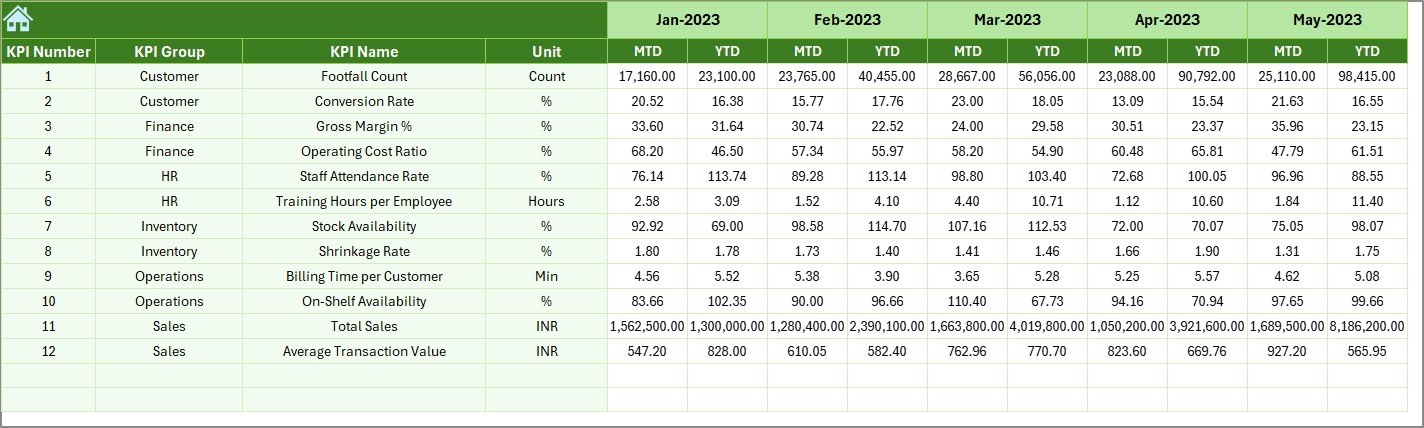
4. Actual Numbers Input Sheet – Easy Data Entry
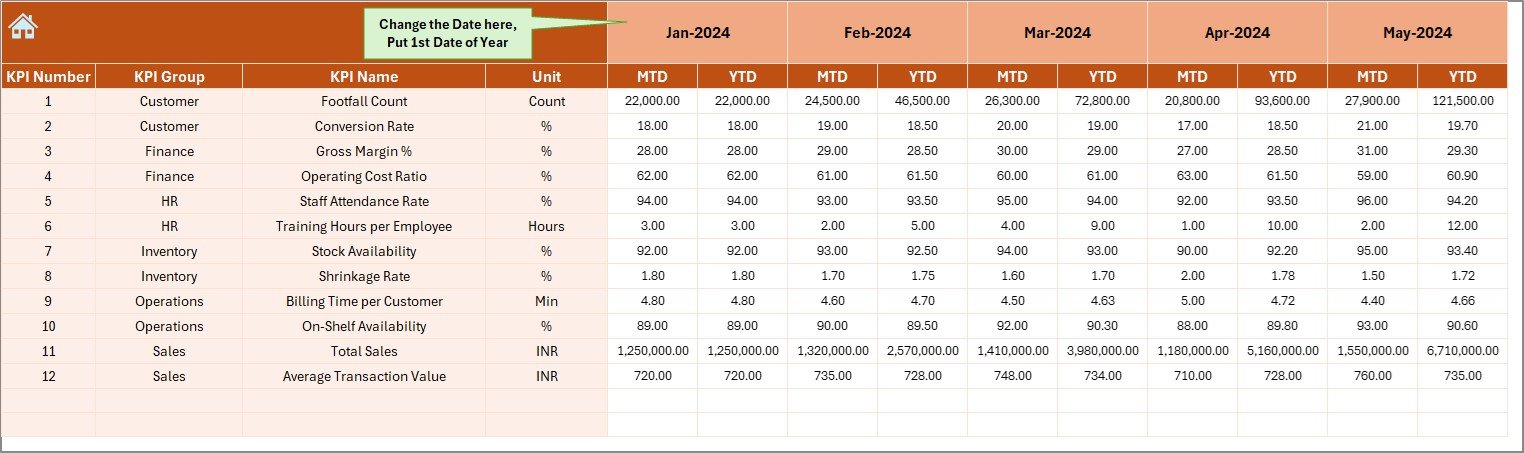
This sheet is used to enter the Actual numbers for:
-
MTD
-
YTD
-
For each KPI
-
For each month
Users simply change the month in cell E1 (first month of the year), and the structure updates automatically.
This sheet keeps actual numbers consistent and organized.
5. Target Sheet – Goal Setting Made Simple
The Target sheet stores the monthly targets for each KPI. Users enter:
-
MTD Target
-
YTD Target
-
KPI Name
-
Month
These targets help measure how well the store performs relative to its goals.
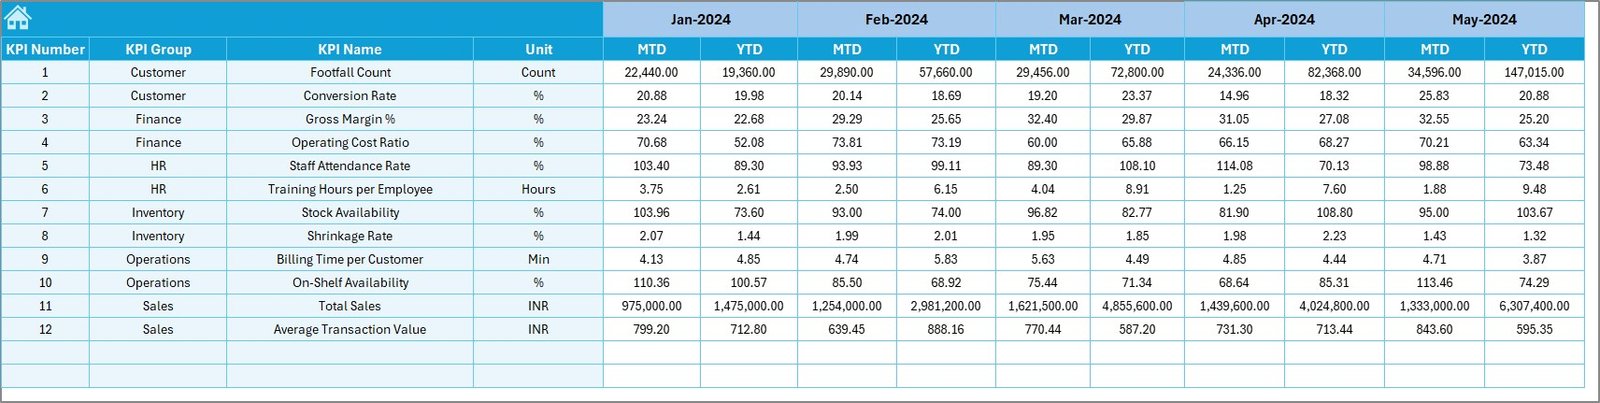
6. Previous Year Numbers Sheet – Historical Benchmarking
Tracking previous year numbers is important because it helps stores understand long-term performance. This sheet stores:
-
Last year’s MTD values
-
Last year’s YTD values
Comparing CY vs PY highlights growth opportunities and exposes areas that need improvement.
Click to Purchases Department Stores KPI Dashboard in Excel
7. KPI Definition Sheet – Transparency for All KPIs

This sheet stores essential metadata:
-
KPI Name
-
KPI Group
-
Unit
-
Formula
-
KPI Definition
Having a clear definition for each KPI avoids confusion and keeps reporting consistent across the team. It also helps new employees understand store metrics quickly.
What KPIs Can Department Stores Track With This Dashboard?
Every department store operates differently, but common KPIs include:
-
Total Sales
-
Footfall
-
Conversion Rate
-
Average Basket Value
-
Customer Satisfaction Score
-
Stock Turnover
-
Shrinkage Rate
-
Returns Percentage
-
Gross Profit
-
Discount Ratio
-
Online vs Offline Sales
-
Employee Productivity Score
Because the dashboard allows users to add new KPIs easily, it supports both small and large retail chains.
Click to Purchases Department Stores KPI Dashboard in Excel
Advantages of Department Stores KPI Dashboard in Excel
This dashboard offers several advantages that improve business performance.
1. Saves Time and Reduces Manual Work
Managers no longer spend hours updating multiple spreadsheets. The dashboard updates instantly with new monthly entries.
2. Improves Decision-Making
Color-coded indicators and trend charts help managers take action quickly.
3. Enhances Data Accuracy
Centralized data eliminates inconsistencies and reporting errors.
4. Clear Monthly and Yearly Comparisons
MTD and YTD visuals reveal both short-term and long-term performance.
5. Easy to Use for Non-Technical Staff
The dashboard uses simple drop-downs, charts, and visual cues.
6. Helps Identify Sales Opportunities
By analyzing trends and variances, retailers can spot growth opportunities.
7. Makes Inventory Planning Easier
Stock turnover and returns KPIs help avoid shortages or overstocking.
8. Improves Team Accountability
Each department understands its KPI targets and results.
9. Supports Strategic Planning
Historical data and YTD trends strengthen forecasting and budgeting.
10. Great for Presentations
Dashboards look professional and are ideal for reviews, meetings, and board discussions.
Click to Purchases Department Stores KPI Dashboard in Excel
Best Practices for Using the Department Stores KPI Dashboard
To get maximum value, follow these best practices:
1. Update Data Consistently
Enter actual and target numbers every month to maintain accuracy.
2. Review KPI Definitions Regularly
Retail environments change, so KPI definitions must stay relevant.
3. Use Trend Charts to Predict Future Performance
Trends highlight patterns that raw numbers cannot show.
4. Focus on Actionable KPIs
Track KPIs that directly influence sales, customer experience, and costs.
5. Engage Store Teams
Train staff to understand performance metrics and targets.
6. Validate Data Before Refreshing
Always check for incorrect data entries to avoid misleading insights.
7. Use Conditional Formatting Wisely
Visual cues help identify issues faster.
8. Keep the Dashboard Clean and Simple
Avoid clutter and focus on important metrics.
9. Compare CY, PY, and Target Together
This three-way comparison provides a clearer picture of performance.
10. Iterate and Improve
Refine the dashboard as business needs evolve.
How This Dashboard Helps Retail Managers Make Better Decisions
Retail managers must make quick decisions about:
-
Staffing
-
Promotions
-
Inventory
-
Pricing
-
Seasonal planning
-
Customer service
-
Store layout
This dashboard provides all the insights required to make these decisions confidently. It highlights what works and what doesn’t, making retail operations more strategic and efficient.
How This Dashboard Enhances Customer Experience
When KPIs improve, customer experience improves too. Stores become:
-
Faster
-
More organized
-
Better stocked
-
More customer-friendly
By monitoring KPIs like customer satisfaction and returns percentage, stores continuously refine their service quality.
Conclusion
The Department Stores KPI Dashboard in Excel is an essential tool for modern retail management. It simplifies data entry, delivers accurate performance insights, and helps managers make data-driven decisions. Because it includes MTD, YTD, PY comparisons, trend analysis, visual indicators, and metadata sheets, the dashboard becomes a complete retail reporting system.
Department stores that use this dashboard gain clear visibility, improve efficiency, and achieve better sales outcomes.
Click to Purchases Department Stores KPI Dashboard in Excel
Frequently Asked Questions (FAQs)
1. What is a Department Stores KPI Dashboard in Excel?
It is an Excel-based reporting tool that tracks sales, operations, and customer KPIs using MTD and YTD insights.
2. Who uses this dashboard?
Store managers, area managers, retail analysts, and leadership teams.
3. Can I add more KPIs to the dashboard?
Yes. You can modify the KPI Definition sheet to include new KPIs.
4. How often should I update data?
Monthly updates work best since the dashboard uses MTD and YTD values.
5. Does the dashboard support previous year comparisons?
Yes. The Previous Year sheet helps compare CY vs PY.
6. Do I need advanced Excel skills?
No. Basic Excel knowledge is enough.
7. Can this dashboard be used for multiple stores?
Yes. You can extend it by adding a Store column.
8. What if targets change mid-year?
Simply update the Target sheet for the revised numbers.
9. Can I customize the charts?
Yes. All charts are fully editable in Excel.
10. Does the dashboard support dropdown-based navigation?
Yes. The Home sheet includes quick navigation buttons.
Click to Purchases Department Stores KPI Dashboard in Excel
Visit our YouTube channel to learn step-by-step video tutorials