Running a dermatology clinic requires more than excellent clinical expertise. Today, clinics must track performance, manage patient flow, control costs, and improve outcomes at the same time. Therefore, leaders need clear visibility into their operations. That is exactly why a Dermatology Clinics KPI Dashboard in Power BI becomes a powerful and essential solution.
In this detailed and SEO-friendly guide, you will learn what a Dermatology Clinics KPI Dashboard in Power BI is, why it matters, how it works, and how clinics can use it to improve performance. Moreover, this article explains every dashboard page, KPI structure, Excel data setup, advantages, best practices, and frequently asked questions in simple language.
Click to buy Dermatology Clinics KPI Dashboard in Power BI
What Is a Dermatology Clinics KPI Dashboard in Power BI?
A Dermatology Clinics KPI Dashboard in Power BI is an interactive reporting and analytics tool designed to track key performance indicators for dermatology practices.
Instead of relying on multiple Excel sheets, emails, and manual reports, clinics can use one centralized dashboard built in Microsoft Power BI. As a result, decision-makers get real-time insights into clinical, operational, and financial performance.
Because Power BI supports slicers, drill-throughs, and dynamic visuals, this dashboard helps clinics analyze Month-to-Date (MTD) and Year-to-Date (YTD) performance effortlessly.
Why Do Dermatology Clinics Need a KPI Dashboard?
Dermatology clinics handle high patient volumes, diverse treatments, and strict compliance requirements. However, without structured monitoring, clinics often face inefficiencies.
Here is why a KPI dashboard becomes critical:
- First, it provides clear performance visibility across departments
- Second, it helps track targets versus actual results
- Third, it supports data-driven decision-making
- Additionally, it reduces manual reporting effort
- Finally, it improves patient care and profitability
Therefore, a Dermatology Clinics KPI Dashboard in Power BI transforms raw data into actionable insights.
How Does a Dermatology Clinics KPI Dashboard in Power BI Work?
The dashboard works by combining Power BI visuals with Excel-based data inputs. Because Excel acts as the data source, teams can easily update numbers without technical complexity.
The process works as follows:
- First, users enter KPI data into structured Excel sheets
- Then, Power BI reads and models the data
- After that, interactive visuals update automatically
- Finally, users analyze KPIs using slicers and drill-throughs
As a result, clinics always see updated performance metrics.
What Are the Key Pages in the Dermatology Clinics KPI Dashboard?
The dashboard includes three structured pages, each designed for a specific analytical purpose.
Summary Page – How Does the Overview Help Decision-Makers?
The Summary Page acts as the central control panel of the dashboard. Here, leadership teams get a complete snapshot of all KPIs in one place.
Key Features of the Summary Page
- Month slicer for time-based analysis
- KPI Group slicer for category-level filtering
- KPI performance cards at the top
- Detailed KPI table for in-depth review
KPI Cards on the Summary Page
At the top of the page, three cards display:
- Total KPIs Count
- MTD Target Met Count
- MTD Target Missed Count
Because these cards update dynamically, users instantly understand overall performance.
Detailed KPI Table – What Information Does It Show?
The table provides granular KPI-level insights, including:
- KPI Number – Unique sequence number
- KPI Group – Category of the KPI
- KPI Name – Name of the performance indicator
- Unit – Measurement unit (%, count, hours, etc.)
- Type – UTB (Upper the Better) or LTB (Lower the Better)
MTD Performance Metrics Explained
The Summary Page clearly highlights Month-to-Date performance:
- Actual CY MTD – Current year actual MTD value
- Target CY MTD – Target MTD value
- MTD Icon – ▲ or ▼ icons in green or red
- Target vs Actual (MTD) – Actual ÷ Target
- PY MTD – Previous year MTD value
- CY vs PY (MTD) – CY MTD ÷ PY MTD
Because of these indicators, users quickly identify overperformance or underperformance.
YTD Performance Metrics Explained
Similarly, Year-to-Date metrics include:
- Actual CY YTD
- Target CY YTD
- YTD Icon – Visual status indicator
- Target vs Actual (YTD) – Actual ÷ Target
- PY YTD
- CY vs PY (YTD) – CY YTD ÷ PY YTD
Therefore, clinics can track long-term trends alongside monthly results.

Click to buy Dermatology Clinics KPI Dashboard in Power BI
KPI Trend Page – How Do Trends Improve Decision-Making?
The KPI Trend Page focuses on performance movement over time. Instead of static numbers, this page highlights trends.
Key Elements of the KPI Trend Page
- KPI Name slicer on the left
- Two combo charts for MTD and YTD
- Comparison between Actual, Target, and Previous Year
Why Combo Charts Matter
Combo charts show:
- Current Year Actuals
- Previous Year Actuals
- Target Values
Because of this comparison, clinics can easily detect seasonality, growth patterns, and performance gaps.

Click to buy Dermatology Clinics KPI Dashboard in Power BI
KPI Definition Page – Why Is KPI Clarity Important?
The KPI Definition Page ensures transparency and consistency.
Key Features of the KPI Definition Page
- Hidden drill-through page
- Accessible from the Summary Page
- Displays KPI formula and definition
- Explains unit and KPI type (UTB or LTB)
As a result, all users interpret KPIs the same way.

Click to buy Dermatology Clinics KPI Dashboard in Power BI
How Does Drill-Through Improve Dashboard Usability?
Drill-through allows users to click a KPI on the Summary Page and view its definition instantly.
To return to the main page, users simply click the Back button on the top-left corner. Therefore, navigation remains simple and intuitive.
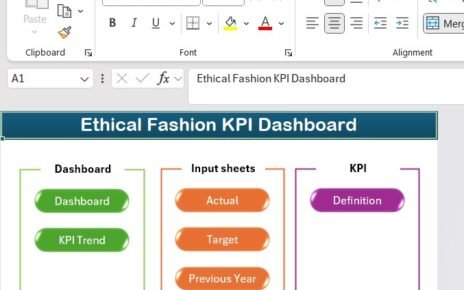
What Is the Excel Data Structure Behind the Dashboard?
The dashboard uses an Excel file as its data source, which makes maintenance easy.
Input_Actual Sheet – What Data Goes Here?
This sheet captures actual KPI performance.
Required fields include:
- KPI Name
- Month (first date of the month)
- MTD Actual Value
- YTD Actual Value
Because users update only numbers, data entry remains simple.

Click to buy Dermatology Clinics KPI Dashboard in Power BI
Input_Target Sheet – How Are Targets Defined?
This sheet stores KPI targets.
Required fields include:
- KPI Name
- Month (first date of the month)
- MTD Target Value
- YTD Target Value
Therefore, clinics can adjust targets without changing the dashboard structure.
KPI Definition Sheet – Why Is This Sheet Important?
This sheet defines KPI logic and meaning.
Fields include:
- KPI Number
- KPI Group
- KPI Name
- Unit
- Formula
- Definition
- Type (UTB or LTB)
Because definitions stay centralized, KPI governance improves.
What KPIs Can Dermatology Clinics Track?
A Dermatology Clinics KPI Dashboard can cover multiple performance areas.
Clinical KPIs
- Patient wait time
- Treatment success rate
- Follow-up compliance rate
- Procedure turnaround time
Operational KPIs
- Appointments per doctor
- No-show rate
- Clinic utilization rate
- Staff productivity
Financial KPIs
- Revenue per visit
- Cost per procedure
- Billing accuracy rate
- Profit margin
Patient Experience KPIs
- Patient satisfaction score
- Complaint resolution time
- Online review rating
Advantages of Dermatology Clinics KPI Dashboard in Power BI
Using a KPI dashboard offers multiple benefits.
Key Advantages
- Centralized performance monitoring
- Real-time insights with slicers
- Improved target tracking
- Faster decision-making
- Reduced manual reporting
- Better patient outcomes
- Scalable and flexible design
Therefore, clinics gain control, clarity, and confidence.
How Does Power BI Improve Dermatology Clinic Analytics?
Power BI enhances analytics by offering:
- Interactive visuals
- Dynamic filtering
- Drill-through capabilities
- Automated refresh
- Clean and professional layouts
As a result, even non-technical users can analyze data effectively.
Best Practices for the Dermatology Clinics KPI Dashboard in Power BI
To maximize value, clinics should follow best practices.
Define Clear KPIs
First, ensure each KPI aligns with clinic goals.
Maintain Accurate Excel Data
Second, update actual and target values regularly.
Use Monthly Reviews
Third, review MTD performance monthly.
Monitor YTD Trends
Additionally, track long-term performance patterns.
Train Users Properly
Finally, educate staff on slicers and drill-through features.
Who Should Use This Dashboard?
This dashboard suits multiple roles:
- Dermatology clinic owners
- Medical directors
- Operations managers
- Finance teams
- Quality and compliance teams
Because of its flexibility, it works for small clinics and multi-location practices.
How Does This Dashboard Support Growth?
By improving visibility and accountability, the dashboard helps clinics:
- Optimize scheduling
- Reduce costs
- Improve patient satisfaction
- Increase profitability
- Support strategic expansion
Therefore, analytics becomes a growth driver.
Conclusion
A Dermatology Clinics KPI Dashboard in Power BI is no longer optional in a competitive healthcare environment. Instead, it serves as a strategic tool that connects data, performance, and decision-making.
By combining Excel-based data entry with Power BI’s interactive visuals, clinics gain a powerful yet simple solution. Moreover, the structured Summary Page, Trend Page, and KPI Definition Page ensure clarity, consistency, and insight.
If dermatology clinics want better control, smarter decisions, and sustainable growth, this dashboard delivers exactly that.
Frequently Asked Questions (FAQs)
What is a Dermatology Clinics KPI Dashboard in Power BI?
It is an interactive Power BI report that tracks dermatology clinic KPIs using Excel as a data source.
Can non-technical users use this dashboard?
Yes, because slicers and visuals make analysis simple.
How often should data be updated?
Ideally, clinics should update data monthly.
Can KPIs be customized?
Yes, KPIs, targets, and definitions are fully customizable.
Does the dashboard support MTD and YTD analysis?
Yes, it tracks both Month-to-Date and Year-to-Date performance.
Is Excel required as a data source?
Yes, the dashboard uses Excel sheets for actuals, targets, and KPI definitions.
Visit our YouTube channel to learn step-by-step video tutorials
Watch the step-by-step video tutorial:
Click to buy Dermatology Clinics KPI Dashboard in Power BI