Digital media agencies handle multiple clients, campaigns, platforms, deliverables, and performance indicators every day. Because of this fast-paced environment, managers, analysts, and decision-makers need reliable tools that provide quick insights without wasting time on manual reporting. A Digital Media Agencies Dashboard in Excel solves this need. It transforms raw data into clear visual insights and helps every team stay aligned, efficient, and productive.
In this complete guide, you will learn what this dashboard is, how it works, its main features, its advantages, best practices, and much more. This article uses simple language, easy explanations, and a fully optimized structure for SEO. You will also find a FAQ section at the end to clear all common doubts.
Click to Purchases Digital Media Agencies Dashboard in Excel
What Is a Digital Media Agencies Dashboard in Excel?
A Digital Media Agencies Dashboard in Excel is a ready-to-use reporting tool that helps agencies track performance across services, campaigns, clients, and budgets. It includes charts, KPIs, filters, slicers, and automated visuals that update instantly when you change the inputs.
Unlike complex BI tools, Excel keeps the reporting flexible and easy to manage. You can update the data sheet, refresh your dashboard, and see the entire story of your agency’s performance in seconds.
This dashboard template includes:
-
Five fully designed analysis pages
-
Right-side slicers for quick filtering
-
KPI cards for instant insight
-
Automated charts
-
Budget, revenue, sentiment, campaign type, and service-type analysis
-
A data sheet for uploading or updating records
Because of these integrated features, the dashboard becomes a single source of truth for agency performance.
Why Do Digital Media Agencies Need an Excel Dashboard?
Digital media agencies manage:
-
Client projects
-
Campaign budgets
-
Revenue streams
-
Promo types
-
Campaign types
-
Industry-specific performance
-
Profitability
-
Sentiment-based insights
-
Monthly trends
Tracking everything manually leads to confusion and delays. With an Excel dashboard, you streamline reporting and make faster decisions. You also remain confident about the accuracy because Excel formulas and charts update in real time.
Key Features of the Digital Media Agencies Dashboard in Excel
The dashboard comes with five main pages in the Excel file. Each page highlights a different part of agency performance. A Page Navigator is located on the left side, allowing you to switch between all pages instantly.
Let’s explore each page in detail.
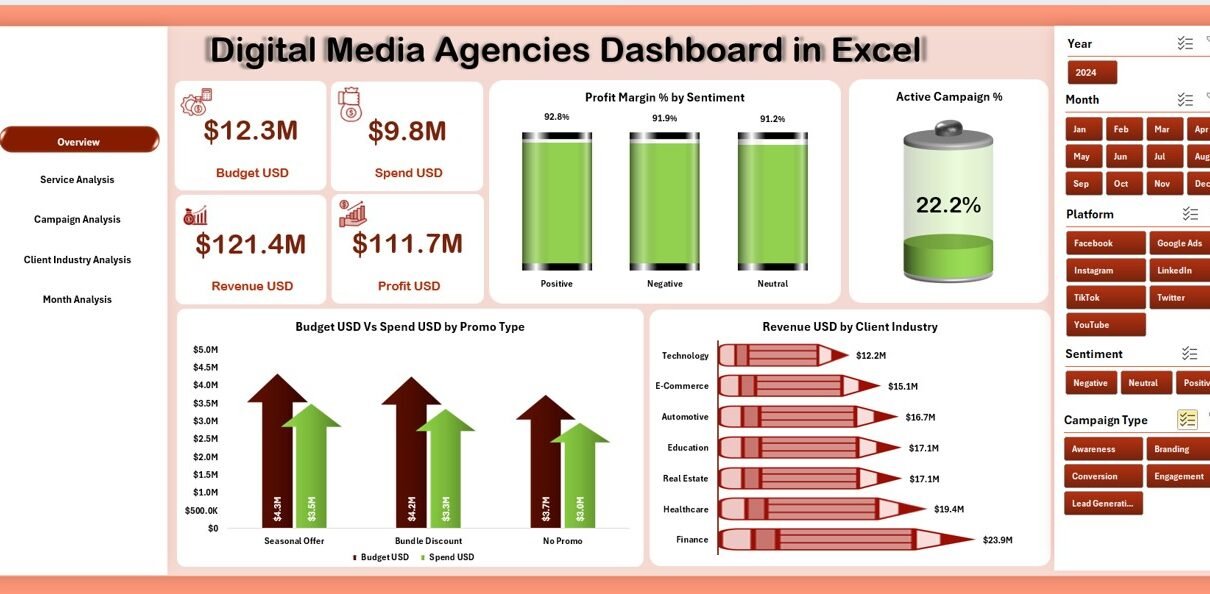
1. Overview Page – What Does It Show?
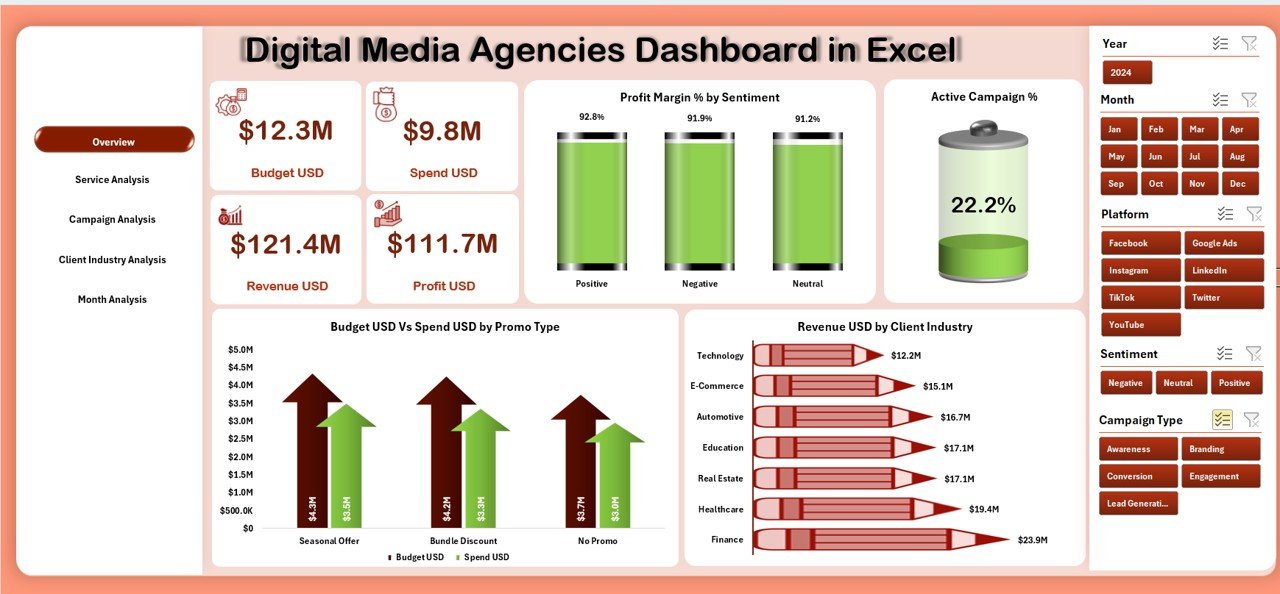
The Overview Page works as the main landing page of the dashboard. It gives a quick snapshot of the agency’s overall performance.
What You See on This Page
-
A right-side slicer
-
Five KPI cards
-
Four important charts
Charts Displayed
-
Profit Margin % by Sentiment
-
Active Campaign %
-
Budget USD vs Spend USD by Promo Type
-
Revenue USD by Client Industry
This page helps you answer questions like:
-
How profitable are campaigns based on sentiment?
-
How many campaigns remain active right now?
-
How is the spend compared to the initial budget?
-
Which industries contribute the most revenue?
This page acts as your quick performance summary.
Click to Purchases Digital Media Agencies Dashboard in Excel
2. Service Analysis – How Well Do Services Perform?
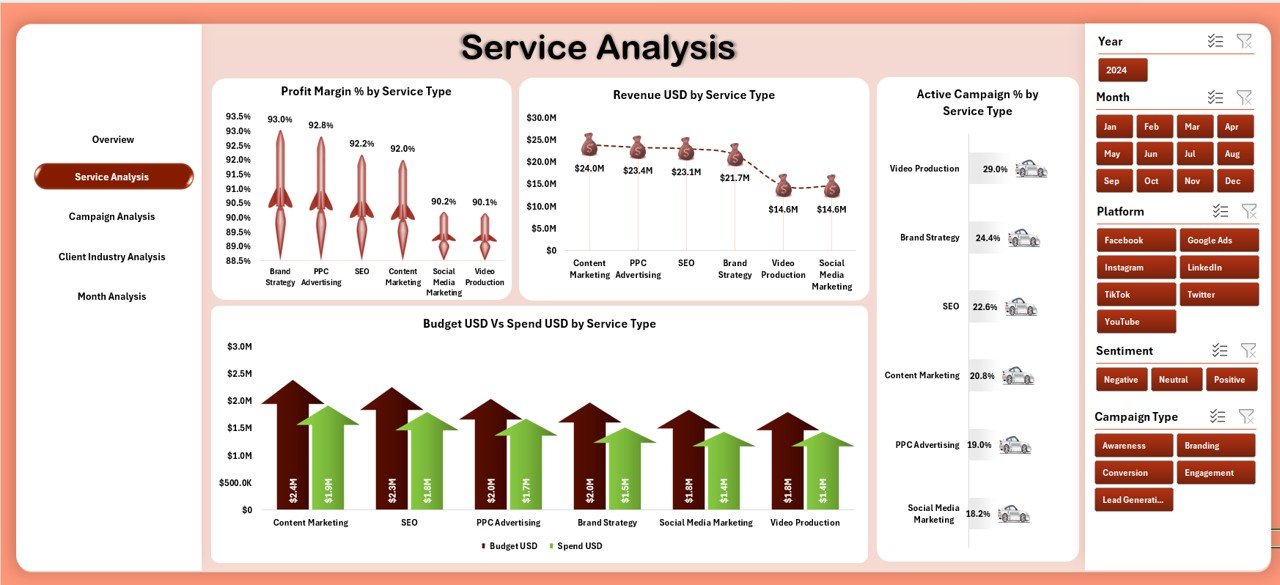
The Service Analysis Page shows performance across different service categories. It also uses a right-side slicer and displays four powerful charts.
Charts Included
-
Profit Margin % by Service Type
-
Revenue USD by Service Type
-
Active Campaign % by Service Type
-
Spend USD by Promo Type and Revenue USD by Service Type
Why This Page Matters
Digital media agencies usually offer multiple services such as:
-
Social media marketing
-
SEO
-
Paid ads
-
Content production
-
Email marketing
-
Influencer promotions
This page helps you compare these services and identify:
-
Which services generate the most revenue
-
Which services attract more campaigns
-
Which services are more profitable
-
Where budget utilization remains strong or weak
Because of these insights, the management team can decide which services need more investment or improvement.
3. Campaign Analysis – Which Campaigns Deliver the Best Results?
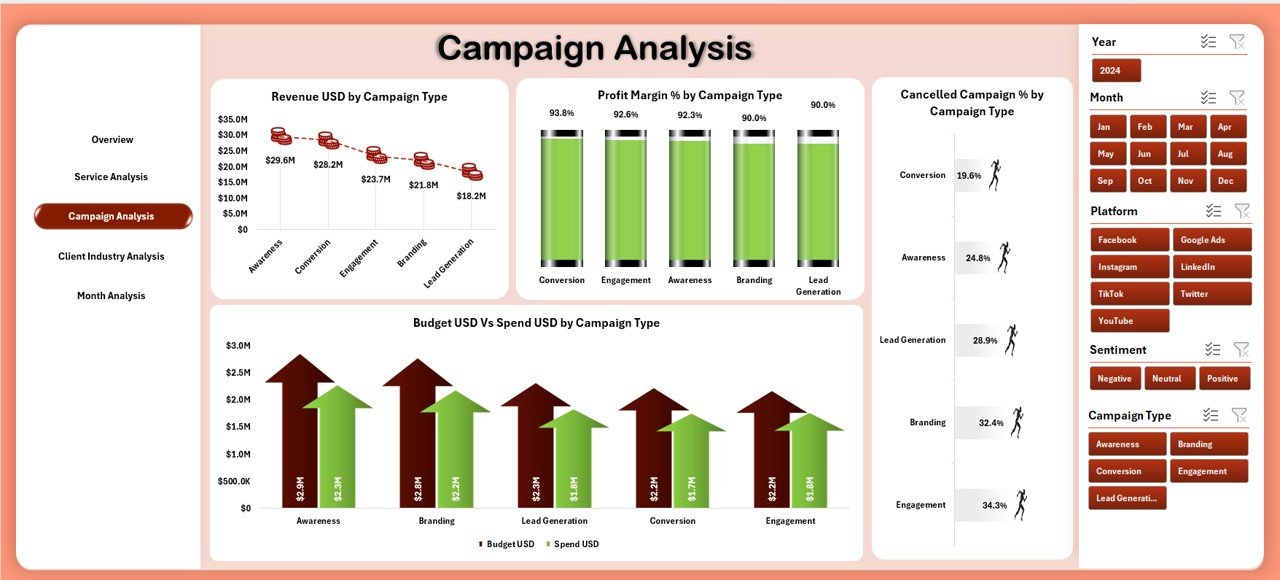
Campaigns form the core of every digital media agency. The Campaign Analysis Page provides deep insights into how each type of campaign performs.
Charts on This Page
-
Profit Margin % by Campaign Type
-
Revenue USD by Campaign Type
-
Cancelled Campaign % by Campaign Type
-
Spend USD by Promo Type and Revenue USD by Campaign Type
What You Learn Here
-
Which campaigns deliver the best profit margins
-
Which ones generate more revenue
-
Which campaigns get canceled more often
-
Which promo type drives higher budgets and spend
-
How campaign categories vary in performance
Because campaign performance directly impacts your clients, this page helps you improve campaign strategies and execution.
4. Client Industry Analysis – Which Industries Perform Better?
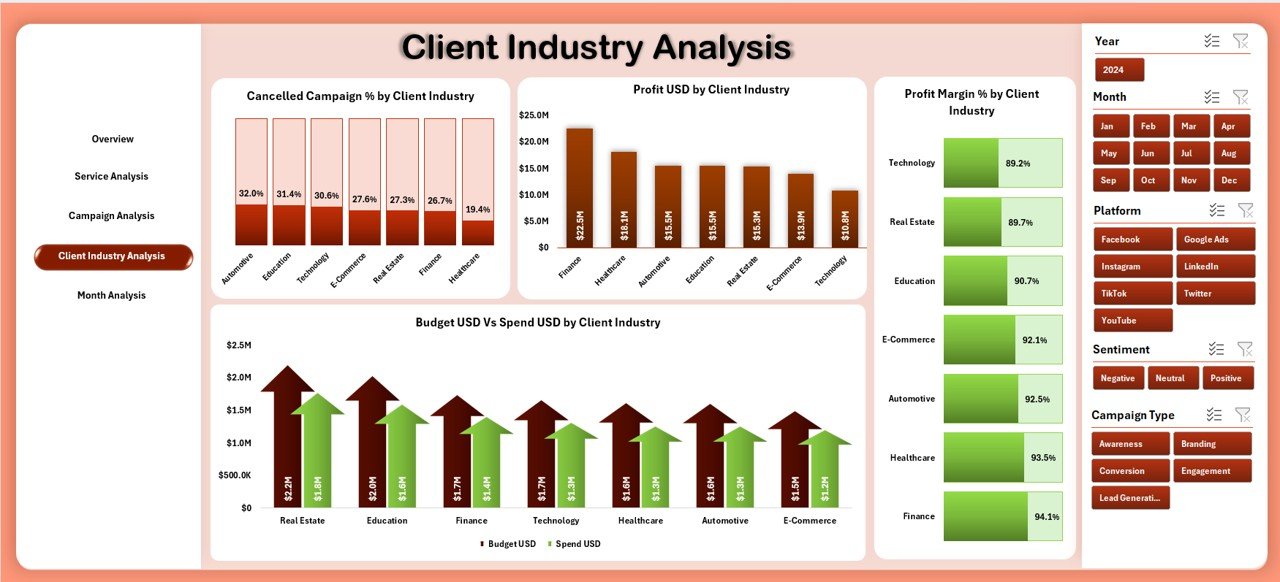
The Client Industry Analysis Page focuses on performance across industries.
Charts on This Page
-
Profit Margin % by Client Industry
-
Cancelled Campaign % by Client Industry
-
Spend USD by Promo Type
-
Revenue USD by Client Industry
-
Profit USD by Client Industry
Insights You Can Gain
-
Which industries bring the highest profits
-
Which industries cancel the most campaigns
-
How budget and spend differ by industry
-
Which industries generate the highest revenue
This information helps agencies plan resources, pricing, and marketing strategies for specific industries.
5. Month Analysis – How Does Performance Change Every Month?
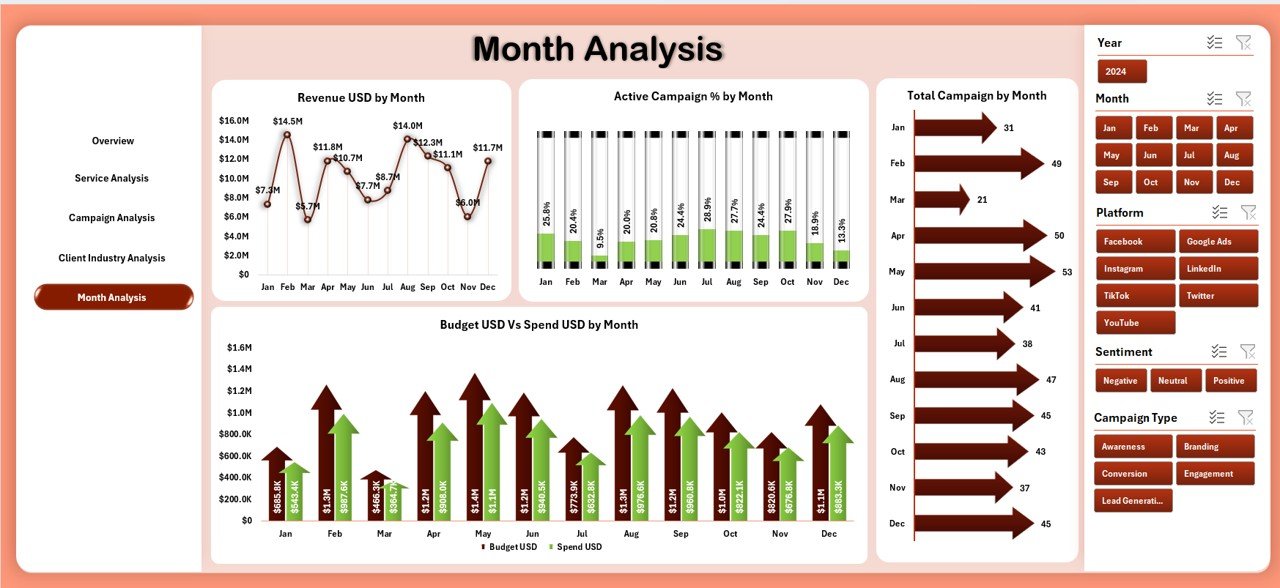
The Month Analysis Page helps you track performance month by month. It uses a right-side slicer for dynamic filtering.
Charts Shown on This Page
-
Revenue USD by Month
-
Active Campaign % by Month
-
Total Campaign Count by Month
-
Budget USD vs Spend USD by Month
Why This Page Is Useful
It helps you understand:
-
Revenue seasonality
-
Monthly campaign workload
-
Fluctuations in budget spend
-
How campaign activity changes across the year
This page makes it easier to plan resources and financials.
Support Sheet – What Does It Contain?
Click to Purchases Digital Media Agencies Dashboard in Excel
The Support Sheet includes calculations, lookups, and other backend elements required to run the dashboard smoothly. You don’t need to edit it unless you are customizing the dashboard.
Data Sheet – Where Does All the Data Go?
The Data Sheet is the heart of the dashboard. You can upload new records or replace existing data. All visuals update automatically when the data changes.
Advantages of the Digital Media Agencies Dashboard in Excel
Easy to Use
The dashboard uses a clean layout and simple controls. You do not need advanced Excel knowledge to use the template.
Real-Time Insights
Charts and KPIs update automatically. You view real-time performance without manual work.
Improved Decision-Making
Managers get insights on:
-
Revenue
-
Profit margins
-
Campaign performance
-
Industry trends
-
Monthly variability
This information supports faster and smarter decisions.
Customizable and Flexible
You can add new services, industries, or promo types. You can also customize layouts or formulas based on your agency’s structure.
Cost-Effective Solution
Excel dashboards cost less than dedicated BI tools. You do not need expensive subscription-based software.
Better Client Reporting
Agencies can use the dashboard to impress clients with clean visuals and well-structured performance updates.
Best Practices for Using the Digital Media Agencies Dashboard in Excel
1. Keep Your Data Sheet Clean
Always remove duplicates and ensure all values stay consistent. Clean data helps the dashboard run smoothly.
2. Refresh the Dashboard Regularly
Refresh your pivot tables and charts after adding new data. This ensures up-to-date reporting.
3. Use Slicers Effectively
Right-side slicers help you drill down into:
-
Client industry
-
Campaign type
-
Service type
-
Month
-
Promo type
Use them to analyze data from different angles.
4. Update Naming Conventions
Maintain standard naming for:
-
Campaign types
-
Service categories
-
Industry names
This makes analysis consistent and accurate.
5. Review Your Budget vs Spend Frequently
Use the Budget vs Spend charts to avoid overspending. This helps agencies control financial performance.
6. Analyze Canceled Campaign Trends
Track canceled campaign percentages to improve client satisfaction and operational efficiency.
7. Monitor Monthly Trends
Use the Month Analysis page to plan:
-
Staffing
-
Budget
-
Campaign volumes
-
Seasonal strategy
Monthly insights help agencies stay prepared for busy or slow months.
8. Customize the Dashboard for Your Needs
Add extra KPIs or pages if your agency has special reporting requirements. Excel allows flexible customization.
Conclusion
A Digital Media Agencies Dashboard in Excel helps agencies track revenue, profit margins, campaign performance, client industries, services, and monthly trends. Because the dashboard uses clear charts, slicers, and automated calculations, it saves hours of reporting time. You gain powerful insights, improve decisions, and enhance client transparency. Whether you run a small digital agency or manage multiple brands, this dashboard gives you complete control over your performance.
Frequently Asked Questions (FAQ)
1. What makes this dashboard useful for digital media agencies?
It provides a complete view of revenue, profit, campaigns, industries, and services in one place. This helps teams make faster decisions.
2. Can beginners use this Excel dashboard?
Yes, the layout stays simple. You only update the data sheet and use filters.
3. Can I customize the dashboard?
Yes, you can modify charts, add KPIs, and change layouts based on your agency’s structure.
4. Does the dashboard support monthly reporting?
Yes, the Month Analysis page shows revenue, campaign count, active percentage, and budget vs spend for every month.
5. How often should I update the data sheet?
You should update it weekly or monthly depending on your reporting cycle.
6. What type of data does the dashboard require?
It uses fields like revenue, spend, profit margin, service type, promo type, campaign type, client industry, and month.
7. Can I use this dashboard for client presentations?
Yes, agencies often use this dashboard to present performance insights to clients in a clean and visual format.
Visit our YouTube channel to learn step-by-step video tutorials
Click to Purchases Digital Media Agencies Dashboard in Excel