In today’s fast-moving digital world, digital media agencies must track performance continuously. Campaign results change daily, client expectations rise constantly, and competition grows stronger every month. Therefore, agencies need a clear, accurate, and centralized performance monitoring system. That is exactly where a Digital Media Agencies KPI Dashboard in Power BI becomes essential.
A Digital Media Agencies KPI Dashboard in Power BI helps agencies monitor critical metrics such as campaign performance, budget utilization, ROI, client delivery efficiency, and team productivity. Instead of managing scattered Excel files and manual reports, agencies gain one interactive, real-time dashboard that supports faster and smarter decisions.
In this detailed article, you will learn what a Digital Media Agencies KPI Dashboard in Power BI is, how it works, its structure, advantages, best practices, opportunities for improvement, and frequently asked questions. The language remains simple, practical, and easy to understand, so both beginners and experienced professionals can benefit.
Click to buy Digital Media Agencies KPI Dashboard in Power BI
What Is a Digital Media Agencies KPI Dashboard in Power BI?
A Digital Media Agencies KPI Dashboard in Power BI is a ready-to-use business intelligence solution designed to track, analyze, and visualize key performance indicators (KPIs) related to digital marketing and media agency operations.
Instead of reviewing raw campaign data manually, this dashboard transforms structured Excel data into interactive visuals, KPI tables, and trend charts. As a result, agency leaders, account managers, analysts, and marketing teams gain instant insights into performance.
Most importantly, Power BI allows agencies to:
- Monitor Month-to-Date (MTD) and Year-to-Date (YTD) performance
- Compare actual vs target results
- Analyze current year vs previous year performance
- Identify underperforming KPIs quickly
Why Do Digital Media Agencies Need a KPI Dashboard?
Digital media agencies manage multiple campaigns, platforms, and clients simultaneously. Therefore, manual reporting becomes slow, error-prone, and inefficient. A KPI dashboard solves these challenges effectively.
Key Reasons Agencies Need a KPI Dashboard
- Campaign performance changes frequently
- Clients expect transparent and data-driven reporting
- Budget tracking requires accuracy
- Management needs real-time insights
- Teams need clarity on targets and results
Because of these reasons, a Digital Media Agencies KPI Dashboard in Power BI becomes a strategic tool rather than just a reporting solution.
How Does the Digital Media Agencies KPI Dashboard in Power BI Work?
The dashboard works using Power BI Desktop as the visualization layer and Excel as the data source. This structure keeps the system simple, flexible, and scalable.
Data Flow Overview
- Enter KPI data in structured Excel sheets
- Power BI reads and refreshes the data
- Visuals update automatically
- Users analyze results using slicers and filters
Since the dashboard relies on Excel inputs, even non-technical users can maintain it easily.
Dashboard Structure: Pages Explained in Detail
The Digital Media Agencies KPI Dashboard in Power BI contains three well-structured pages, each designed for a specific purpose.
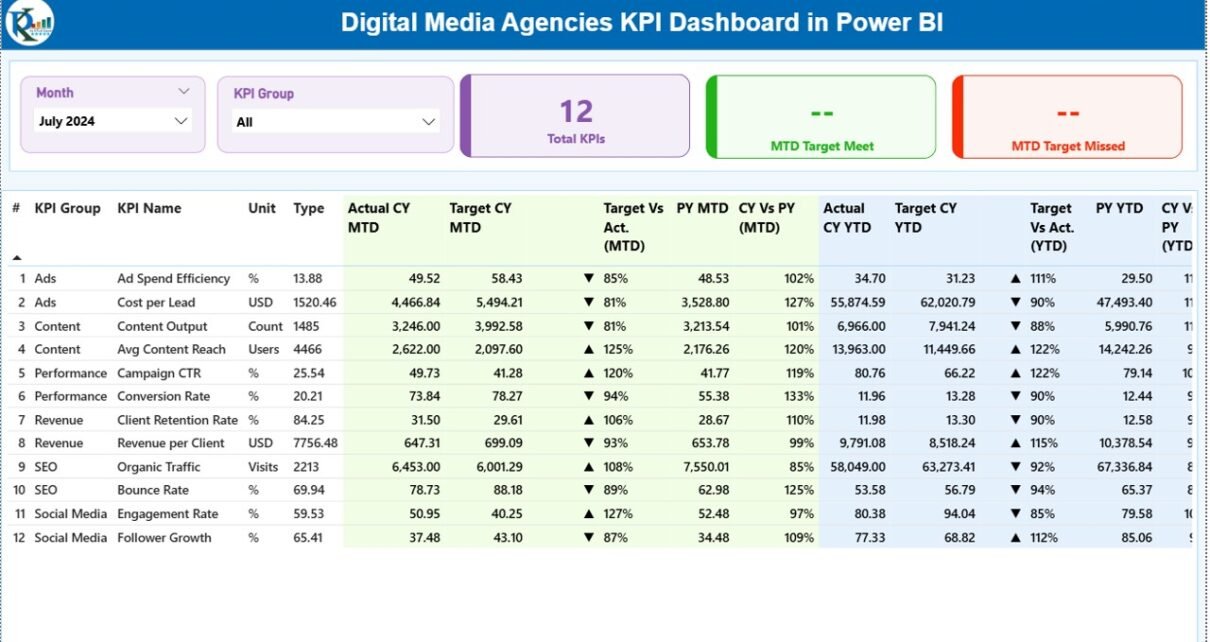
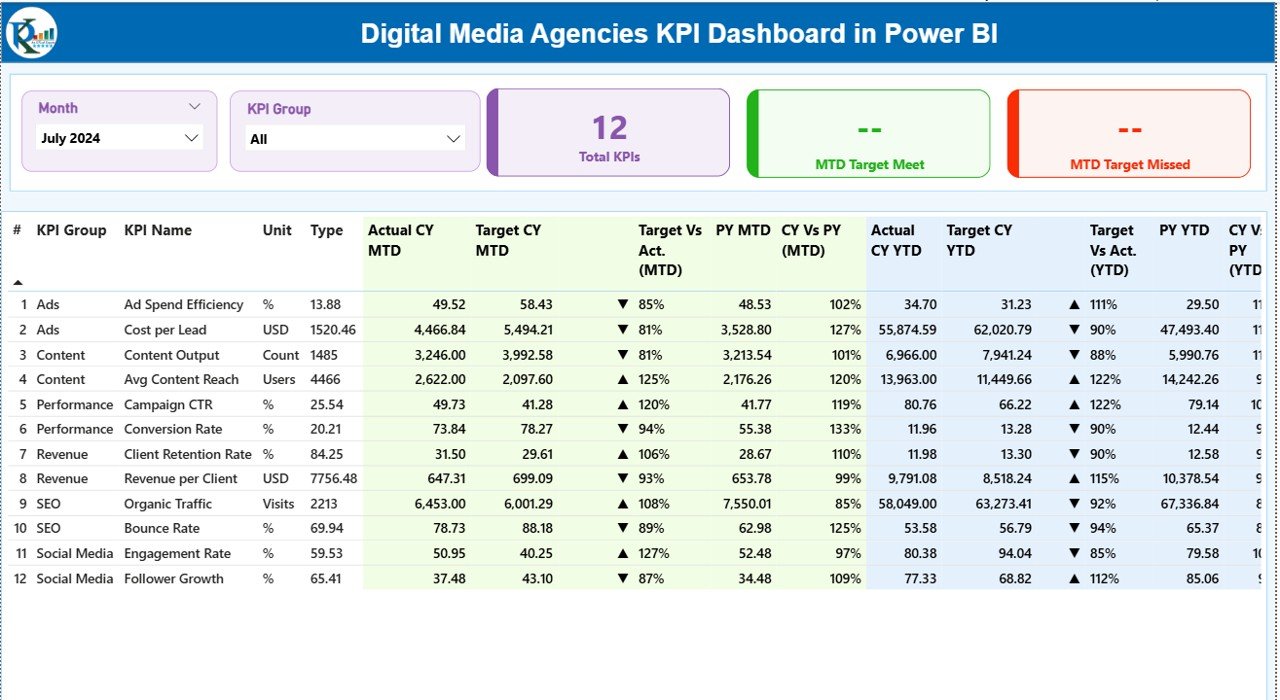
Summary Page – How Does the Summary Page Help Decision-Making?
The Summary Page acts as the control center of the dashboard. It provides a high-level overview of all KPIs in one place.
Key Elements of the Summary Page
Interactive Slicers
- Month Slicer: Select any month to view MTD and YTD performance
- KPI Group Slicer: Filter KPIs by category such as Campaign Performance, Client Management, Finance, or Operations
KPI Cards
- Total KPIs Count
- MTD Target Met Count
- MTD Target Missed Count
These cards immediately highlight overall performance status.
Detailed KPI Table on Summary Page
The KPI table provides deep insights into each metric. Every row represents one KPI, while columns show performance comparisons.
KPI Table Columns Explained
- KPI Number: Unique identifier for each KPI
- KPI Group: Category of the KPI
- KPI Name: Name of the KPI
- Unit: Measurement unit (%, USD, Count, etc.)
- Type:
LTB (Lower the Better)
UTB (Upper the Better)
MTD Performance Columns
- Actual CY MTD: Current year actual MTD value
- Target CY MTD: Current year target MTD value
- MTD Icon:
▲ Green arrow = Target met
▼ Red arrow = Target missed
Target vs Actual (MTD): Actual ÷ Target
- PY MTD: Previous year MTD value
- CY vs PY (MTD): Current year MTD ÷ Previous year MTD
YTD Performance Columns
- Actual CY YTD
- Target CY YTD
- YTD Icon
- Target vs Actual (YTD)
- PY YTD
- CY vs PY (YTD)
This structure ensures complete KPI visibility in one screen.
Click to buy Digital Media Agencies KPI Dashboard in Power BI
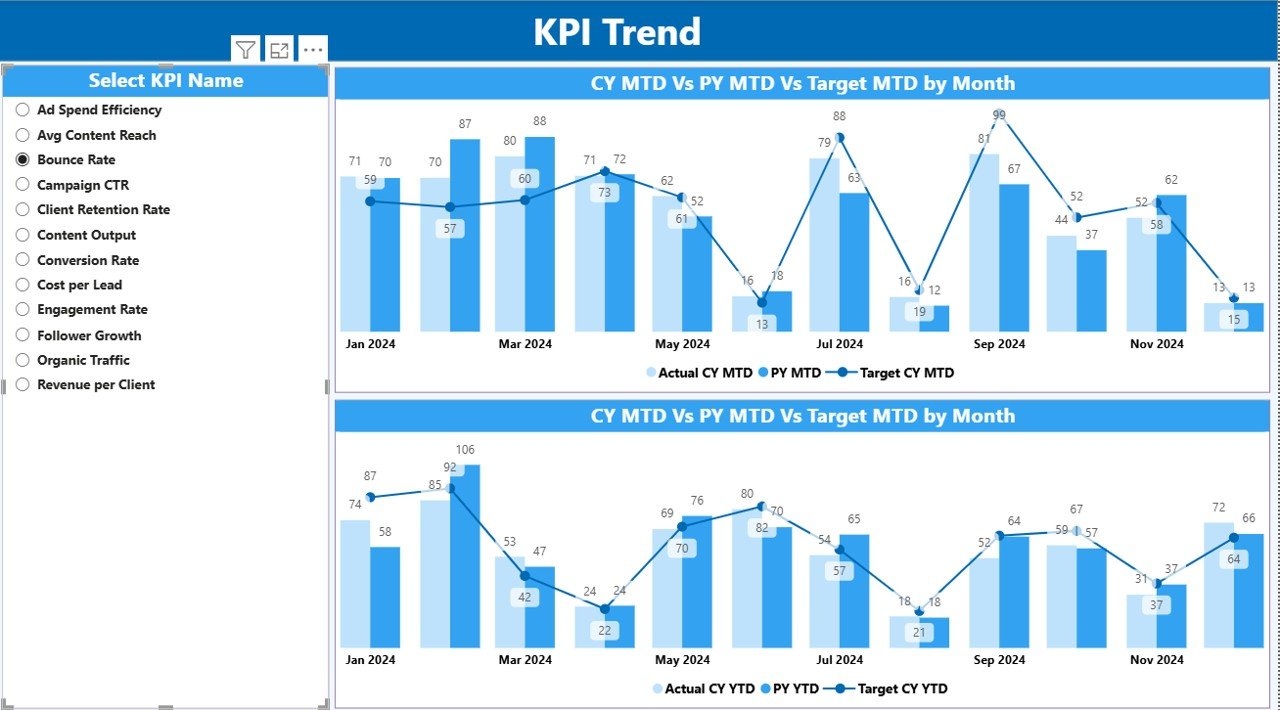
KPI Trend Page – How Can Agencies Track Performance Trends?
The KPI Trend Page focuses on time-based performance analysis.
Key Features of the KPI Trend Page
Two combo charts:
MTD trend (Actual, Target, PY)
YTD trend (Actual, Target, PY)
- KPI Name Slicer on the left side
By selecting a KPI, users instantly view how performance evolves over time. Therefore, trend analysis becomes simple and effective.
Click to buy Digital Media Agencies KPI Dashboard in Power BI
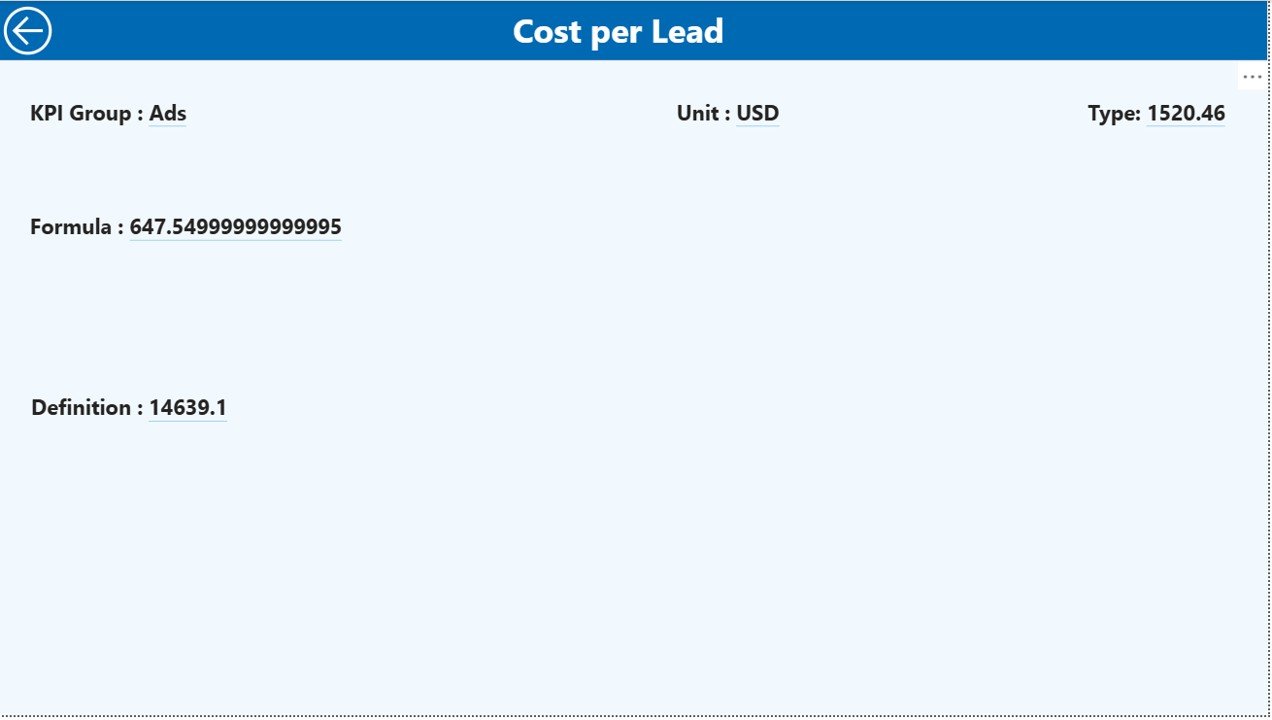
KPI Definition Page – Why Is KPI Transparency Important?
The KPI Definition Page acts as a drill-through page and remains hidden by default.
What Does This Page Show?
- KPI Formula
- KPI Definition
- KPI Type (LTB or UTB)
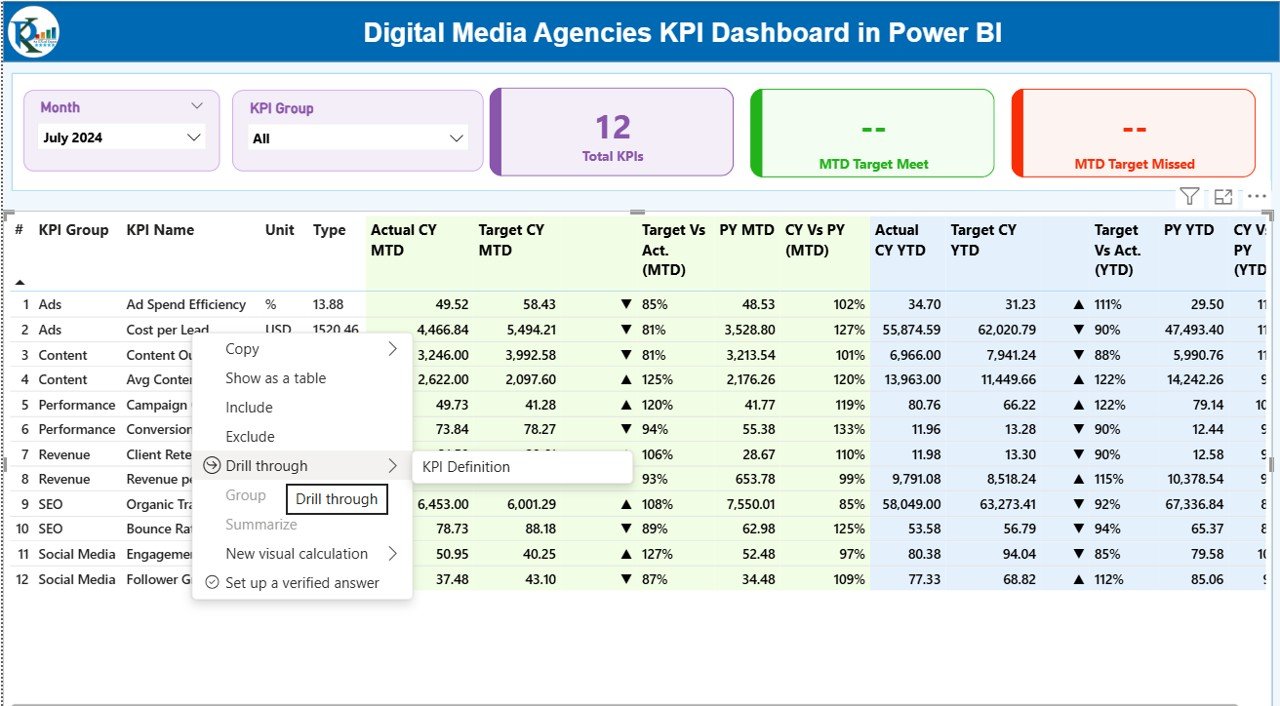
From the Summary Page, users can right-click on any KPI and drill through to see details. This feature improves clarity, alignment, and understanding across teams.
A Back Button on the top-left corner allows easy navigation to the main page.
Click to buy Digital Media Agencies KPI Dashboard in Power BI
Excel Data Structure: How to Maintain the Data Source?
The dashboard uses an Excel file with three worksheets. This design ensures simplicity and control.
Input_Actual Sheet
In this sheet, users enter:
- KPI Name
- Month (first date of the month)
- Actual MTD value
- Actual YTD value
Input_Target Sheet
In this sheet, users enter:
- KPI Name
- Month (first date of the month)
- Target MTD value
- Target YTD value
Click to buy Digital Media Agencies KPI Dashboard in Power BI
KPI Definition Sheet
In this sheet, users define:
- KPI Number
- KPI Group
- KPI Name
- Unit
- Formula
- Definition
- Type (LTB or UTB)
Once users update these sheets, Power BI refreshes the dashboard automatically.
Advantages of Digital Media Agencies KPI Dashboard in Power BI
Using a KPI dashboard delivers measurable benefits to digital media agencies.
✅ Key Advantages
- Centralized KPI Tracking – Monitor all KPIs in one place
- Time Savings – Eliminate manual reporting efforts
- MTD & YTD Visibility – Track short-term and long-term performance
- Target Monitoring – Identify missed targets instantly
- Trend Analysis – Understand performance patterns clearly
- Client Transparency – Improve trust with data-driven reporting
- Excel-Based Input – Easy data maintenance
- Better Decision-Making – Act faster with accurate insights
Opportunities for Improvement in Digital Media Agencies KPI Dashboards
Although the dashboard is powerful, agencies can enhance it further.
Opportunities for Improvement
- Integrate live data from Google Ads, Meta Ads, or Analytics
- Optimize layouts for mobile Power BI apps
- Add client-wise performance drill-downs
- Enable alert-based notifications
- Include weekly performance tracking
- Add predictive analytics using historical data
Best Practices for Digital Media Agencies KPI Dashboard in Power BI
Following best practices ensures long-term dashboard success.
Best Practices
- Define KPIs clearly before building the dashboard
- Use consistent KPI names across Excel sheets
- Maintain accurate month dates (first day of the month)
- Refresh data regularly
- Limit the number of KPIs to what truly matters
- Use LTB and UTB logic correctly
- Train teams on KPI interpretation
- Review targets periodically
Who Can Benefit from This Dashboard?
This dashboard suits various roles within a digital media agency.
Ideal Users
- Agency Owners
- Digital Marketing Managers
- Account Managers
- Performance Analysts
- Finance Teams
- Strategy Teams
Conclusion: Why Should Digital Media Agencies Use a KPI Dashboard in Power BI?
A Digital Media Agencies KPI Dashboard in Power BI transforms complex performance data into clear, actionable insights. It replaces manual reporting with automation, improves visibility, and strengthens decision-making.
Because the dashboard uses Excel inputs and Power BI visuals, it remains flexible, scalable, and user-friendly. Most importantly, it empowers agencies to track performance confidently, meet targets consistently, and deliver better results to clients.
Frequently Asked Questions (FAQs)
What is a Digital Media Agencies KPI Dashboard in Power BI?
A Digital Media Agencies KPI Dashboard in Power BI is an interactive reporting tool that tracks KPIs related to digital marketing agency performance using Power BI visuals and Excel data.
Can beginners use this dashboard?
Yes, beginners can use it easily because data entry happens in Excel, and the dashboard updates automatically.
Which KPIs can digital media agencies track?
Agencies can track campaign performance, ROI, budget utilization, client delivery metrics, productivity KPIs, and financial KPIs.
How often should agencies update the data?
Agencies should update data monthly or more frequently depending on reporting needs.
Does this dashboard support MTD and YTD analysis?
Yes, the dashboard provides both MTD and YTD performance tracking with target and previous-year comparisons.
Can agencies customize KPIs?
Yes, agencies can add, remove, or modify KPIs using the KPI Definition Excel sheet.
Is Power BI Desktop required?
Yes, Power BI Desktop is required to view and modify the dashboard.
Can this dashboard support client reporting?
Yes, agencies can use the dashboard to create transparent and professional client performance reports.
Visit our YouTube channel to learn step-by-step video tutorials
Watch the step-by-step video tutorial:
Click to buy Digital Media Agencies KPI Dashboard in Power BI