Home>Blogs>Dashboard>Digital Transformation KPI Dashboard in Excel>Digital Transformation KPI Dashboard 5
Digital Transformation KPI Dashboard 5
10
Dec 2024
0Comments Off on Digital Transformation KPI Dashboard 5
PK
Meet PK, the founder of PK-AnExcelExpert.com! With over 15 years of experience in Data Visualization, Excel Automation, and dashboard creation. PK is a Microsoft Certified Professional who has a passion for all things in Excel. PK loves to explore new and innovative ways to use Excel and is always eager to share his knowledge with others. With an eye for detail and a commitment to excellence, PK has become a go-to expert in the world of Excel. Whether you're looking to create stunning visualizations or streamline your workflow with automation, PK has the skills and expertise to help you succeed. Join the many satisfied clients who have benefited from PK's services and see how he can take your Excel skills to the next level!
https://www.pk-anexcelexpert.com
Related Articles
Weekly Reflection Evaluation Checklist in Excel
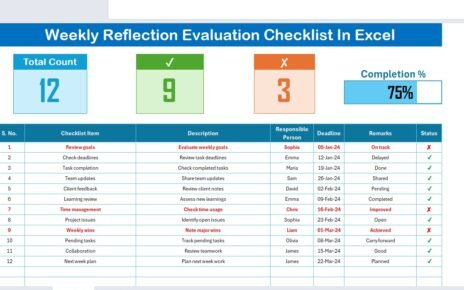
In today’s fast-paced world, it is easy to keep moving forward without stopping to think about what worked and what
Multi-color Data bar with REPT function
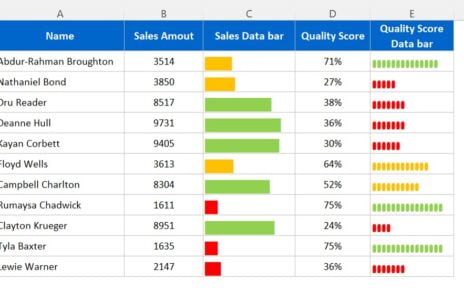
In this article, we have created multi-color Data bar with REPT function in Excel. We have used the conditional formatting
Oncology Services KPI Dashboard in Power BI
Managing oncology services requires absolute clarity, accuracy, and speed in decision-making. Because patient outcomes, treatment quality, and operational efficiency depend


