In today’s fast-moving business world, companies invest heavily in digital tools. However, many leaders still struggle to measure whether those investments truly deliver results. Although organizations launch automation projects, cloud migrations, AI initiatives, and system upgrades, they often fail to track performance in one centralized place.
Therefore, businesses need a structured, measurable, and simple way to monitor digital progress.
That is exactly where a Digital Transformation KPI Scorecard in Excel becomes powerful.
This ready-to-use Excel template helps organizations track, measure, and improve digital transformation initiatives using clear KPIs, structured worksheets, and visual performance indicators.
In this detailed guide, you will learn:
-
What a Digital Transformation KPI Scorecard in Excel is
-
Why organizations need it
-
Complete explanation of all 4 worksheets
-
Important KPIs you should track
-
Advantages of Digital Transformation KPI Scorecard in Excel
-
Best Practices for the Digital Transformation KPI Scorecard
-
Frequently Asked Questions with Answers
Let’s explore everything step by step.
Click to Purchases Digital Transformation KPI Scorecard in Excel
What Is a Digital Transformation KPI Scorecard in Excel?
A Digital Transformation KPI Scorecard in Excel is a structured performance tracking template designed to monitor digital initiatives across departments.
Instead of using multiple disconnected files, you can:
-
Track MTD (Month-To-Date) performance
-
Monitor YTD (Year-To-Date) performance
-
Compare Actual vs Target values
-
Analyze performance trends
-
Evaluate digital initiatives using clear metrics
Moreover, Excel provides flexibility, customization, and ease of use. Therefore, even small and mid-sized companies can implement this scorecard without complex software.
Why Do Businesses Need a Digital Transformation KPI Scorecard?
Many organizations invest in digital transformation. However, they often measure progress loosely. As a result, projects lose direction.
Here’s why you need a KPI scorecard:
1. It Brings Clarity
Without KPIs, digital transformation feels vague. However, when you define measurable metrics, you track progress clearly.
2. It Aligns Teams
Different departments focus on different goals. Therefore, a scorecard ensures everyone works toward shared objectives.
3. It Improves Accountability
When you track actual vs target values, managers take ownership of results.
4. It Supports Data-Driven Decisions
Instead of relying on opinions, leaders analyze real numbers.
5. It Highlights Gaps Early
Visual indicators quickly show underperforming KPIs. As a result, teams can take corrective action faster.
What Are the Worksheets Inside the Digital Transformation KPI Scorecard in Excel?
This ready-to-use template includes 4 powerful worksheets:
-
Scorecard Sheet
-
KPI Trend Sheet
-
Input Data Sheet
-
KPI Definition Sheet
Now, let’s understand each one in detail.
Click to Purchases Digital Transformation KPI Scorecard in Excel
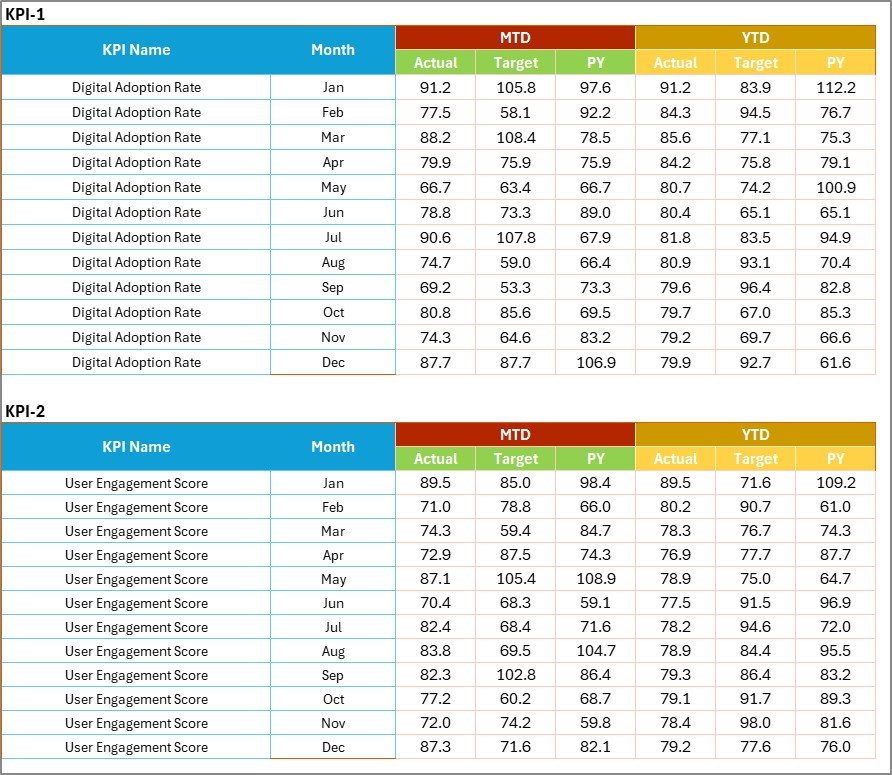
1️⃣ What Is the Scorecard Sheet?
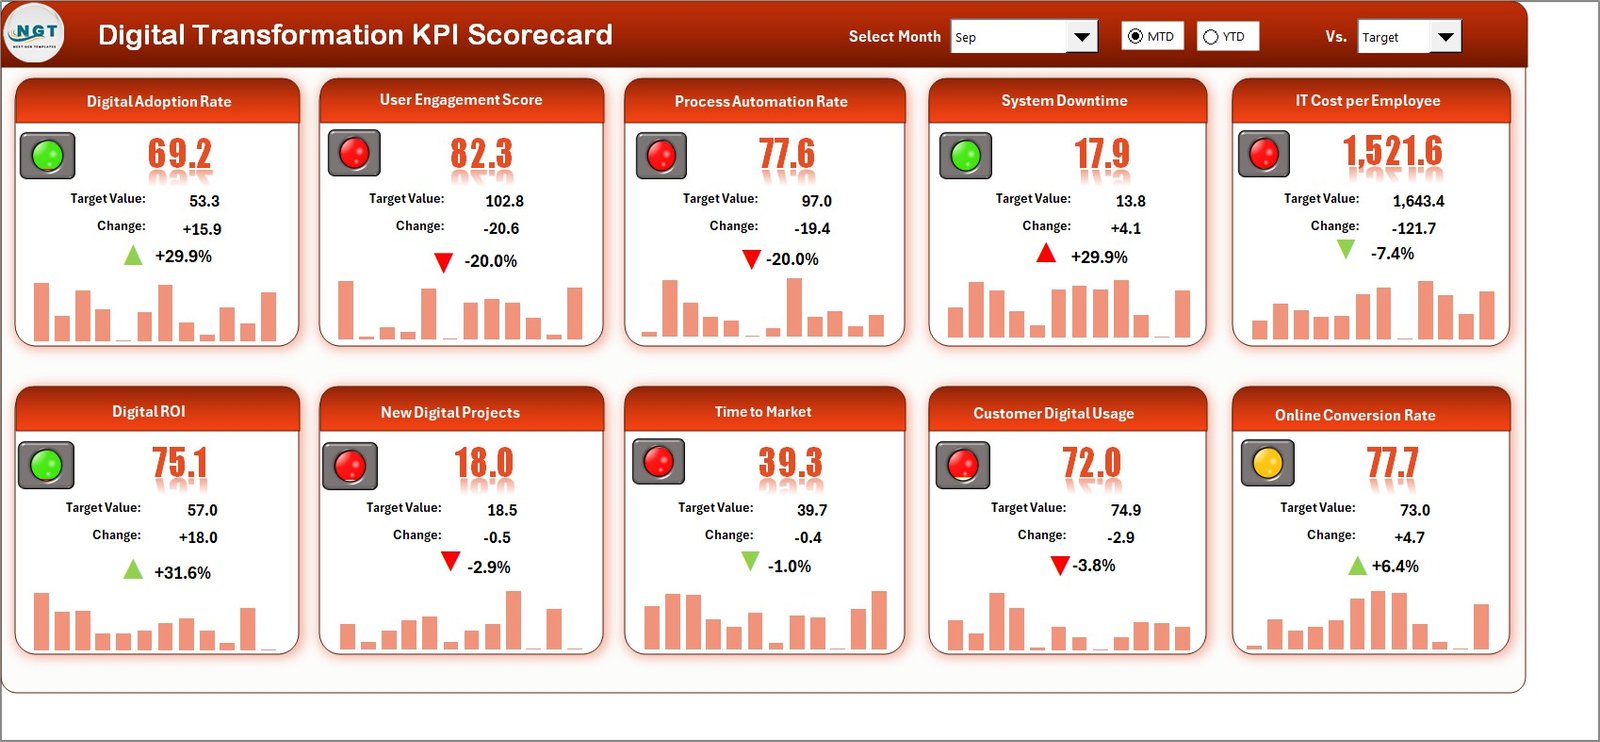
The Scorecard Sheet acts as the main dashboard interface.
Key Features:
-
Dropdown menus to select Month, MTD, or YTD
-
Actual vs Target comparison
-
Conditional formatting indicators
-
Comprehensive KPI overview
How It Works
You select a month from the dropdown. Immediately, the sheet updates all KPI values. Then, you compare:
-
MTD Actual vs Target
-
YTD Actual vs Target
-
Previous Year comparisons (if available)
Furthermore, color-coded visuals help you quickly identify performance:
-
Green = Target achieved
-
Red = Target missed
-
Yellow = Needs attention
Therefore, you instantly understand performance without analyzing complex reports.
2️⃣ What Is the KPI Trend Sheet?
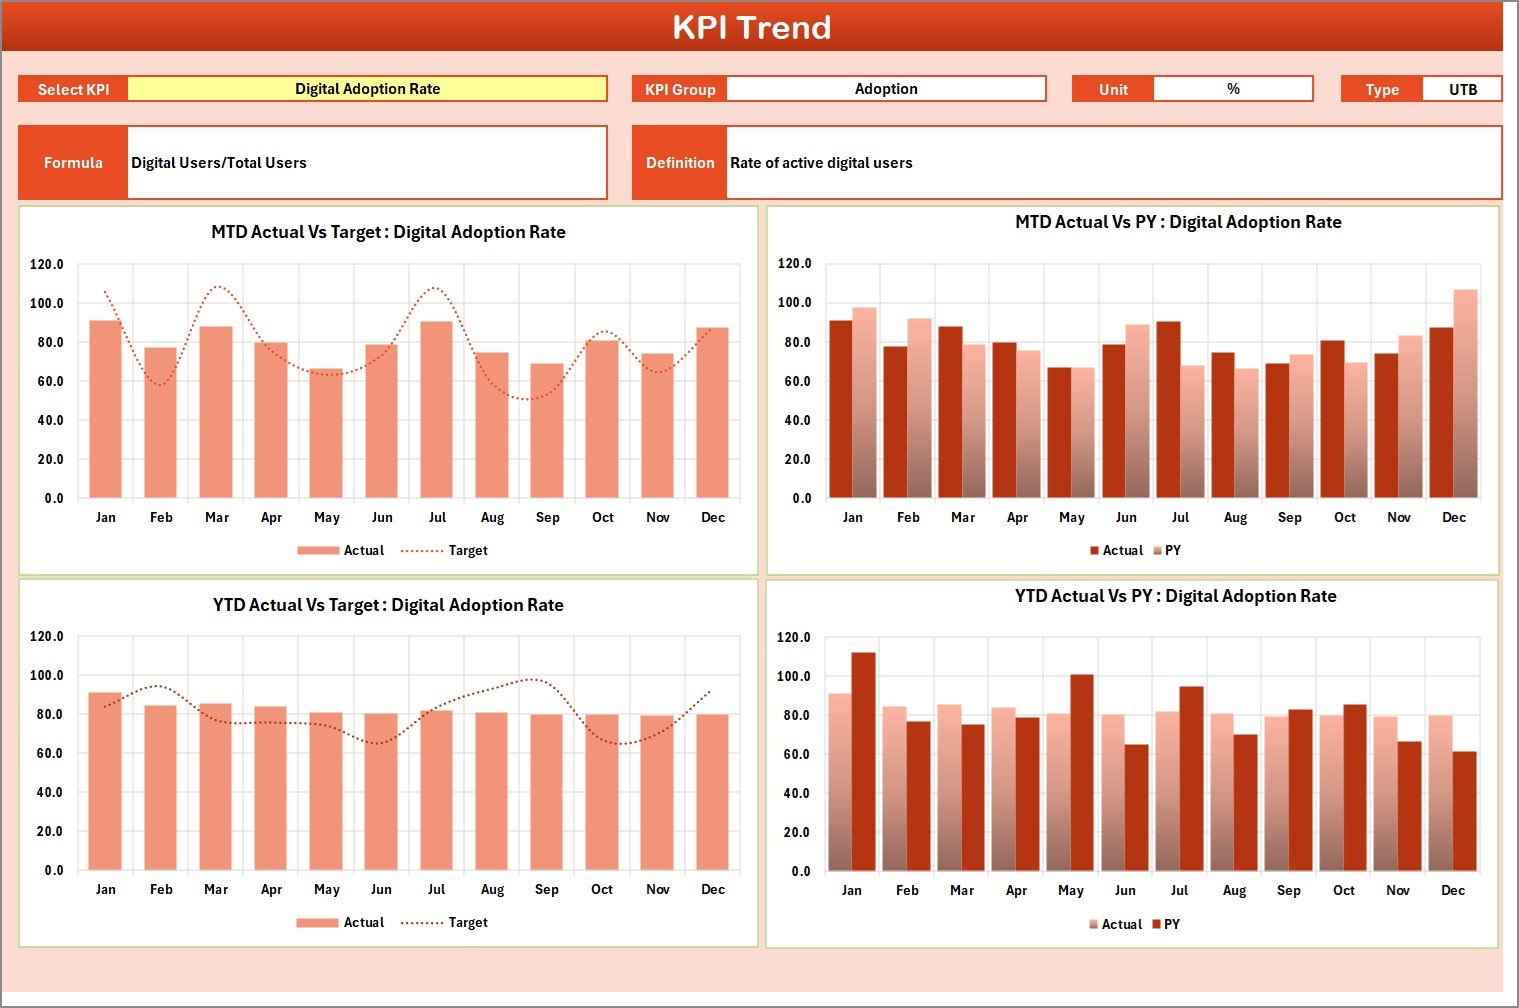
While the scorecard shows summary performance, the KPI Trend Sheet shows detailed historical analysis.
On cell C3, you select the KPI name from a dropdown. After that, the sheet displays:
-
KPI Group
-
Unit of Measurement
-
Type (Lower the Better or Upper the Better)
-
Formula
-
Definition
Moreover, it displays MTD and YTD trend charts for:
-
Actual values
-
Target values
-
Previous Year numbers
Therefore, you not only track performance but also analyze patterns over time.
For example:
-
If system uptime improves month by month, your digital stability improves.
-
If digital adoption rate stagnates, you must improve user training.
Thus, this sheet supports strategic analysis.
Click to Purchases Digital Transformation KPI Scorecard in Excel
3️⃣ What Is the Input Data Sheet?
The Input Data Sheet acts as the data engine.
Here, you:
-
Enter monthly actual values
-
Enter targets
-
Update KPIs regularly
Because this sheet remains flexible, you can update data anytime new results become available.
Moreover, Excel formulas automatically update the scorecard. Therefore, you never manually calculate results.
This structure ensures:
-
Accuracy
-
Consistency
-
Simplicity
4️⃣ What Is the KPI Definition Sheet?
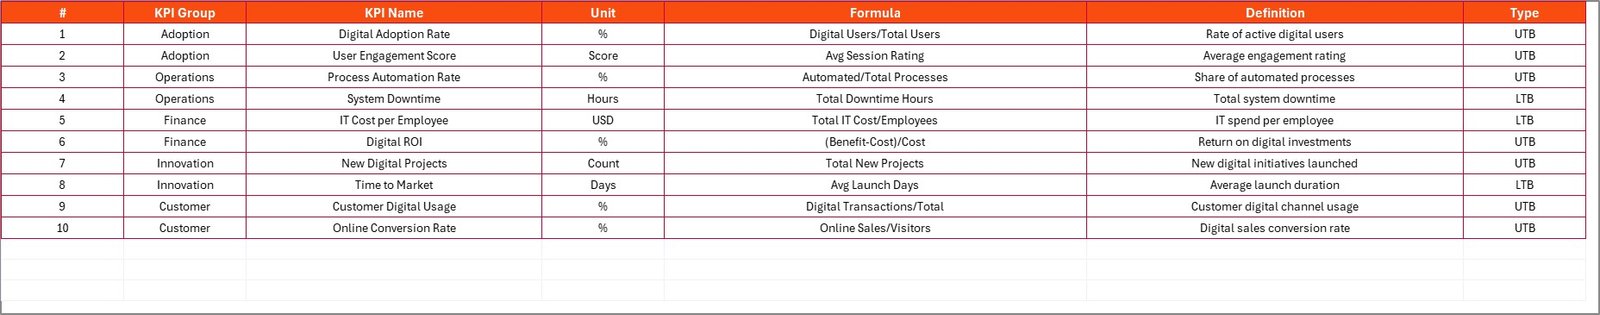
Clarity starts with proper definitions. Therefore, the KPI Definition Sheet plays a critical role.
Here, you define:
-
KPI Name
-
KPI Group
-
Unit
-
Formula
-
Definition
What KPIs Should You Track in Digital Transformation?
You must choose KPIs that reflect real digital progress. Therefore, consider tracking the following:
Technology KPIs
-
System Uptime %
-
Cloud Adoption Rate
-
Cybersecurity Incident Rate
-
Application Response Time
Operational KPIs
-
Process Automation Rate
-
Manual Process Reduction %
-
Digital Workflow Adoption
Financial KPIs
-
IT Cost Reduction %
-
ROI on Digital Projects
-
Cost per Transaction
Customer Experience KPIs
-
Digital Channel Usage %
-
Customer Satisfaction Score
-
Net Promoter Score (NPS)
Employee Adoption KPIs
-
Employee Digital Skill Index
-
Training Completion Rate
-
Tool Usage Frequency
Because digital transformation impacts every department, you must measure performance holistically.
Click to Purchases Digital Transformation KPI Scorecard in Excel
How Does the Scorecard Improve Decision-Making?
First, it provides structured visibility.
Second, it highlights performance gaps.
Third, it supports proactive management.
For example:
If automation rate remains low, you invest in workflow tools.
If cybersecurity incidents increase, you strengthen IT controls.
Therefore, leadership makes faster and smarter decisions.
Advantages of Digital Transformation KPI Scorecard in Excel
Now let’s discuss the major benefits.
1️⃣ Centralized Performance Tracking
Instead of scattered files, you get one structured system.
2️⃣ Easy to Use
Excel remains familiar to most professionals. Therefore, adoption becomes easier.
3️⃣ Real-Time Updates
When you update input data, the scorecard updates instantly.
4️⃣ Visual Clarity
Conditional formatting helps you identify trends quickly.
5️⃣ Flexible Customization
You can:
-
Add new KPIs
-
Modify formulas
-
Change units
-
Update target benchmarks
6️⃣ Cost-Effective Solution
Unlike expensive software, Excel offers a budget-friendly approach.
7️⃣ Improved Accountability
Each KPI has a defined owner and measurable target.
Click to Purchases Digital Transformation KPI Scorecard in Excel
Best Practices for the Digital Transformation KPI Scorecard
To maximize value, follow these best practices:
1️⃣ Define Clear Objectives First
Before creating KPIs, define digital goals clearly.
2️⃣ Limit KPIs to What Matters
Avoid tracking too many metrics. Instead, focus on impact-driven KPIs.
3️⃣ Update Data Consistently
Enter monthly data on time to maintain accuracy.
4️⃣ Review Performance Regularly
Conduct monthly review meetings using the scorecard.
5️⃣ Align KPIs with Business Strategy
Ensure every KPI connects with strategic objectives.
6️⃣ Use Both MTD and YTD Views
MTD shows short-term performance.
YTD shows long-term progress.
7️⃣ Train Teams to Interpret Data
Data alone does not help. However, interpretation drives action.
How to Implement the Digital Transformation KPI Scorecard Successfully?
Follow these steps:
-
Identify transformation initiatives
-
Define measurable KPIs
-
Set realistic targets
-
Input baseline data
-
Monitor trends monthly
-
Take corrective action
-
Review strategy quarterly
Because digital transformation remains ongoing, continuous monitoring ensures long-term success.
Conclusion
Digital transformation drives modern business growth. However, without measurable KPIs, transformation efforts lose direction.
A Digital Transformation KPI Scorecard in Excel provides:
-
Structure
-
Clarity
-
Accountability
-
Real-time visibility
Moreover, it empowers leaders to track performance, analyze trends, and drive improvement.
Therefore, if you want to manage digital initiatives effectively, you must implement a KPI scorecard today.
Click to Purchases Digital Transformation KPI Scorecard in Excel
Frequently Asked Questions with Answers
1. What is a Digital Transformation KPI Scorecard?
It is an Excel-based template that tracks digital transformation performance using structured KPIs.
2. Why should companies use Excel for KPI tracking?
Excel provides flexibility, affordability, and customization without complex tools.
3. What is the difference between MTD and YTD?
MTD shows Month-To-Date performance.
YTD shows Year-To-Date performance.
4. How many KPIs should a company track?
Most organizations track between 10 to 20 key KPIs. However, focus on quality rather than quantity.
5. Can small businesses use this scorecard?
Yes. Because Excel remains easy to use, small businesses can implement it quickly.
6. How often should we update the scorecard?
Update it monthly. Additionally, review it quarterly for strategic adjustments.
7. What type of KPIs work best for digital transformation?
KPIs related to automation, adoption, cost savings, customer experience, and system performance work best.
Click to Purchases Digital Transformation KPI Scorecard in Excel
Visit our YouTube channel to learn step-by-step video tutorials