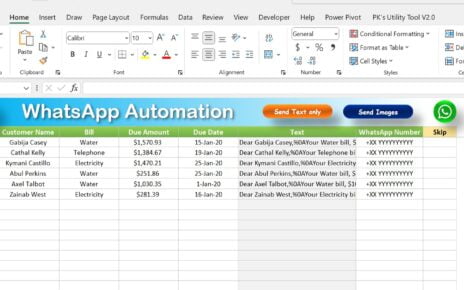
Do you work with WhatsApp regularly and want to send bulk WhatsApp messages quickly and easily? Then You will love
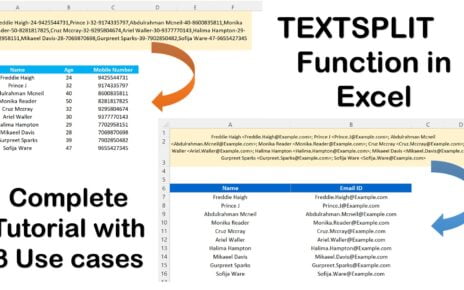
TEXTSPLIT is extremely useful function in Excel. We use it to split text by using column and row delimiters in
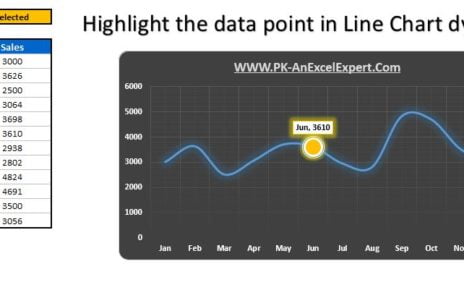
In this chart we have explained how to Highlight the Specific data point in a Line Chart Dynamically. You can