Duty-free retail operates in a fast-moving, high-value environment. Because customer traffic fluctuates daily, margins vary by product and region, and costs remain tightly controlled, decision-makers need instant visibility into performance. However, many duty-free retailers still rely on scattered Excel files, delayed reports, and manual calculations. As a result, teams lose time, miss trends, and react too late.
That is exactly why the Duty-Free Retail Dashboard in Excel becomes a powerful solution.
In this detailed and SEO-friendly guide, you will learn what a Duty-Free Retail Dashboard in Excel is, why it matters, how it works, its page-wise structure, advantages, best practices, and frequently asked questions. Moreover, this article uses clear language, smooth transitions, and practical explanations so you can implement it confidently.
Click to Purchases Duty-Free Retail Dashboard in Excel
What Is a Duty-Free Retail Dashboard in Excel?
A Duty-Free Retail Dashboard in Excel is a ready-to-use analytical tool designed to track sales, costs, profits, and margins across duty-free retail operations.
Instead of managing multiple sheets for stores, regions, customer types, and months, this dashboard consolidates everything into one interactive Excel file. Consequently, managers, finance teams, and retail heads gain instant clarity.
Why Excel for Duty-Free Retail Analytics?
Excel remains a preferred tool because:
-
It is widely available and easy to use
-
It supports charts, slicers, and calculations
-
It allows quick customization without coding
-
It works well for small and mid-size retail operations
Therefore, Excel becomes a practical choice for duty-free retailers who want insights without heavy BI investments.
Why Do Duty-Free Retailers Need a Dashboard?
Duty-free retail faces unique challenges. However, a dashboard addresses them effectively.
Common Challenges Without a Dashboard
-
Sales data spread across multiple files
-
Manual profit and margin calculations
-
Delayed monthly or quarterly reporting
-
Limited visibility by region or customer type
-
Difficulty comparing store categories
Because of these issues, leadership struggles to take timely actions.
How a Dashboard Solves These Problems
A Duty-Free Retail Dashboard in Excel:
-
Centralizes all retail data
-
Automates calculations
-
Visualizes trends instantly
-
Highlights profit drivers and cost leakages
-
Supports faster and smarter decisions
As a result, teams move from reactive reporting to proactive management.
Key Features of the Duty-Free Retail Dashboard in Excel
This dashboard comes with a clean structure, interactive filters, and business-ready visuals.
Page Navigator for Easy Access
The Page Navigator, located on the left side, allows users to move quickly between different analysis pages. Because navigation stays intuitive, users save time and stay focused.
Right-Side Slicers for Dynamic Analysis
Each page includes right-side slicers, which allow filtering by key dimensions such as region, store category, customer type, or month. Therefore, users can analyze performance instantly without changing formulas.
Page-Wise Structure of the Duty-Free Retail Dashboard in Excel
This dashboard includes five analytical pages, each designed for a specific business purpose.
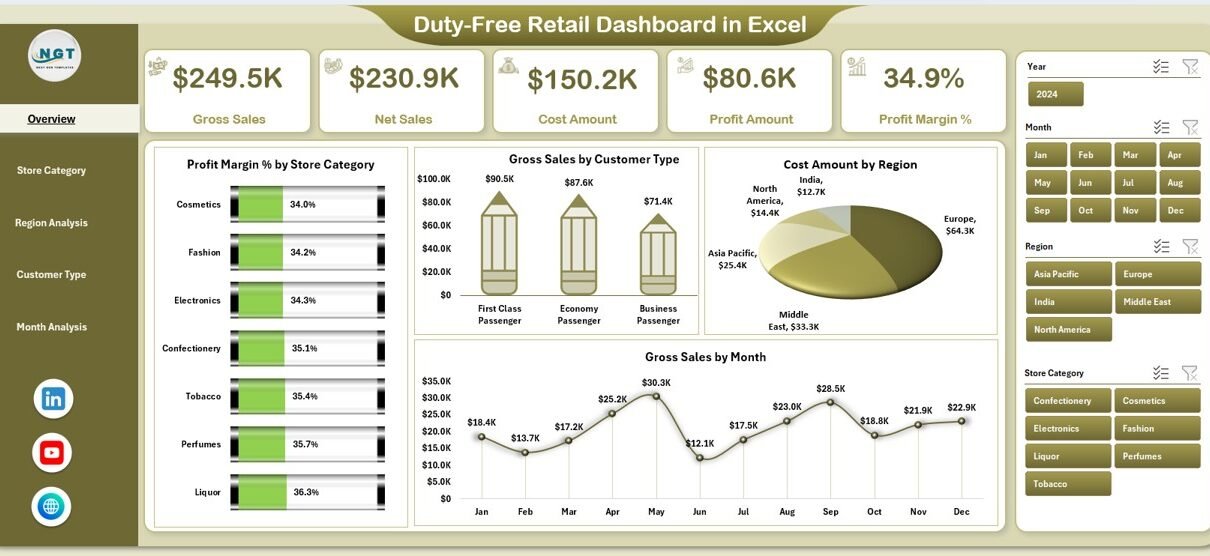
1. Overview Page: How Is Overall Performance Tracking Done?
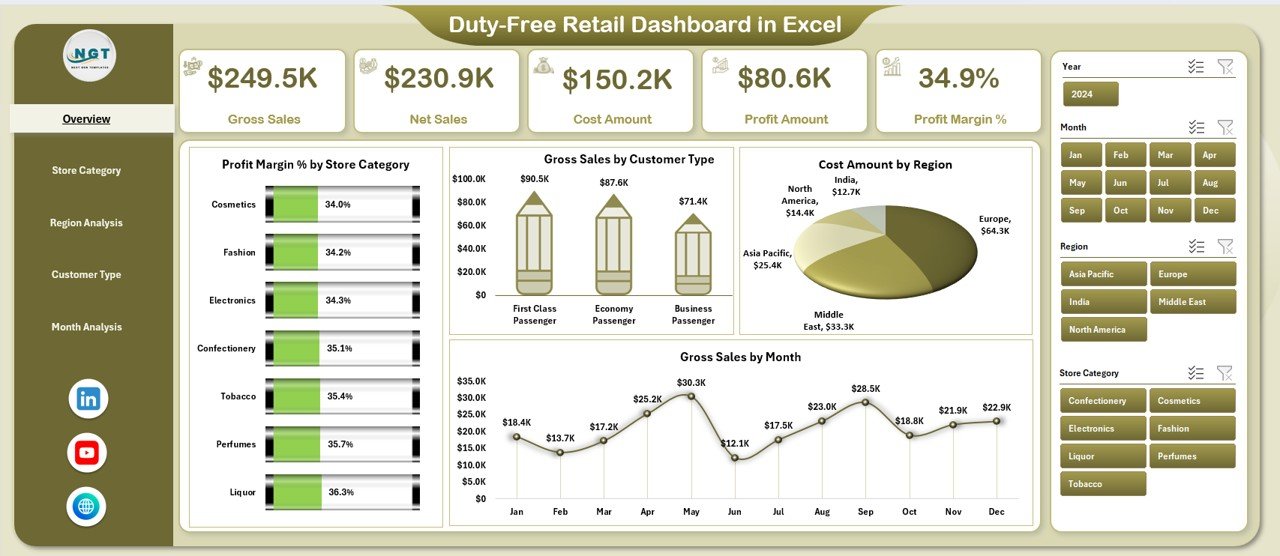
The Overview Page acts as the command center of the dashboard.
Key KPI Cards on the Overview Page
The dashboard displays four KPI cards, which give instant performance snapshots:
-
Profit Margin %
-
Gross Sales
-
Net Sales
-
Cost Amount
Because these KPIs update automatically, decision-makers always see the latest picture.
Charts on the Overview Page
This page includes four powerful charts:
-
Profit Margin % by Store Category – Identifies high-margin product groups
-
Gross Sales by Customer Type – Shows who drives revenue
-
Cost Amount by Region – Highlights cost-heavy regions
-
Gross Sales by Month – Reveals seasonality and trends
As a result, leadership understands performance at a glance.
2. Store Category Analysis: Which Categories Drive Profit?
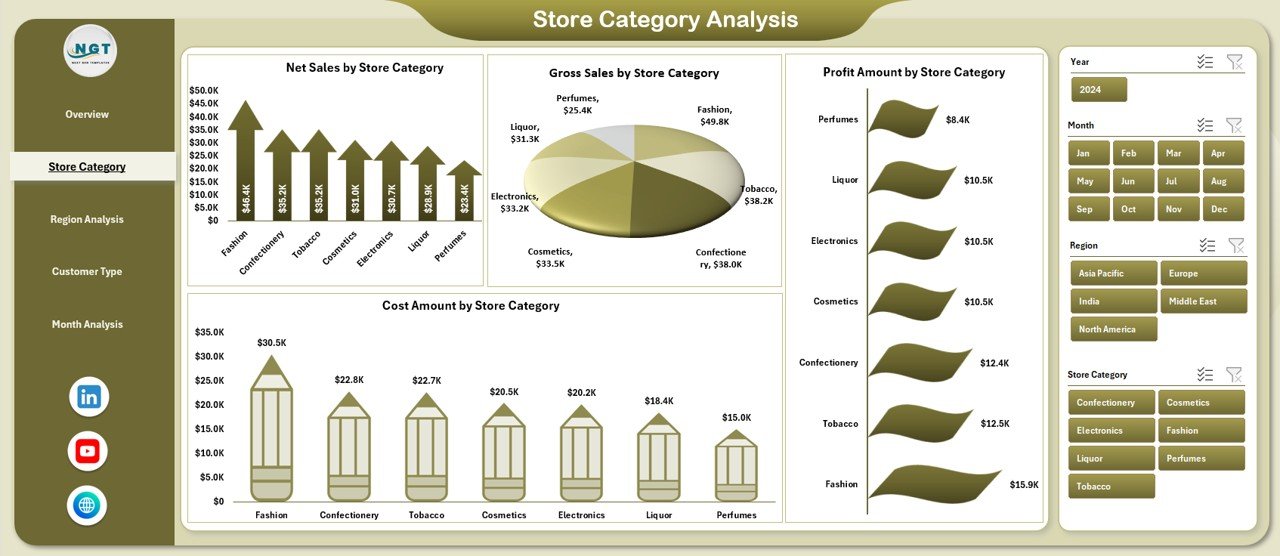
The Store Category Analysis page focuses on category-level performance.
Why Store Category Analysis Matters
Different duty-free categories such as liquor, perfumes, cosmetics, or tobacco perform differently. Therefore, category-wise visibility becomes essential.
Charts on the Store Category Analysis Page
This page includes four charts:
-
Net Sales by Store Category
-
Gross Sales by Store Category
-
Profit Amount by Store Category
-
Cost Amount by Store Category
Because all charts respond to slicers, users can compare categories easily.
Click to Purchases Duty-Free Retail Dashboard in Excel
3. Region Analysis: Which Regions Perform Best?
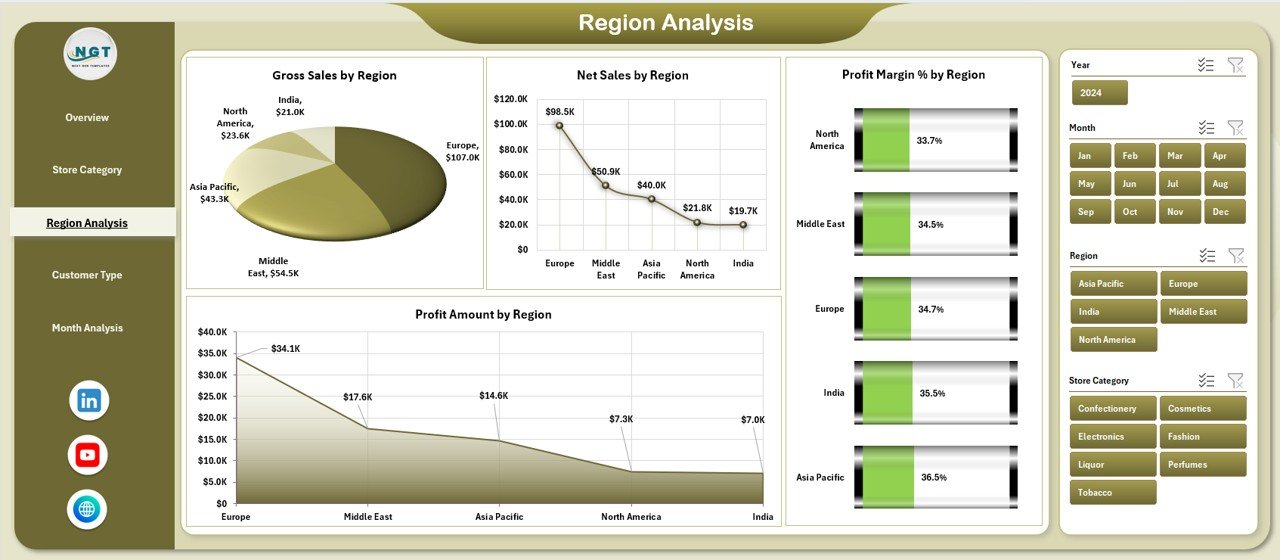
The Region Analysis page helps retailers understand geographic performance.
Importance of Region-Wise Analysis
Duty-free performance varies by airport, country, or travel hub. Therefore, regional insights drive better expansion and cost control decisions.
Charts on the Region Analysis Page
This page contains four charts:
-
Gross Sales by Region
-
Net Sales by Region
-
Profit Margin % by Region
-
Profit Amount by Region
With these visuals, managers identify strong and weak regions quickly.
4. Customer Type Analysis: Who Are Your Most Profitable Customers?
The Customer Type Analysis page focuses on traveler segments.
Why Customer Type Matters in Duty-Free Retail
Different travelers spend differently. For example, business travelers and leisure tourists show different buying behavior.
Charts on the Customer Type Analysis Page
This page includes four charts:
-
Net Sales by Customer Type
-
Cost Amount by Customer Type
-
Profit Margin % by Customer Type
-
Profit Amount by Customer Type
Because insights stay visual, marketing and sales teams align strategies effectively.
5. Month Analysis: How Does Performance Change Over Time?
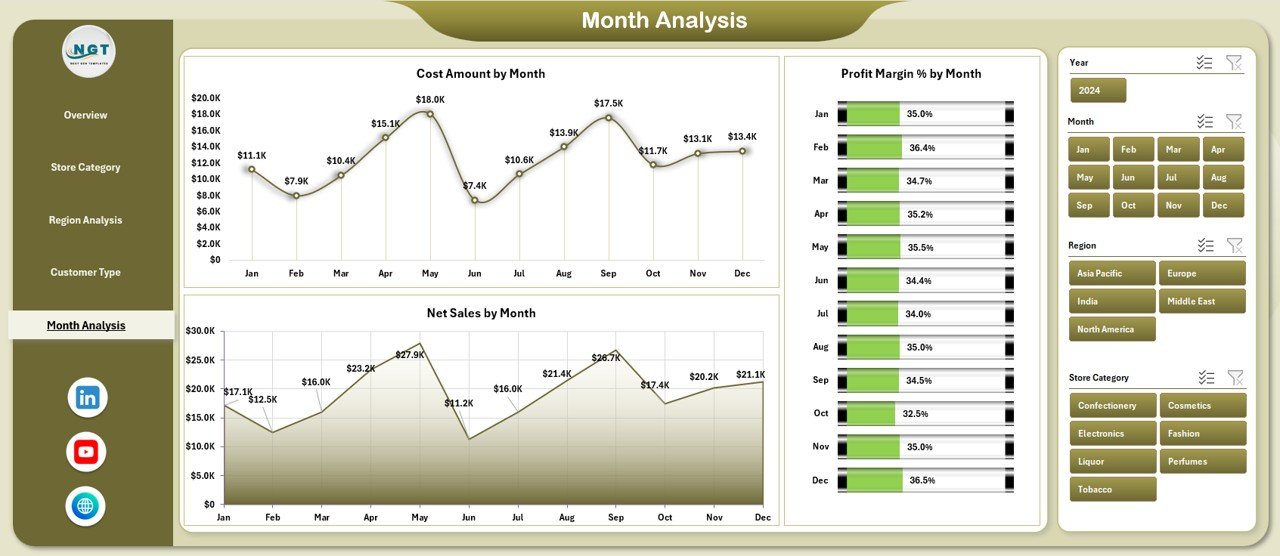
The Month Analysis page focuses on time-based trends.
Importance of Monthly Analysis
Seasonality plays a major role in duty-free retail. Therefore, monthly tracking supports inventory and staffing decisions.
Charts on the Month Analysis Page
This page includes three charts:
-
Net Sales by Month
-
Cost Amount by Month
-
Profit Margin % by Month
As a result, teams identify peak and low seasons accurately.
What Are the Support Sheet and Data Sheet Used For?
Click to Purchases Duty-Free Retail Dashboard in Excel
Support Sheet
The Support Sheet stores helper calculations, lookup tables, and backend logic. Because users rarely interact with it, the dashboard remains clean.
Data Sheet
The Data Sheet acts as the single source of truth. Users update raw transaction data here, and the dashboard refreshes automatically. Therefore, reporting stays fast and reliable.
Advantages of Duty-Free Retail Dashboard in Excel
A well-designed dashboard delivers measurable benefits.
Key Advantages
-
Improves visibility into sales, cost, and profit
-
Reduces manual reporting effort
-
Supports faster decision-making
-
Highlights profitable store categories and regions
-
Enhances financial control and accountability
Because of these advantages, retailers gain a competitive edge.
How Does This Dashboard Improve Decision-Making?
Decision-making improves because:
-
KPIs update instantly
-
Trends become visual
-
Performance gaps stand out clearly
-
Data stays centralized and consistent
As a result, leaders act with confidence instead of assumptions.
Best Practices for the Duty-Free Retail Dashboard in Excel
To get maximum value, follow these best practices.
1. Maintain Clean and Accurate Data
Always update the Data Sheet with validated numbers. Clean data ensures reliable insights.
2. Use Slicers Strategically
Apply slicers to explore specific regions, categories, or months. This approach reveals hidden trends.
3. Review the Overview Page Daily
Daily checks help identify sudden changes in sales or margins.
4. Compare Profit, Not Just Sales
High sales do not always mean high profit. Therefore, always track margins and profit amounts.
5. Update Data on a Fixed Schedule
Weekly or monthly updates keep insights fresh and relevant.
Who Can Use the Duty-Free Retail Dashboard in Excel?
This dashboard suits multiple roles:
-
Duty-free store managers
-
Retail finance teams
-
Airport retail operators
-
Business analysts
-
Sales and marketing leaders
Because Excel remains familiar, adoption stays easy.
How Does This Dashboard Support Business Growth?
The dashboard supports growth by:
-
Identifying profitable categories
-
Highlighting strong regions
-
Understanding customer behavior
-
Improving cost control
-
Supporting data-driven expansion
Therefore, growth becomes structured and sustainable.
Common Mistakes to Avoid While Using Retail Dashboards
Avoid these mistakes to protect data quality:
-
Ignoring data validation
-
Overloading charts with too many metrics
-
Not reviewing margins regularly
-
Using outdated data
By avoiding these errors, users maintain dashboard accuracy.
How Customizable Is the Duty-Free Retail Dashboard in Excel?
Excel dashboards remain highly flexible. Users can:
-
Add new KPIs
-
Include more charts
-
Modify slicers
-
Change layouts
-
Extend data tables
As business needs evolve, the dashboard evolves too.
Conclusion: Why Duty-Free Retail Dashboard in Excel Is a Must-Have Tool
The Duty-Free Retail Dashboard in Excel transforms raw retail data into actionable insights. Because it combines simplicity, flexibility, and visual clarity, it empowers retailers to track performance, control costs, and grow profits confidently.
Instead of spending hours on manual reports, teams focus on analysis and action. Therefore, this dashboard becomes not just a reporting tool, but a strategic asset.
Frequently Asked Questions (FAQs)
1. What data is required for the Duty-Free Retail Dashboard in Excel?
You need sales, cost, profit, region, store category, customer type, and month-wise data.
2. Can beginners use this dashboard?
Yes. The dashboard uses simple Excel features, so beginners can use it easily.
3. Does the dashboard update automatically?
Yes. Once you update the Data Sheet, all charts and KPIs refresh automatically.
4. Can I add more pages or KPIs?
Absolutely. Excel allows easy customization based on business needs.
5. Is this dashboard suitable for multiple stores?
Yes. You can include multiple stores and analyze them using slicers.
6. How often should data be updated?
Weekly or monthly updates work best, depending on reporting needs.
7. Does this dashboard support decision-making?
Yes. Clear visuals, KPIs, and trends help leaders make faster and better decisions.
Visit our YouTube channel to learn step-by-step video tutorials