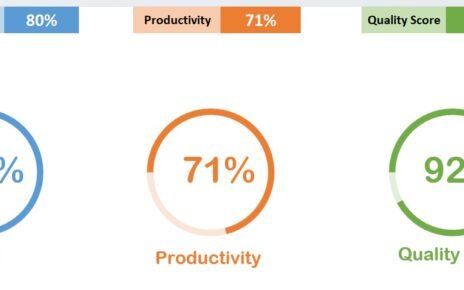
Keeping track of project status or Key Performance Indicators (KPIs) such as service level, productivity, or quality score is a
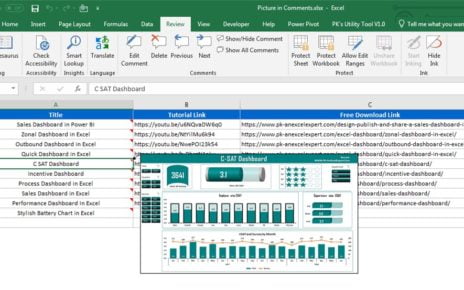
In this article, you will learn how to insert a picture in comments. Here I have taken the example for
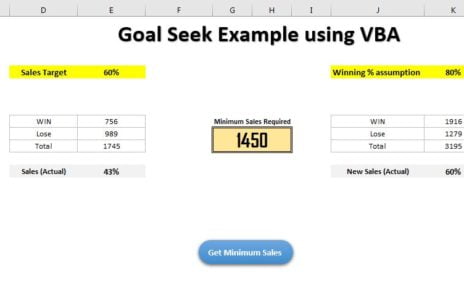
In this article, we have used a Goal Seek to get required minimum sales to meet the Sales % target