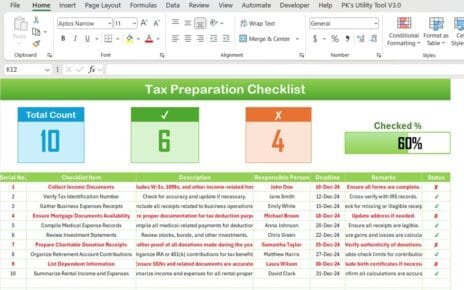
Preparing taxes doesn’t have to feel overwhelming. With a well-organized checklist, the entire process becomes much simpler and easier to
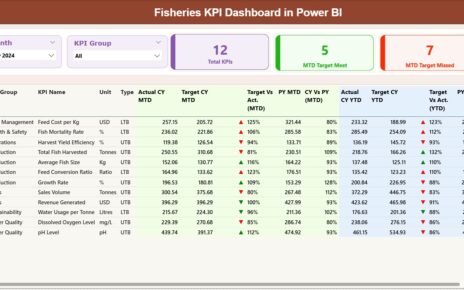
The fisheries sector depends on accurate tracking, daily monitoring, and fast decision-making. From fish stock levels and catch volumes to
Managing finance and accounting data often feels overwhelming. Revenue, expenses, assets, liabilities, taxes, invoices, and trends keep changing every month.