
E-sports KPI Scorecard — Ready-to-Use Template
The E-sports KPI Scorecard is a professional, ready-to-use template that helps teams, organizations, and analysts measure and monitor performance across all competitive and operational KPIs. This guide explains the scorecard structure, features, and best practices so you can get started quickly.
Click to Purchases E-sports KPI Scorecard in Excel
Introduction
The E-sports KPI Scorecard centralizes KPI tracking for gaming teams, tournament organizers, and performance analysts. It provides Month-to-Date (MTD) and Year-to-Date (YTD) comparisons, trend visualization, and easy data entry to keep your metrics accurate and actionable.
Key Features of E-sports KPI Scorecard
- Intuitive Scorecard dashboard with dropdown filters for month and period (MTD / YTD).
- Clear Actual vs Target comparisons with visual indicators and conditional formatting.
- Dedicated KPI Trend sheet showcasing MTD and YTD trend charts for Actual, Target, and Prior Year (PY).
- Input Data sheet for simple, structured data entry and updates.
- KPI Definition sheet for documenting KPI name, group, unit, formula, and definition.
Dashboard Pages Explanation
The template contains four worksheets designed for ease of use. Each worksheet plays a specific role in your analytics workflow.
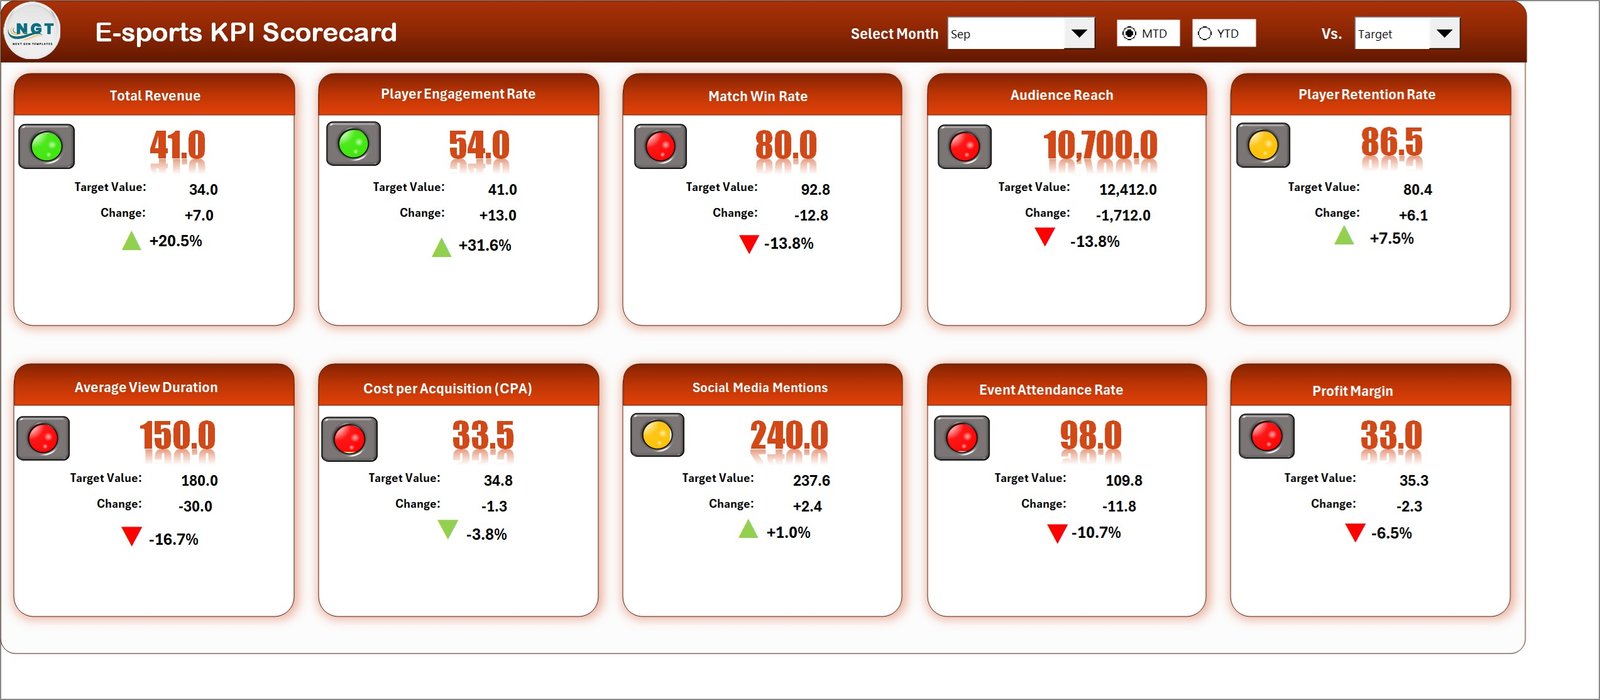
1. Scorecard Sheet
The Scorecard sheet is the main interface where you can view KPI performance and quickly assess where attention is needed.
- Dropdown Menus: Select the month and the period view (MTD or YTD).
- Actual vs Target Values: Side-by-side comparison to evaluate performance.
- Visual Indicators: Color-coded statuses (e.g., green/yellow/red) for quick insight.
- Comprehensive KPI Overview: Displays KPI details, MTD and YTD comparisons, and variance.
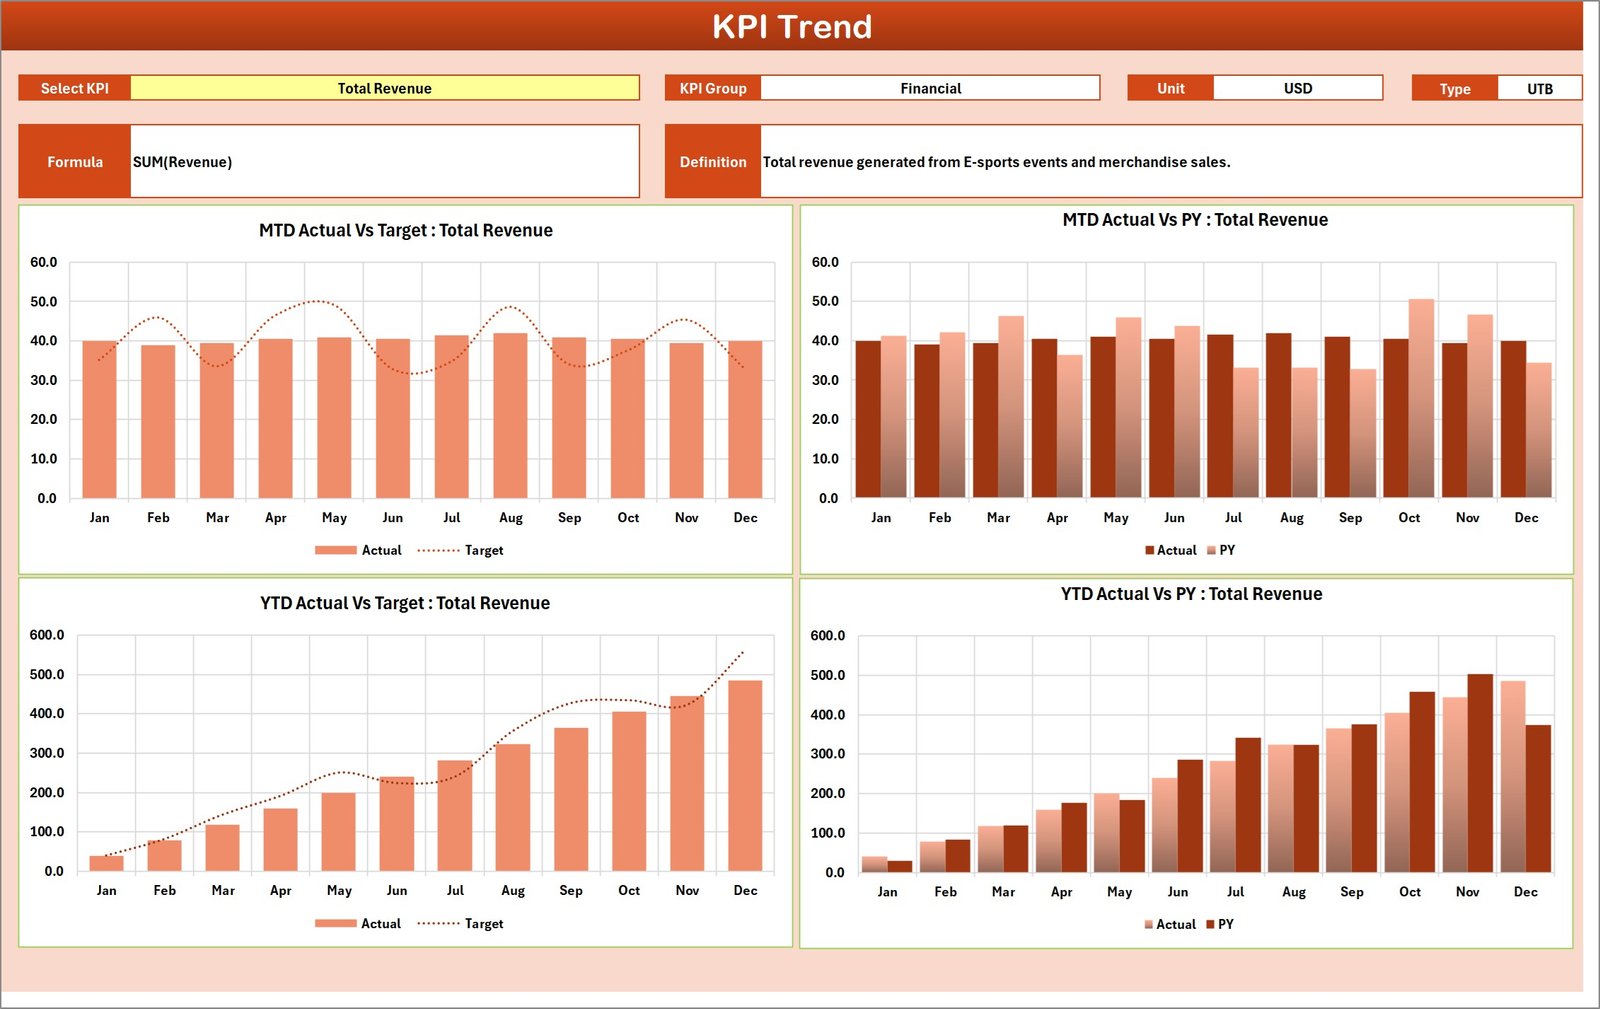
2. KPI Trend Sheet
Use the KPI Trend sheet to deep-dive into how a single KPI performs over time. Select the KPI from the dropdown in cell C3 to populate all related details.
- KPI Group: Shows which area the KPI belongs to (e.g., Performance, Engagement).
- Unit of KPI: The measurement unit (e.g., %, kills per game, avg viewership).
- Type of KPI: Indicates whether lower is better or higher is better.
- Formula & Definition: Clearly documents how the KPI is calculated and what it means.
- MTD and YTD Trend Charts: Visualize Actual, Target, and PY values across months.
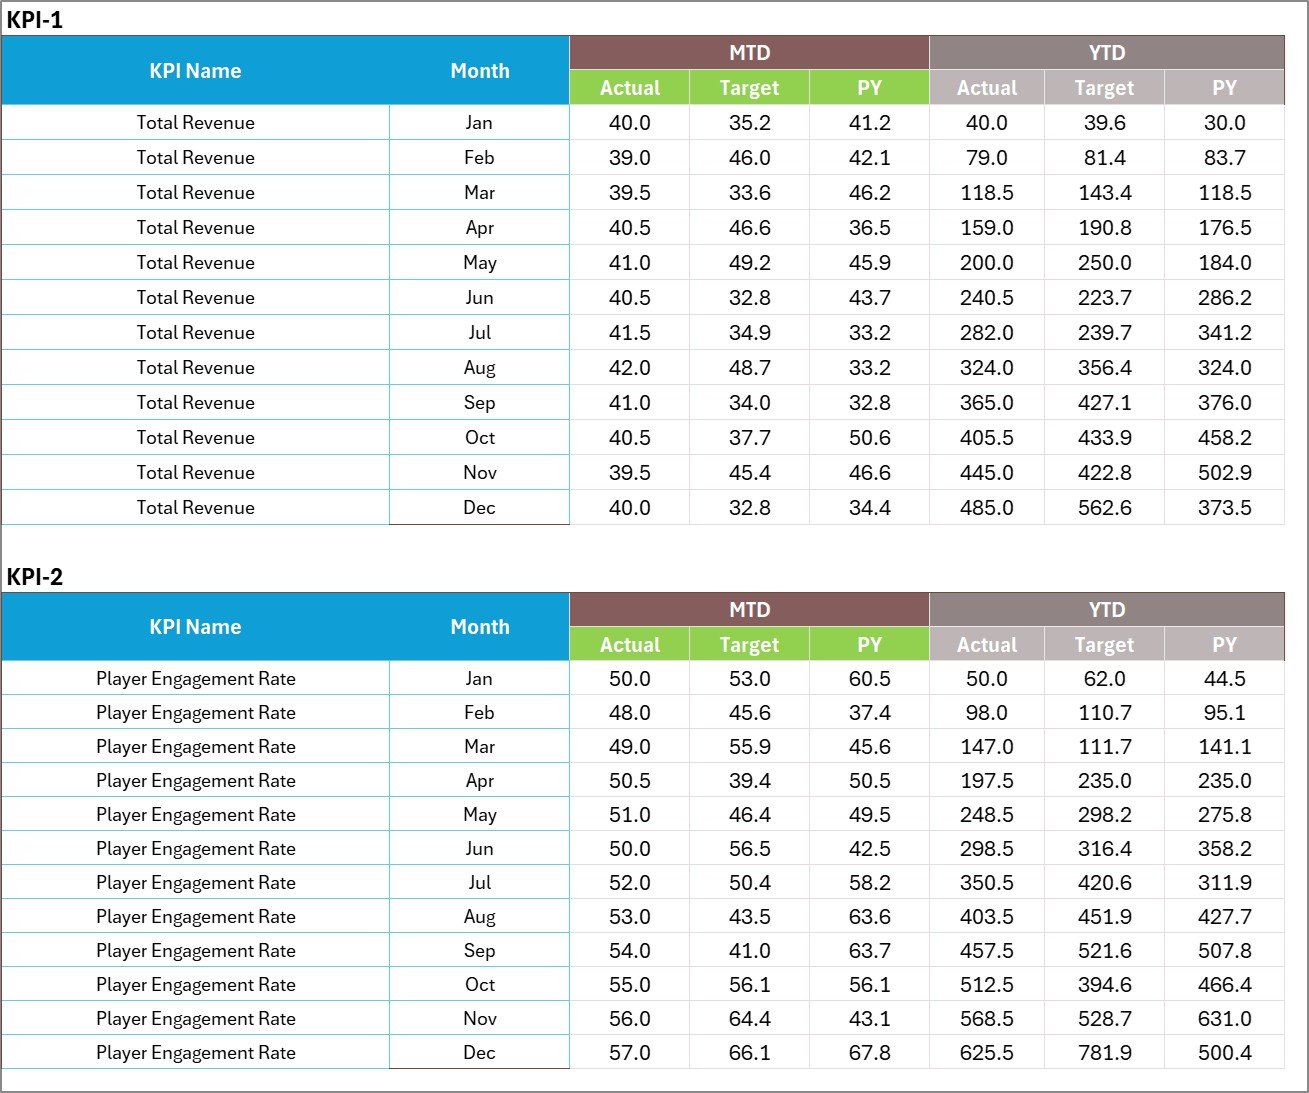
3. Input Data Sheet
The Input Data sheet is where you enter all KPI values. It is structured to make updates quick and reduce entry errors.
- Data Entry: Record actuals, targets, and other metrics by month and KPI.
- Flexibility: Add new KPIs or months without breaking calculations.
- Validation: Use consistent formats and optional data validation to protect data quality.
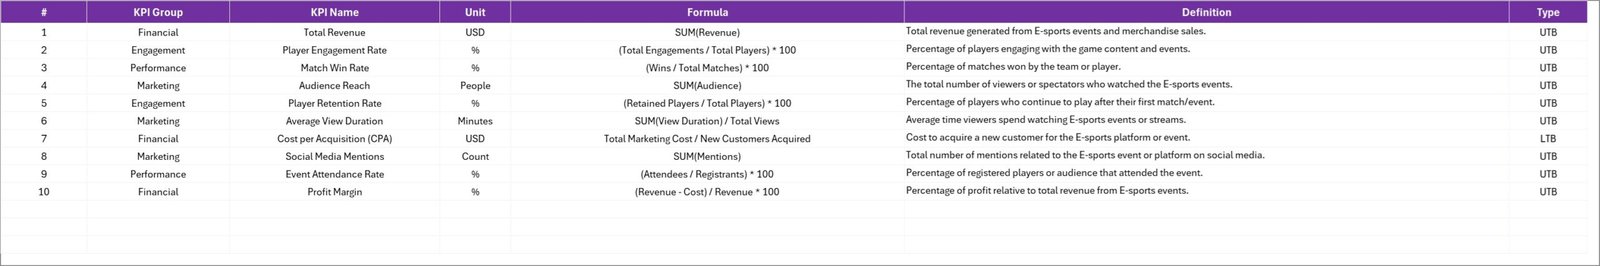
4. KPI Definition Sheet
This sheet centralizes the metadata for each KPI so everyone understands what they measure and how they are calculated.
- Enter KPI Name, KPI Group, Unit, Formula, and Definition.
- Keep definitions concise so report consumers and stakeholders get consistent interpretation.
Advantages of E-sports KPI Scorecard
- Centralized insights: One place to view performance across multiple KPIs and timeframes.
- Faster decisions: Visual indicators and trend charts speed up analysis.
- Consistency: Standardized KPI definitions and formulas reduce confusion.
- Scalability: Add new KPIs or metrics as your organization grows.
- Collaboration: Easy to share with coaches, analysts, sponsors, and stakeholders.
Opportunities for Improvement
- Automate data imports from tournament platforms and streaming analytics to reduce manual entry.
- Integrate with BI tools like Power BI or Tableau for interactive dashboards and live refresh.
- Add role-based views to surface only the most relevant KPIs for coaches, players, or sponsors.
- Enhance predictive analytics to forecast trends using historical data and machine learning models.
Best Practices
- Define KPIs clearly in the KPI Definition sheet before using them in reports.
- Keep input data consistent—use fixed formats and units.
- Review targets periodically and update based on season changes or team goals.
- Use conditional formatting with clear thresholds to avoid misinterpretation.
- Backup your workbook and track changes, especially before major updates.
FAQs
Q: Who should use the E-sports KPI Scorecard?
A: Coaches, team analysts, tournament managers, content teams, and performance directors will all benefit from the template.
Q: Can I connect this template to live data?
A: Yes. For live, interactive reporting, connect the input sheet or data source to Power BI, Tableau, or Google Data Studio. Microsoft Power BI documentation is a good starting point: Power BI Documentation.
Q: How do I choose KPIs for my team?
A: Focus on 5–10 KPIs that tie directly to your competitive goals—match outcomes, kill/death ratios, objective control, viewer engagement, and sponsorship activation metrics are common examples.
Click to Purchases E-sports KPI Scorecard in Excel
Conclusion
The E-sports KPI Scorecard is a practical, flexible template for tracking performance, comparing MTD and YTD values, and visualizing trends. Use the four-sheet structure—Scorecard, KPI Trend, Input Data, and KPI Definition—to standardize measurement and accelerate insights across your organization.
For more advanced reporting, combine this scorecard with BI tools and automated data feeds to reduce manual effort and unlock predictive insights.
External resources:
- Microsoft Power BI — for interactive dashboards and live data integration.
- Google Analytics — for tracking web and streaming engagement metrics.
Visit our YouTube channel to watch the demo: Youtube.com/@NextGenTemplates


