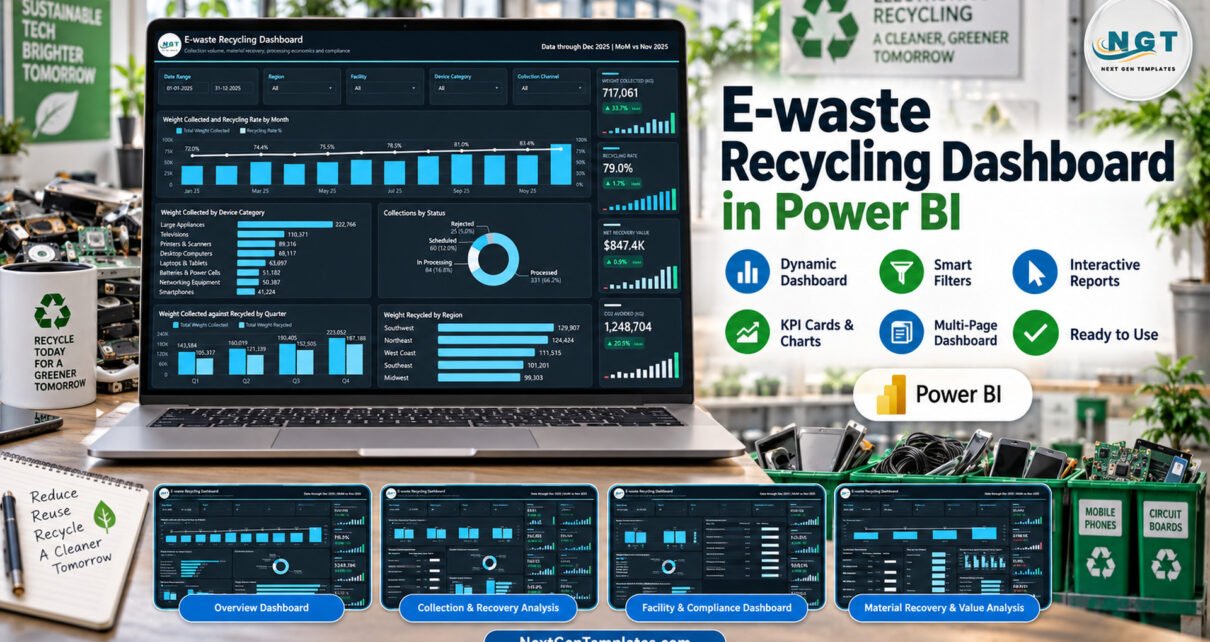
Electronic waste reporting quickly becomes fragmented when collection weights, device types, recovered materials, facilities, compliance fields and processing costs live in separate files. The e-waste recycling dashboard in Power BI brings those dimensions into five interactive pages. Its 500-row sample source produces 717,061 kg collected, 566,350 kg recycled, a 79.0% recycling rate and 1,248,704 kg of CO2 avoided, giving analysts a realistic structure to replace with their own records.
This downloadable PBIX is a reporting template, not a certification, audit or regulatory filing system. It includes Data.xlsx and a user manual, and it is designed for users who want an editable Power BI e-waste dashboard without building every page from a blank canvas.
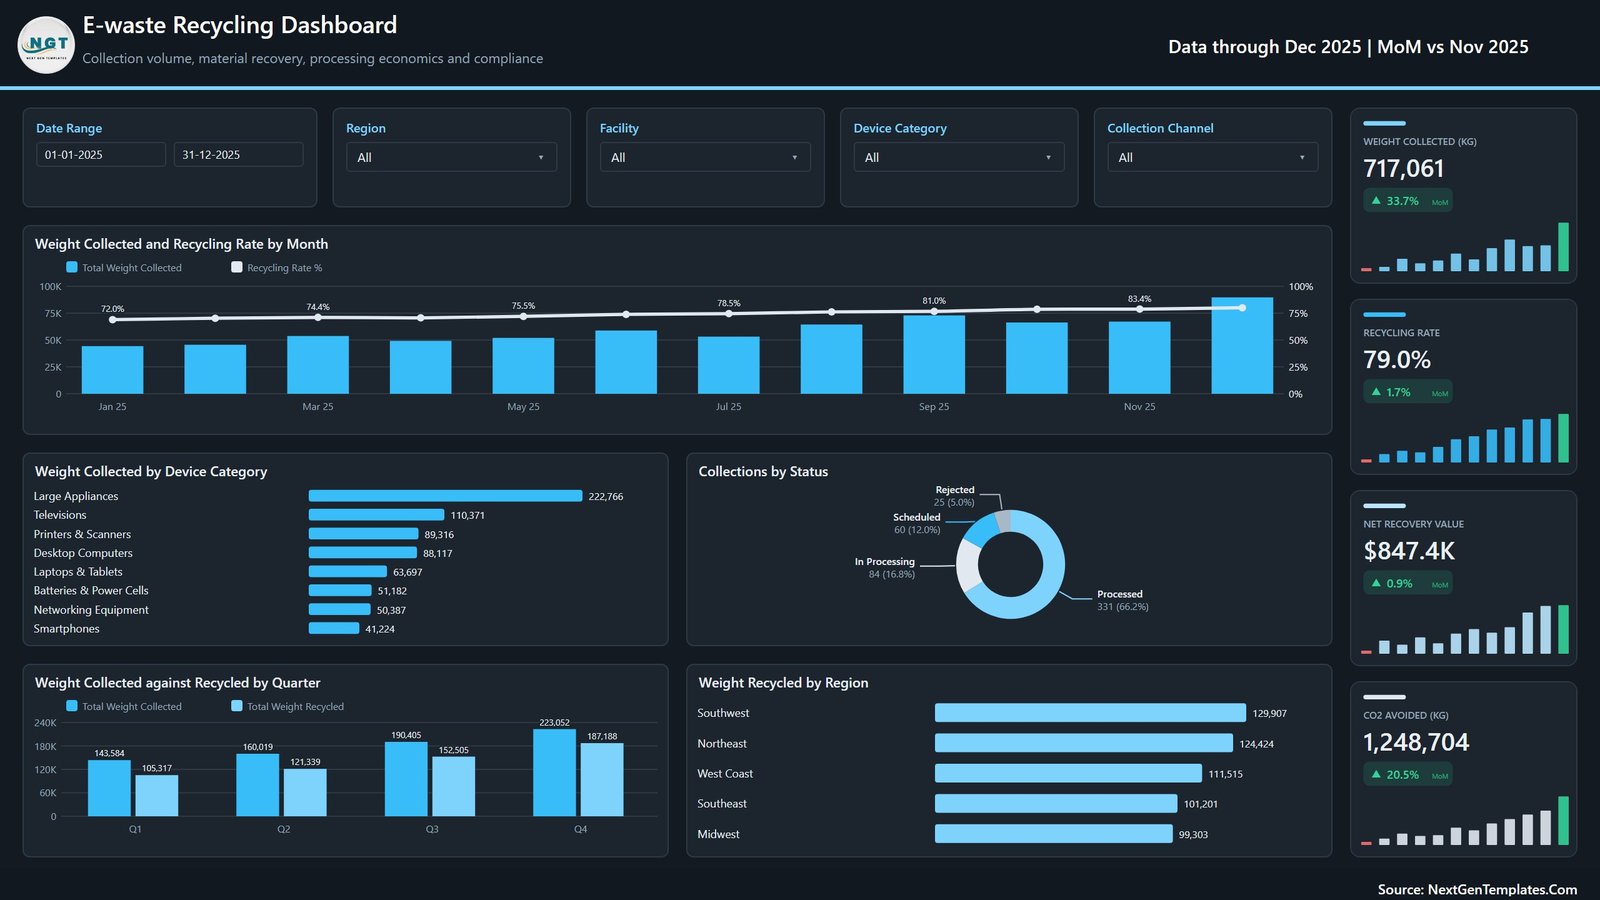
Overview page of the e-waste recycling dashboard
Key Features of E-waste Recycling Dashboard in Power BI
- Five connected pages for overview, collection, material recovery, facilities and financial analysis.
- Reusable filters for date range, region, facility, device category, collection channel and recovered material.
- Operational measures covering collected weight, recycled weight, residual waste, recycling rate and processing status.
- Environmental indicators for CO2 avoided, hazardous-content percentage and certification groupings.
- Recovery economics including recovered value, processing cost, net value, net margin and value per kilogram.
- Editable source package with PBIX, Data.xlsx and a user manual.
Dashboard Pages Explanation
1. Overview Page
The overview combines headline cards with monthly, quarterly, category, status and regional analysis. Users can start with weight collected, recycling rate, net recovery value and CO2 avoided, then examine why those totals changed. In the sample view, large appliances contribute the most collected weight, while the status chart separates processed, in-processing, scheduled and rejected consignments.
The four KPI cards also show month-over-month context, while the main date, region, facility, device-category and collection-channel filters provide a consistent route into the analysis. Because the sample data covers January through December 2025, the page can demonstrate seasonal movement without implying that those figures describe a real recycling operator.
2. Collection and Recovery Analysis
This page explores collections and average weight by month, a quarterly scorecard, monthly recycled weight, CO2 avoided by quarter and collection-channel volume. It helps operations teams compare drop-off centres, corporate pickup, retail take-back, municipal drives and mail-in programmes.
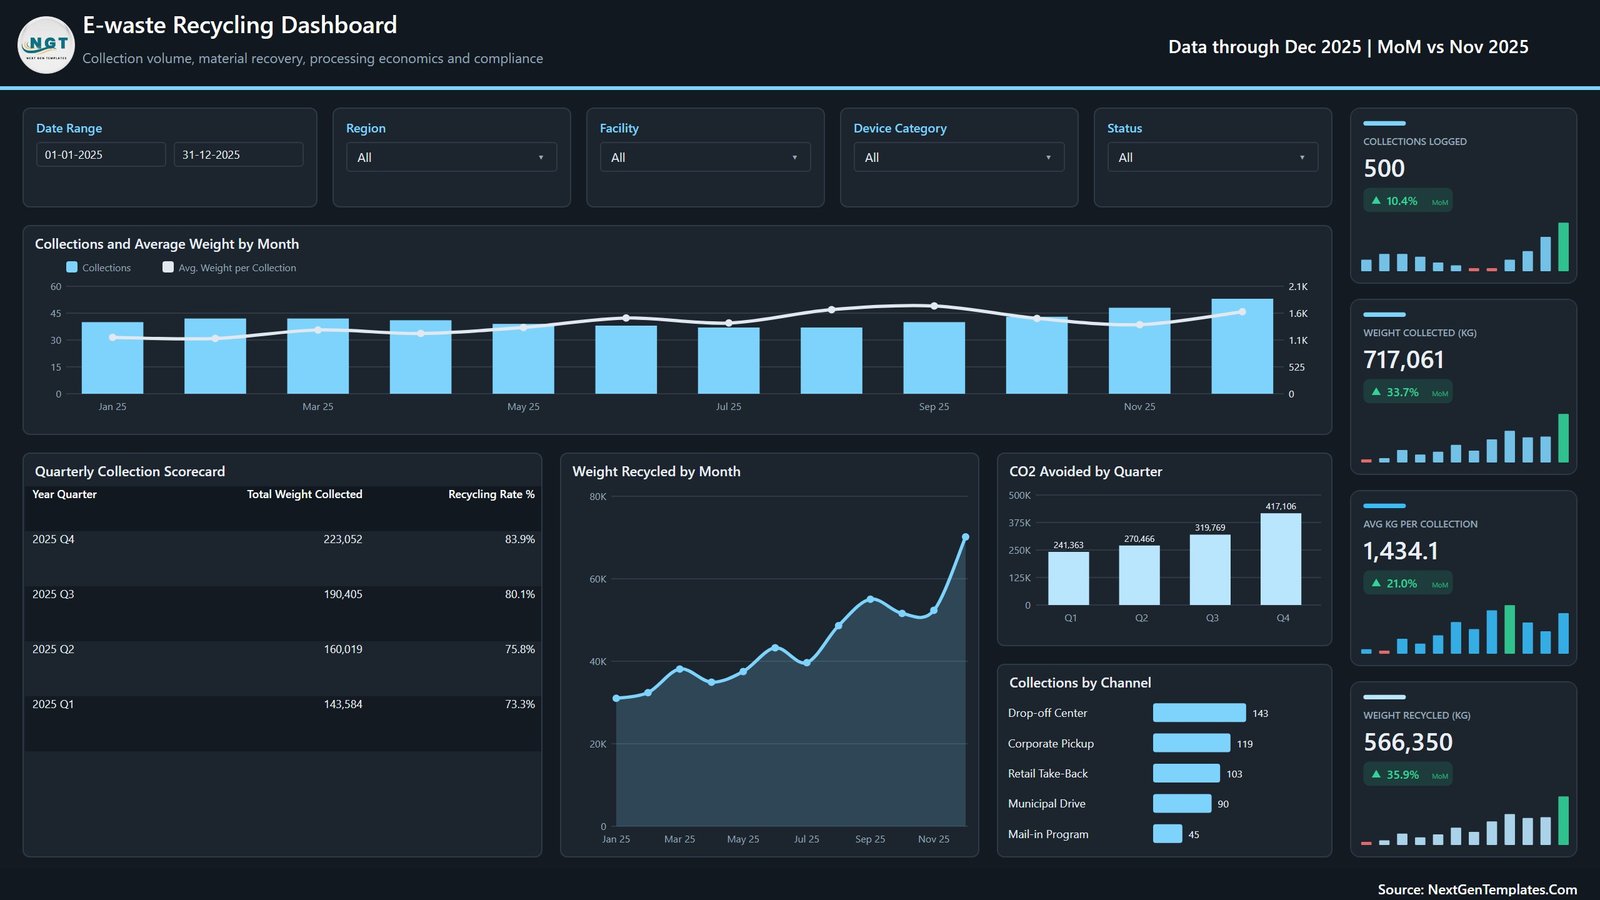
Collection and recovery analysis
3. Device and Material Recovery
The third page compares collected and recycled weight by device category, adds a device recovery scorecard, ranks recovered value by material and tracks residual waste by quarter. A channel chart shows where recycled weight originated. This makes the page useful for a team evaluating recovery yield across appliances, televisions, computers, batteries and other device groups.
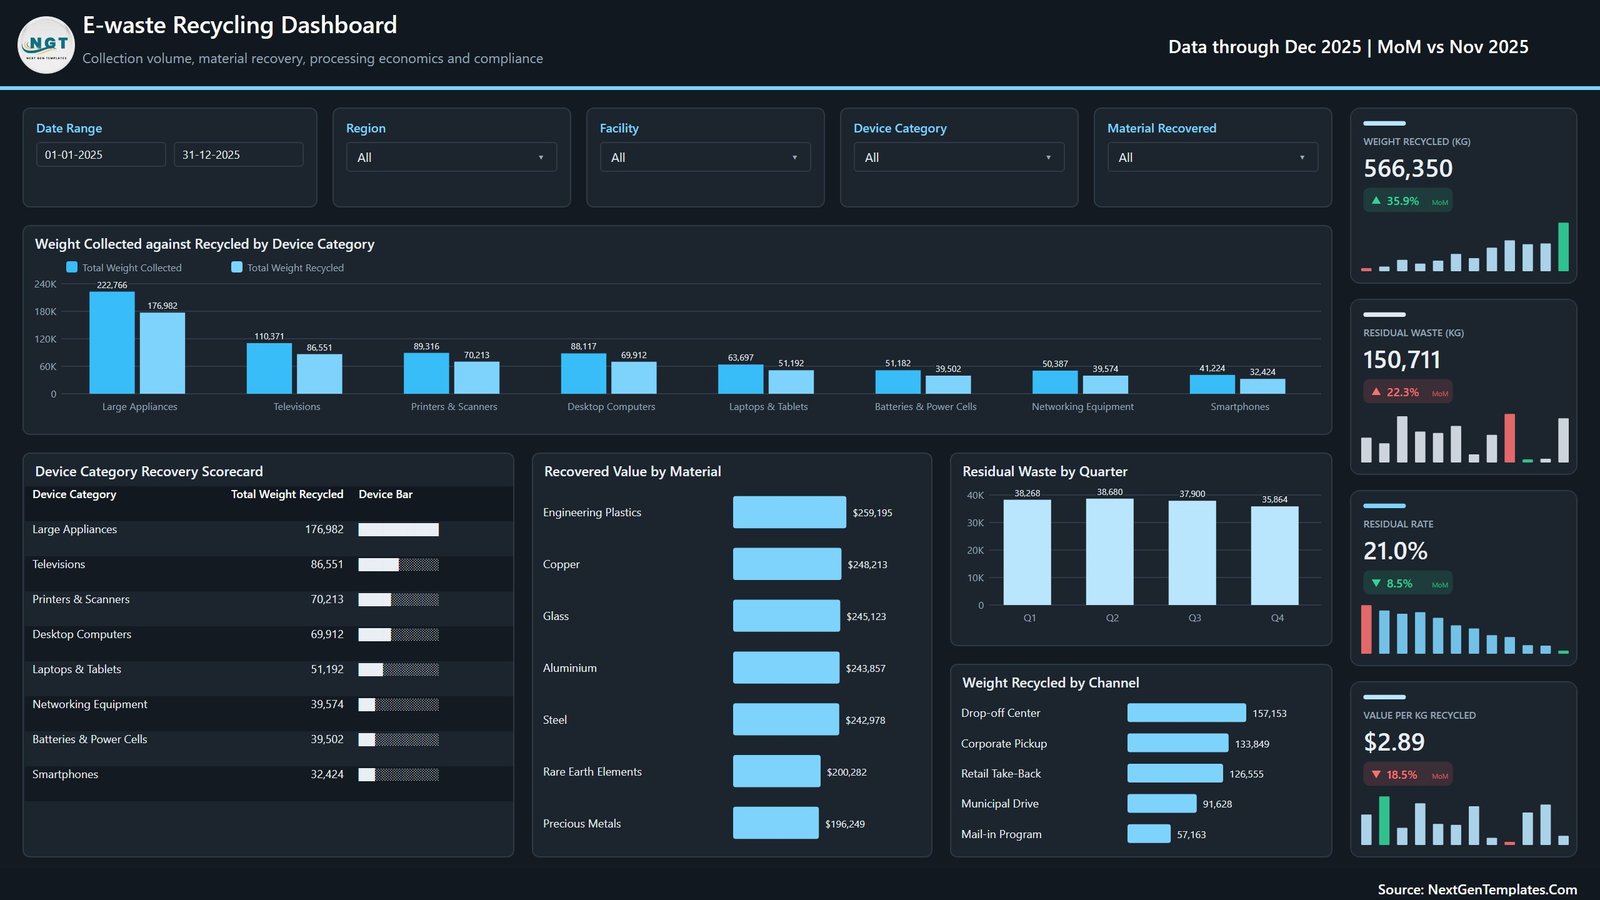
Device and material recovery
4. Facility and Compliance
This page compares collection and recycling weight by facility and provides supporting views for facility operations, certification, hazardous content and regional rejection rate. The report treats certification and compliance-score values as data attributes supplied by the user. It does not validate WEEE, R2, e-Stewards, ISO 14001 or any legal requirement.
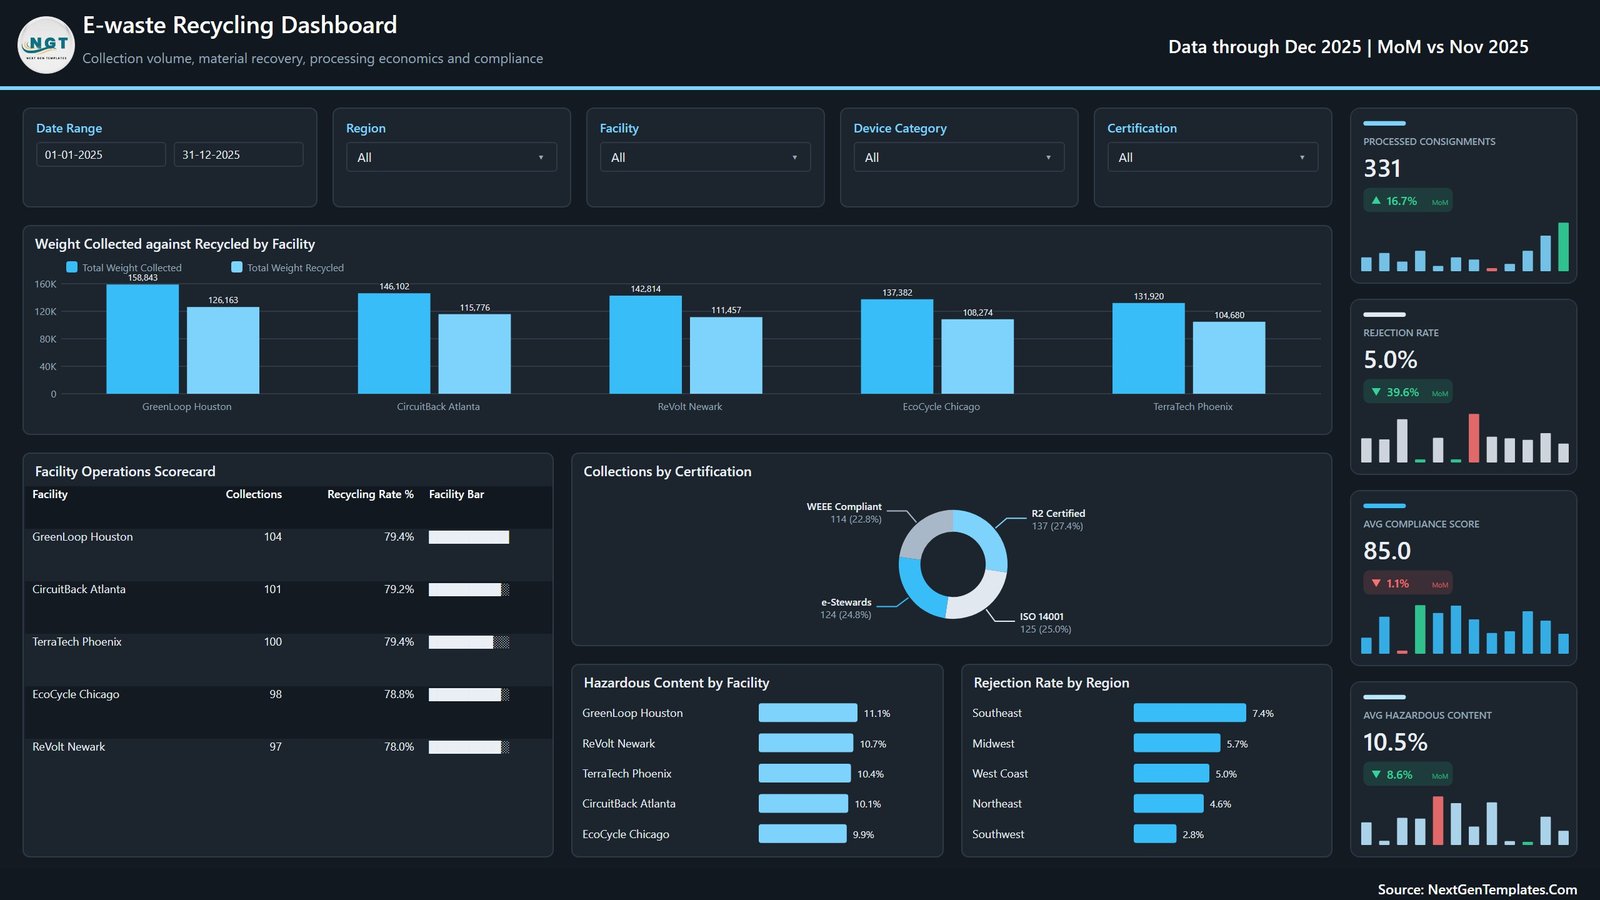
Facility and compliance analysis
5. Financial and Value Analysis
The final page compares net recovery value and net margin by quarter, value per kilogram by material, recovered value against processing cost by region and customer rating by channel. It gives finance and operations teams a shared view of recovery economics without claiming to replace an accounting system.
In the supplied sample, the page reports $1.64 million of recovered value, $788.5 thousand of processing cost and a 51.8% net margin. These totals are useful for checking that the refreshed model responds as expected; buyers should replace them and reconcile the resulting figures to their own approved financial records.
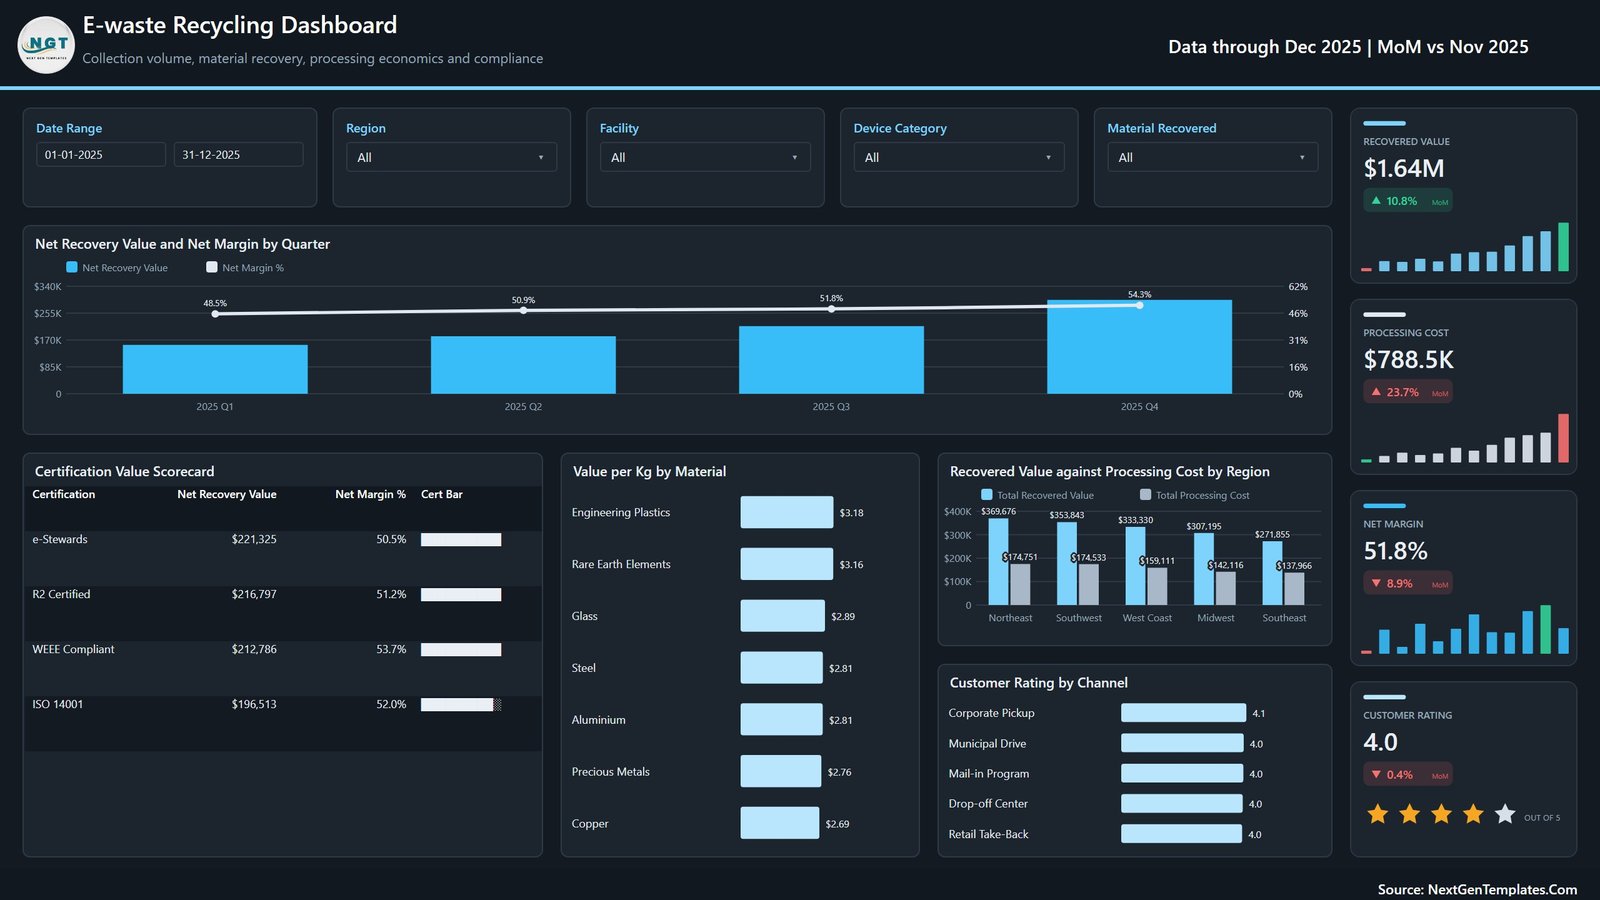
Financial and value analysis
E-waste Recycling Dashboard in Power BI vs. Excel vs. Paid Recycling SaaS – Feature Comparison
| Feature | Power BI template | Excel alternative | Paid recycling SaaS |
|---|---|---|---|
| Cost | $17.99 one-time | One-time template cost | Recurring subscription |
| Platform | Power BI Desktop | Microsoft Excel | Vendor cloud |
| Setup time | Replace source and refresh | Replace rows and refresh pivots | Implementation and onboarding |
| Interactive filtering | Native report slicers | Workbook filters and slicers | Depends on plan |
| Sharing | Depends on your Power BI licensing and workspace | File or Microsoft 365 sharing | Usually login based |
| Custom fields | Editable model and visuals | Editable workbook | Vendor controlled |
| Five-user year-one cost | Template plus your Microsoft licensing | Template plus Microsoft licensing | Often a multi-user subscription |
| E-waste analysis | Five included pages | Separate Excel edition available | Depends on vendor module |
Who Should Use This Template
Recycling operators, take-back programme managers, sustainability analysts, circular-economy consultants, collection-centre teams and finance partners can use the report as a starting point. It also suits learners who want a structured electronic waste recycling dashboard, a waste collection analytics Power BI example or a reusable recycling performance dashboard.
It is not suitable for teams expecting route optimization, barcode scanning, weighbridge integration, chain-of-custody controls, customer billing, regulatory submissions or live connections to recycling software out of the box.
Real-World Use Cases
Monthly operations review
An operations manager filters to one facility, compares collection volume and recycled weight, then reviews rejection and residual-waste patterns before a team meeting.
Material recovery discussion
A sustainability analyst ranks materials by recovered value, compares device-category recovery and checks the sample CO2-avoided metric. The analyst documents the organisation’s own calculation method before external use.
Recovery economics review
A finance partner compares recovered value and processing cost by region, then reviews net margin by quarter. The report supports discussion; accounting entries remain in the organisation’s financial system.
Advantages of E-waste Recycling Dashboard in Power BI
- Starts with a coherent five-page information architecture.
- Combines operational, environmental and financial views without forcing them onto one crowded canvas.
- Includes a 500-record source table with clear fields and sample values.
- Lets experienced Power BI users adapt visuals, filters, calculations and connections.
- Uses a one-time template price rather than a recurring dashboard subscription.
Opportunities for Improvement
The supplied version uses Data.xlsx rather than a live database or API. A production deployment may need Power Query changes, a data gateway, refresh scheduling and access controls. The report also relies on clean category names and consistent units; inconsistent facility, material or device labels will split totals across multiple groups.
Compliance score, CO2 avoided and certification fields require governance. Define who owns each field, how it is calculated and whether it is appropriate for external reporting. The template itself does not provide assurance.
Best Practices
- Keep a backup of the original PBIX and source workbook.
- Preserve the Data.xlsx headers while replacing sample rows.
- Use consistent kilograms, currency, dates and category names.
- Validate report totals against the source after every refresh.
- Document your CO2-avoided and compliance-score methodology.
- Test row-level security and workspace permissions separately if you publish through the Power BI Service.
Microsoft’s Power BI data refresh guidance explains refresh options and their requirements.
Explore Relevant Templates
For a spreadsheet edition, read about the E-waste Recycling Dashboard in Excel. For adjacent Power BI reporting approaches, see the Recycling Infrastructure Dashboard in Power BI and Waste Management Dashboard in Power BI. These are published same-host resources and cover distinct templates.
Download the E-waste Recycling Dashboard in Power BI from NextGenTemplates.
Frequently Asked Questions
What does the download include?
The customer ZIP includes the PBIX report, Data.xlsx and a Power BI dashboard user manual.
How many pages are in the report?
There are five visible report pages: Overview, Collection and Recovery, Device and Material Recovery, Facility and Compliance, and Financial and Value Analysis.
Can I replace the sample data?
Yes. Preserve the columns and data types, replace the sample rows, update the source path if requested and refresh the model.
Does the report prove compliance or certification?
No. It only visualizes user-supplied fields. It does not audit or certify WEEE, R2, e-Stewards, ISO 14001 or other requirements.
Does it include live integrations?
No. The shipped source is Data.xlsx. Database, API, gateway and scheduled-refresh work is outside the package.
Can I publish it to Power BI Service?
You can use your own Microsoft account and licensing, subject to your organisation’s permissions and data policies.
About the Author
Built by PK – Microsoft Certified Professional with 15+ years of Excel, Google Sheets, and Power BI experience. Founder of NextGenTemplates, reaching 300K+ subscribers across YouTube channels. Every template is hand-built and tested before release.
Conclusion
The E-waste Recycling Dashboard in Power BI gives teams a practical reporting layer for collections, recycling, residual waste, materials, facilities, certification fields and recovery economics. Its value is the ready-made structure: replace the sample source, refresh, validate and adapt the five pages to your process.
Download the template from NextGenTemplates and turn your structured e-waste records into a clearer reporting workflow.
Visit YouTube.com/@PKAnExcelExpert for Power BI and Excel dashboard tutorials.
Last updated: September 16, 2026