Eco resorts operate in a unique business environment. On one hand, they must deliver memorable guest experiences. On the other hand, they must protect nature, control costs, and meet sustainability goals. Because of these combined challenges, traditional reporting methods often fail to give a complete picture.
So, how can eco resorts track performance clearly and consistently?
The answer lies in using an Eco Resorts KPI Dashboard in Power BI.
This detailed guide explains what an Eco Resorts KPI Dashboard in Power BI is, why eco resorts need it, how it works, its dashboard structure, advantages, and best practices. By the end of this article, you will clearly understand how this dashboard helps eco resorts make smarter, faster, and more sustainable decisions.
Click to buy Eco Resorts KPI Dashboard in Power BI
What Is an Eco Resorts KPI Dashboard in Power BI?
An Eco Resorts KPI Dashboard in Power BI is a centralized performance tracking solution designed to monitor key operational, financial, and sustainability metrics of eco resorts.
Instead of reviewing multiple Excel files or manual reports, resort managers use this dashboard to view all KPIs in one interactive screen. As a result, decision-makers can identify issues quickly and act confidently.
Moreover, because the dashboard uses Power BI, it delivers interactive visuals, slicers, KPI indicators, and drill-through options. Therefore, users can analyze performance month-wise, KPI-group-wise, and trend-wise without technical complexity.
Why Do Eco Resorts Need a KPI Dashboard?
Eco resorts deal with diverse KPIs such as occupancy rates, revenue per room, energy usage, water consumption, waste reduction, and guest satisfaction. However, when teams track these KPIs manually, problems often arise.
Here is why eco resorts need a KPI dashboard:
- Manual reports consume time and create errors
- KPI performance remains unclear across months
- Sustainability targets become hard to track
- Management struggles to compare current and past performance
- Decisions become reactive instead of proactive
Therefore, an Eco Resorts KPI Dashboard in Power BI solves these problems by offering clarity, accuracy, and visibility.
How Does an Eco Resorts KPI Dashboard in Power BI Work?
The Eco Resorts KPI Dashboard uses Excel as a data source and Power BI for visualization. Because of this setup, even non-technical users can maintain and update the dashboard easily.
The workflow looks like this:
- Enter actual KPI data in Excel
- Enter target KPI data in Excel
- Maintain KPI definitions in a separate Excel sheet
- Refresh the Power BI dashboard
- Instantly view updated KPI performance
As a result, resort teams spend less time preparing reports and more time improving operations.
What Are the Key Pages in the Eco Resorts KPI Dashboard in Power BI?
This ready-to-use dashboard contains three structured pages, each serving a specific purpose.
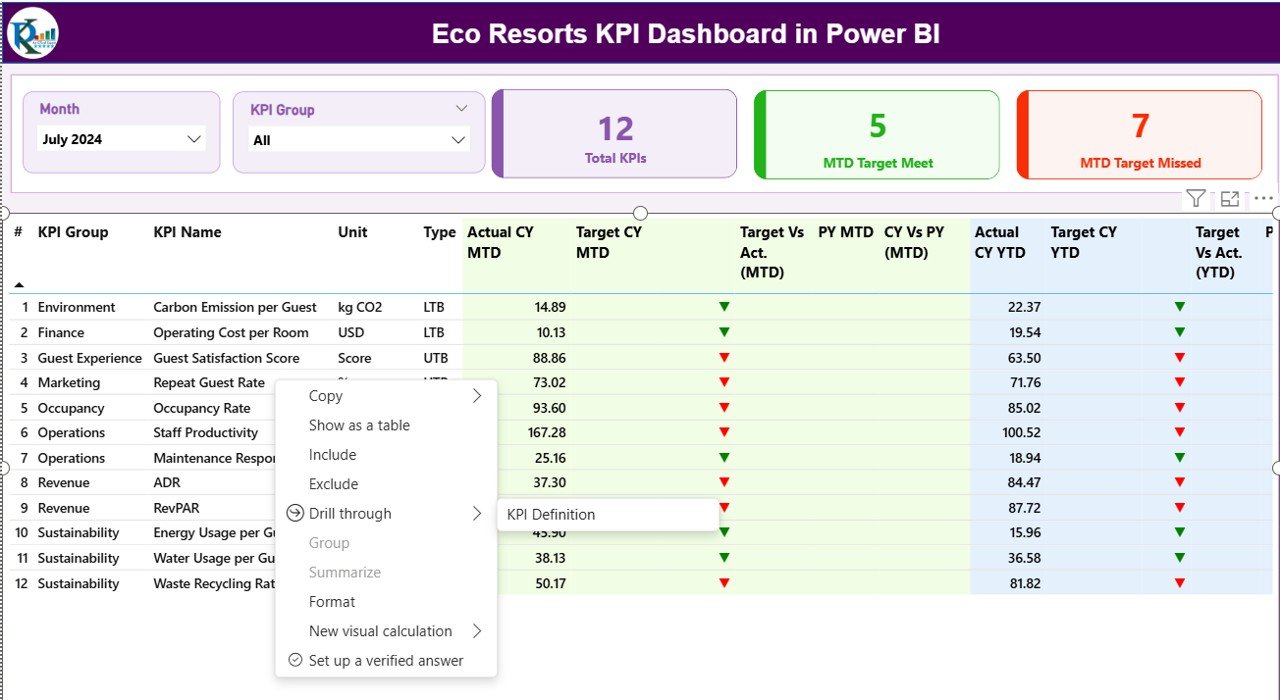
What Does the Summary Page Show in the Eco Resorts KPI Dashboard?
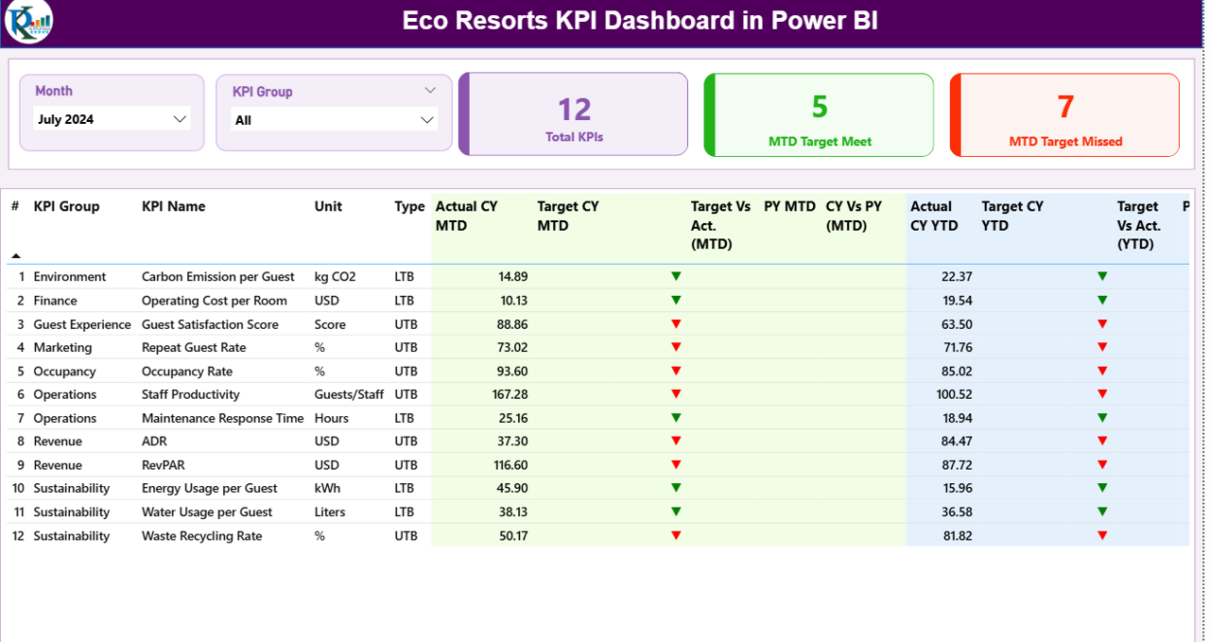
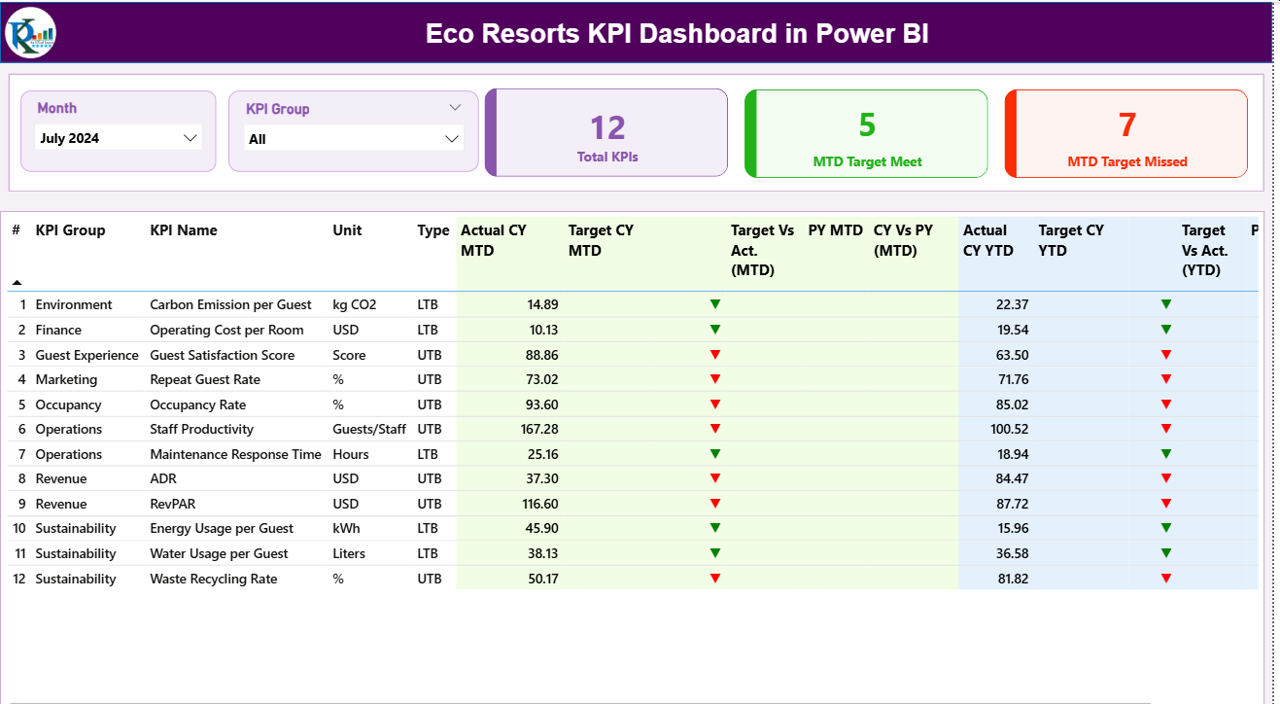
The Summary Page acts as the main control center of the dashboard.
At the top, users see interactive slicers:
- Month slicer
- KPI Group slicer
These slicers allow quick filtering and focused analysis.
KPI Cards on the Summary Page
The summary page displays three important KPI cards:
- Total KPIs Count – Shows the total number of tracked KPIs
- MTD Target Met Count – Shows how many KPIs met the target for the current month
- MTD Target Missed Count – Shows how many KPIs failed to meet the target
Because these cards update instantly, managers get an immediate performance snapshot.
What Details Appear in the KPI Table on the Summary Page?
Below the KPI cards, the dashboard shows a detailed KPI table that provides deep insights.
Key Columns Explained
- KPI Number – Sequence number of the KPI
- KPI Group – Category of the KPI such as Operations, Sustainability, Finance
- KPI Name – Name of the KPI
- Unit – Measurement unit such as %, count, liters, or currency
- Type – LTB (Lower the Better) or UTB (Upper the Better)
Month-to-Date (MTD) Metrics
- Actual CY MTD – Current year actual MTD value
- Target CY MTD – Current year target MTD value
- MTD Icon – Green ▲ or Red ▼ icon showing performance status
- Target vs Actual (MTD) – Percentage calculated as Actual ÷ Target
- PY MTD – Previous year MTD value
- CY vs PY (MTD) – Comparison percentage between current and previous year
Year-to-Date (YTD) Metrics
- Actual CY YTD – Current year actual YTD value
- Target CY YTD – Current year target YTD value
- YTD Icon – Visual indicator showing YTD status
- Target vs Actual (YTD) – Percentage calculated as Actual ÷ Target
- PY YTD – Previous year YTD value
- CY vs PY (YTD) – Performance comparison with last year
Because of this structure, users can analyze short-term and long-term performance in one view.
Click to buy Eco Resorts KPI Dashboard in Power BI
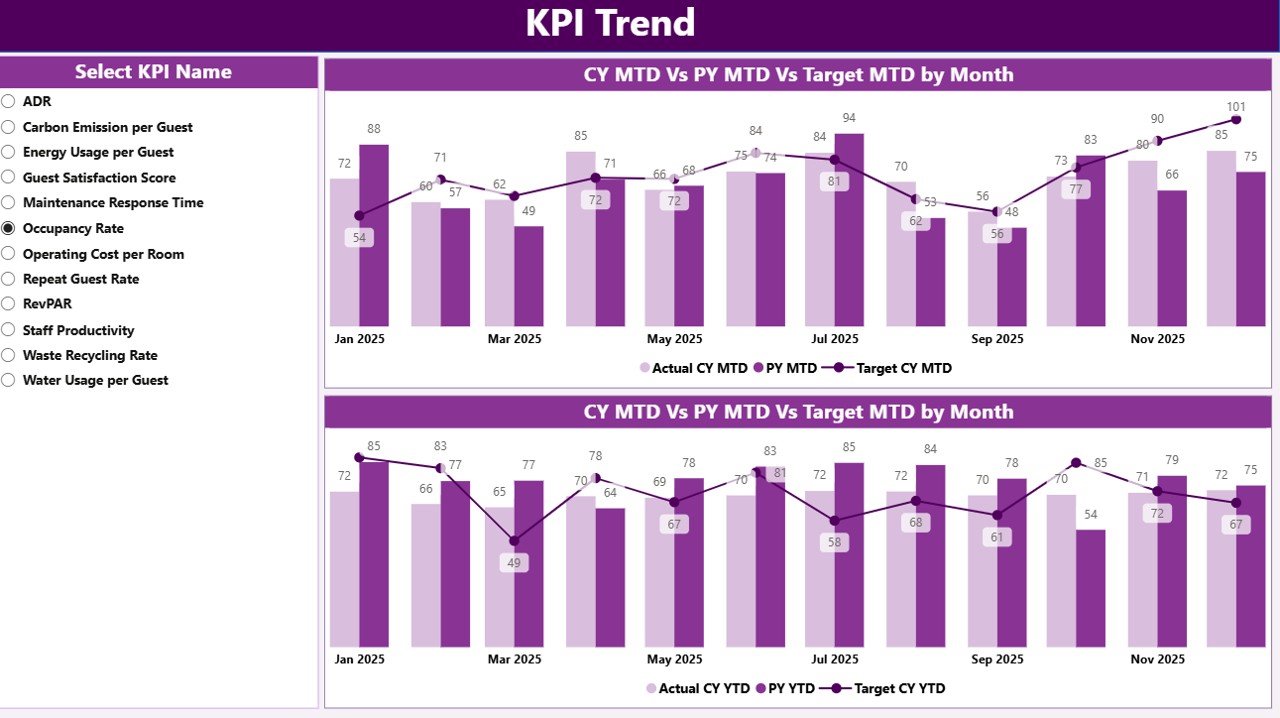
How Does the KPI Trend Page Help in Analysis?
The KPI Trend Page focuses on performance trends over time.
On the left side, users can select a KPI Name slicer. Once selected, the dashboard displays two powerful combo charts.
Trend Charts Available
- MTD Trend Chart – Shows Current Year Actual, Previous Year Actual, and Target
- YTD Trend Chart – Shows Current Year Actual, Previous Year Actual, and Target
These charts help resort managers answer critical questions such as:
- Are KPIs improving month by month?
- Are sustainability goals on track?
- How does current performance compare to last year?
As a result, trend analysis becomes fast and visual.
Click to buy Eco Resorts KPI Dashboard in Power BI
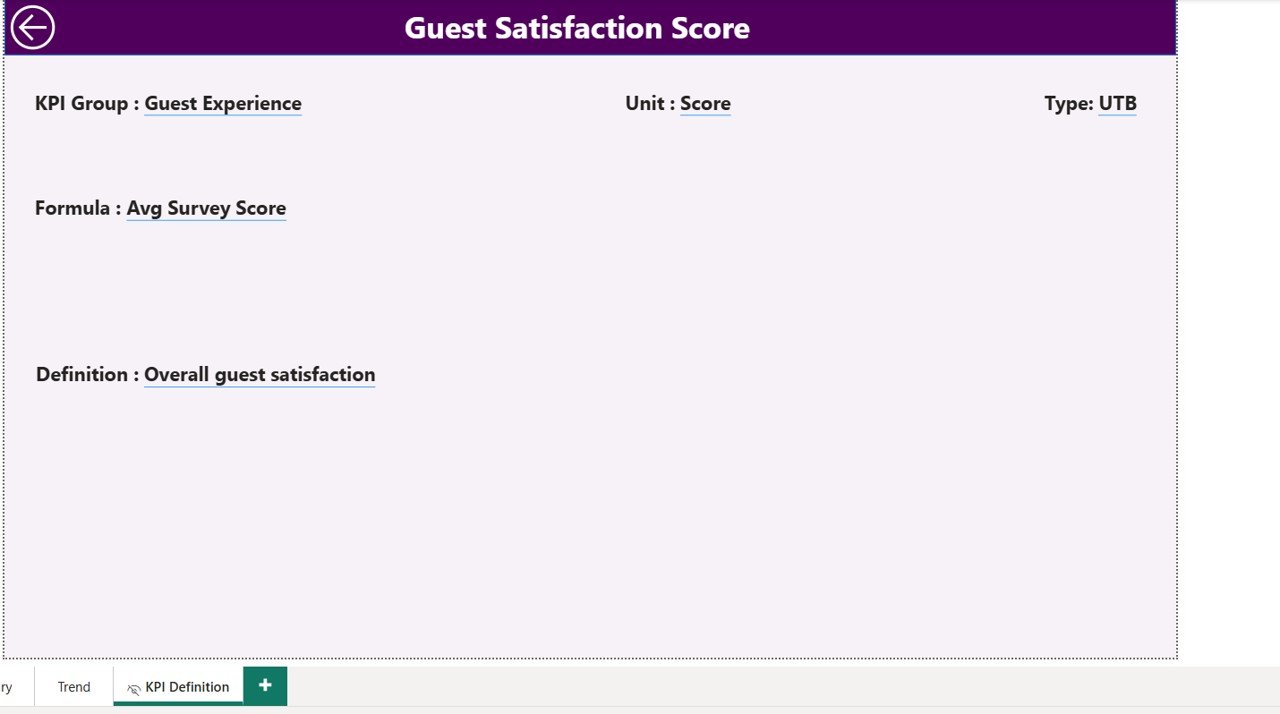
What Is the KPI Definition Page and Why Is It Important?
The KPI Definition Page acts as a drill-through reference page.
Although the page remains hidden, users can access it directly from the summary page using drill-through.
Information Available on the KPI Definition Page
- KPI Number
- KPI Group
- KPI Name
- Unit of Measurement
- KPI Formula
- KPI Definition
- KPI Type (LTB or UTB)
Because of this feature, users always understand what each KPI means and how calculations work. Therefore, confusion and misinterpretation reduce significantly.
Click to buy Eco Resorts KPI Dashboard in Power BI
How Is Excel Used as a Data Source for This Dashboard?
The dashboard uses a structured Excel file with three worksheets.
What Is the Input_Actual Sheet Used For?
In the Input_Actual sheet, users enter actual KPI values.
Required columns include:
- KPI Name
- Month (first date of the month)
- MTD Actual Value
- YTD Actual Value
Because data entry remains simple, teams can update KPIs quickly.
Click to buy Eco Resorts KPI Dashboard in Power BI
What Is the Input_Target Sheet Used For?
In the Input_Target sheet, users enter target values.
Required columns include:
- KPI Name
- Month (first date of the month)
- MTD Target Value
- YTD Target Value
This structure ensures accurate comparison between actual and target performance.
What Is the KPI Definition Sheet Used For?
The KPI Definition sheet stores master data.
It includes:
- KPI Number
- KPI Group
- KPI Name
- Unit
- Formula
- Definition
- Type (LTB or UTB)
Because this sheet acts as a reference, it ensures consistency across the dashboard.
Advantages of Eco Resorts KPI Dashboard in Power BI
Using an Eco Resorts KPI Dashboard in Power BI delivers several business and sustainability benefits.
Key Advantages
- Centralized KPI tracking in one dashboard
- Clear visibility of MTD and YTD performance
- Easy comparison with previous year performance
- Strong focus on sustainability and efficiency KPIs
- Reduced reporting time and manual effort
- Improved accountability across departments
- Better data-driven decision-making
As a result, eco resorts gain both operational control and strategic clarity.
Best Practices for the Eco Resorts KPI Dashboard in Power BI
To get maximum value from the dashboard, eco resorts should follow proven best practices.
Best Practices to Follow
- Define KPIs clearly before implementation
- Use consistent units and KPI definitions
- Update Excel data regularly and accurately
- Review MTD performance weekly
- Analyze YTD trends during monthly reviews
- Train managers to use slicers and drill-through
- Align KPIs with sustainability and business goals
Because of these practices, the dashboard remains reliable and impactful.
Conclusion: Why Should Eco Resorts Invest in a KPI Dashboard in Power BI?
Eco resorts must balance profitability, guest satisfaction, and environmental responsibility. However, without clear performance visibility, achieving this balance becomes difficult.
An Eco Resorts KPI Dashboard in Power BI provides a structured, visual, and easy-to-use solution for tracking KPIs effectively. Because it combines Excel simplicity with Power BI intelligence, it empowers eco resort teams to make confident, data-driven decisions.
Ultimately, this dashboard transforms raw data into meaningful insights that support sustainable growth.
Frequently Asked Questions (FAQs)
What is an Eco Resorts KPI Dashboard in Power BI used for?
An Eco Resorts KPI Dashboard in Power BI tracks operational, financial, and sustainability KPIs in one centralized view.
Can non-technical users maintain this dashboard?
Yes, users only need to update Excel sheets. Power BI automatically refreshes the visuals.
What types of KPIs can eco resorts track?
Eco resorts can track occupancy, revenue, energy usage, water consumption, waste reduction, and guest satisfaction KPIs.
Does this dashboard support MTD and YTD analysis?
Yes, the dashboard supports both MTD and YTD performance analysis along with target comparisons.
Can users compare current performance with previous years?
Yes, the dashboard shows CY vs PY comparisons for both MTD and YTD metrics.
Is the KPI Definition page important?
Yes, it ensures clarity by explaining KPI formulas, units, and definitions through drill-through.
Visit our YouTube channel to learn step-by-step video tutorials
Watch the step-by-step video tutorial:
Click to buy Eco Resorts KPI Dashboard in Power BI